Metrics for Requirements
Engineering
Mohammed Javeed Ali
June 15, 2006
Master’s Thesis, 10 credits
Supervisor Jurgen Borstler
Ume˚
a University
Department of Computing Science
SE-901 87 UME˚
A
Abstract
Software quality depends on several factors such as on time delivery, within budget and fulfilling users needs. Quality should be maintained from starting phase of software development. Requirements management play an important role in maintaining qual-ity of software. Software qualqual-ity can be maintained by checking qualqual-ity attributes in requirements documents. Requirements metrics such as volatility, traceability, size and completeness are used to measure requirements. Manual measurement is expensive, time consuming and prone to error therefore automated tools should be used. Automated requirements tools are helpful in measuring requirements metrics. This thesis help in measuring software being developed in company based on quality attributes. Measur-ing requirements metric automatically is shown by evaluatMeasur-ing Automated Requirements Tools.
Contents
1 Introduction 1 2 Requirements Engineering 3 2.1 Introduction . . . 3 2.1.1 Requirements Elicitation . . . 4 2.1.2 Requirements Analysis . . . 4 2.1.3 Requirements Documentation . . . 5 2.2 Requirements Management . . . 82.3 Software Requirements Specification . . . 9
2.4 Summary . . . 12
3 Process Improvement 13 3.1 Introduction . . . 13
3.2 Software Process Improvement Cycle . . . 14
3.2.1 CMM/CMMI . . . 14
3.2.2 BOOTSTRAP . . . 16
3.2.3 GQM . . . 17
3.2.4 SPICE/ ISO/IEC15504 . . . 17
3.2.5 The ISO 9001 Series . . . 18
3.3 Summary . . . 19
4 Software Metrics 21 4.1 Introduction . . . 21
4.2 Objectives of Software Measurement . . . 24
4.3 Types of Metrics . . . 25
4.3.1 Product Metrics . . . 25 4.3.2 Process Metrics . . . 26 4.3.3 Requirements Metrics . . . 27 4.4 Summary . . . 29 5 Requirements Tools 31 5.1 Introduction . . . 31 5.2 Requirements Tools . . . 32
5.2.1 Automated Requirements Measurement Tool - ARM . . . 32
5.2.2 IBM Rational Requisite Pro . . . 33
5.2.3 Dynamic Object Oriented Requirements System . . . 34
5.2.4 Requirements Use Case Tool . . . 36
6 Conclusions and Summary 37
7 Acknowledgements 39
A Acronyms 43
List of Figures
2.1 Requirements Engineering Process Coarse-Grain Activity Model
(accord-ing to [17]) . . . 4
2.2 Data Flow Diagram . . . 6
2.3 Entity Relationship Diagram . . . 6
2.4 Requirements Management Activities (according to [28]) . . . 8
2.5 Traced Vs Traceability (according to [17]) . . . 10
3.1 The Software Process Improvement Cycle (according to [28]) . . . 14
3.2 The CMM five levels of software process maturity with their key process areas (according to [26]) . . . 15
3.3 The BOOTSTRAP Methodology (according to [26]) . . . 16
3.4 The Goal Question Metrics Approach (according to [27]) . . . 17
3.5 An overview of the ISO/IEC 15504 two dimensional architecture (accord-ing to [10]) . . . 18
5.1 IBM Rational Requisite Pro.(reprinted courtesy of [13]) . . . 34
5.2 DOOR Analyst (reprinted courtesy of [25]) . . . 35
List of Tables
4.1 SRS with metrics . . . 22 4.2 Examples of direct measures used in software engineering (with
permis-sion from [11]) . . . 25 4.3 Examples of common indirect measures used in software engineering (with
permission from [11]) . . . 27
5.1 ARM tool evaluation . . . 33
Chapter 1
Introduction
Requirements management is the process of eliciting, documenting and communicating requirements. Requirements management play important role in success of software. It manage changes to requirements and maintain traceability in requirements documents. Requirements can be written using quality attributes known as software requirements specification. Success rate of product depends on process used by organization. Every company need to assess their present approach in order to remain competent in dynamic market. Capability Maturity Model, Goal Question Metrics, BOOTSTRAP, and The ISO 9000 process improvement models are used to assess process and suggest methods to improve them. Once new process are adopted their performance should be checked, therefore measurement of software is necessary. Software can be measured using process, product, resources and requirements metrics.
Requirements metrics are important part of measuring software that is being de-veloped. These include requirements volatility metrics, requirements traceability met-rics, requirements completeness metrics. Measuring requirements manually is a tedious task therefore automated requirements tools should be used. Automated requirements tools help in managing requirements in efficient way. IBM Rational Requisition, Dy-namic Object Oriented Requirements Systems and Requirements Use Case Tool are some prominent automated requirements tools used to measure software. The goal of this thesis is to study, analyze requirements metrics and automated requirements tools. This thesis will help in choosing right metrics to measure software development based on the evaluation of Automated Requirements Tool.
Thesis Outline
Chapter 1 introduces the topic of my thesis. The problem is defined, the methods used to solve the problem are described and goals are mentioned.
Chapter 2 discusses the process of requirement engineering and requirements man-agement followed by software requirements specification.
Chapter 3 introduces Software Process Improvements. Advantage of using these process are also discussed.
In Chapter 4 software metrics are introduced and different requirements metrics are discussed.
Chapter 5 discusses many automated requirements tools and ends with evaluating Automated Requirements Tool.
Chapter 2
Requirements Engineering
2.1
Introduction
Requirements are the description of how a system should behave. Requirements are also knowledge of application domain and constraints on operation of a system. ments management is the process of managing changes to the requirements. Require-ments of a system change to reflect the changing needs of stake holders1. They also
change due to change in environment, business plans and laws.
Requirements engineering is a process of discovering the needs of stake holders and documenting them for analysis, communication and implementation [21]. Many errors can be detected in the requirements phase. Davis [8] claims that fixing of errors detected in later stages of software development are more expensive than the initial stages. If errors are not detected in the requirements phase it leads to wrong product development. Wrong requirements can also lead to wastage of valuable resources.
Collecting requirements is not an easy task. Requirements Engineering has critical problems which can be due to lack of stake holders involvement in the requirements process. Lack of requirements management skills also leads to bad requirements engi-neering. Unclear responsibilities and communication among stake holders can also lead to bad requirements engineering.
Functional requirements or behavioral requirements define functions of the product. Functional requirements include input that the software get and output it generates. Non-Functional requirements or non-behavioral requirements are the properties of soft-ware such as portability, reliability, testability, efficiency and modifiability.
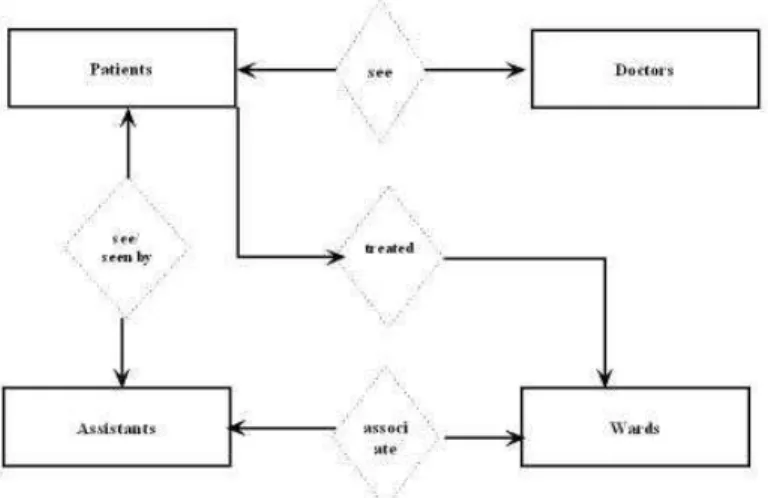
Requirements are developed through requirements engineering. Requirements engi-neering is a process which include a set of activities such as requirements elicitation, requirements analysis and requirements negotiation and validation see figure 2.1. This process is adopted to derive, validate and maintain a system requirements document.
Requirements management is the agreement between software development organiza-tion and the customer. Both reach on agreement by stating, communicating, reviewing and negotiating requirements. Ambiguous requirements, addition of requirements, less specification and insufficient user involvement are reasons for bad requirements genera-tion.
1Stake holders are the people or organizations who will be affected by system. They have either
direct or indirect influence on system requirements.
Figure 2.1: Requirements Engineering Process Coarse-Grain Activity Model (according to [17])
2.1.1
Requirements Elicitation
Requirements elicitation is the process of discovering the requirements of the intended system. Elicitation is to interpret, analyze, model and validate information from stake holders. Kotonya and Sommerville [17] mention that requirements elicitation has to deal with application domain knowledge. For example if the intended system is an automation of post distribution then the requirement engineers should have knowledge about the manual distribution of posts. Clear understanding of stake holders needs is an important issue in requirements elicitation. If needs are not clear than the right product will not be developed.
A clear vision and scope is essential for the system to be built. Requirements should be documented and communicated among all stake holders. As there are many types of users such as novice users, occasional users, frequent users and expert users their application domain knowledge and experience should also be considered while taking requirements.
Nuseibhe and Easterbrook [21] discuss different elicitation techniques. Information about the organization work flow can be gathered by observing the employees. In-terviews, questionnaires, surveys, process models are also good source of information. There is no standard technique to select elicitation technique it varies from project to project.
2.1.2
Requirements Analysis
Requirements Analysis is to solve problems and reach an agreement on changes to re-quirements. As every stakeholder has his/her own requirements therefore the require-ments which cover main functions should be prioritized. Requirerequire-ments analysis some-time is done concurrently with requirements elicitation process. In this phase analysts read requirements. Problems are highlighted and reviewed. Conflicts among stake hold-ers should be solved in this stage. Breaking down the functional requirements into suitable detail level will help the developers to understand and build the system.
A checklist must be prepared for assessing each requirement. It helps in solving prob-lems. Analysis models depict information at higher level of abstract than the textual description of the system requirements. Different diagrams such as Entity Relationship Diagrams (ERD), Data Flow Diagrams (DFD), State Transition Diagrams (STD),
Ac-2.1. Introduction 5
tivity Diagrams, and Use-Case Diagrams are used for depicting requirements at various levels of detail.
Enterprize modeling is an organizational structure. It represents laws of the organi-zation which affect its operation, goals and tasks. Data models are used to understand, manipulate and manage the data produced by information systems. Entity Relationship diagrams are suitable for modeling huge data. Modeling functional requirements deals with preparing models for the existing and future system. Functional requirements is also used for comparing the new features the intended system would have and facilities it will provides etc. Non-functional requirements are difficult to model the whole system as they cannot be measured individually.
Once the requirements are specified they must be communicated among stake hold-ers. This should be done in a manner which facilitates easy reading, analyzing and validating the requirements. There is no standard structure for this process. Making different stake holders to agree on requirements is a tedious task as every stakeholder wants to fulfill their own requirements.
Setting priorities is a way to balance desired project scope against constraints of schedule, budget, staff and quality goals. This can be done by categorizing require-ments in three levels High level - these are requirerequire-ments which are both are urgent and important. Medium level - these requirements are important but not urgent. Low level - these requirements are neither important nor urgent. This prioritization can be done on the basis of value, cost and risk.
Ambiguous requirements can be identified by reviewing the requirements documents. Errors such as requirements conflicts and unrealistic requirements can be found out in reviewing the documents. As reviewing every document is tedious and time consuming checking critical document could save time. Written Requirements should be validated against actual requirements.
2.1.3
Requirements Documentation
In this section we discuss different requirements engineering notations. Entity Relation-ship Diagrams (ERD), Data Flow Diagrams (DFD), State Transition Diagrams (STD), Activity Diagrams, and Use-Case Diagrams are used for depicting requirements at var-ious levels of detail. Software Requirements Specifications and its attributes are also discussed.
Data Flow Diagram - DFD
DFD is used to understand the problem. It show how the system work. DFD is a method of representing how data is processed by a system in terms of inputs and outputs. DFD represents processes, data flow, external entities and data storage graphically see figure 2.2. Some basic DFD symbols and notations are mentioned below.
A process transforms incoming data flow into outgoing data flow. Data stores are the repositories of data in the system. Data flows are pipelines through which information flows. External entities are objects placed outside of the system, with which the system communicates. These are sources and destinations of the system’s inputs and outputs. A context diagram is a top level diagram. It is also known as Level 0 DFD. It contains one process node which generalizes the function of the entire system. From context diagram DFD is broken down into required low levels.
Figure 2.2: Data Flow Diagram
Entity Relationship Diagram - ERD
Entity Relationship Diagram is also used to understand the problem. It show how the system work by illustrating the logical structure of data. Entities represents the things about which the information is required. Attributes contains the data relating to the entities. Relationships provide the structure needed to draw information from multiple entities see figure 2.3.
Basic ER Diagram symbols and notations include.
Figure 2.3: Entity Relationship Diagram
An entity is an object about which you want to store information. A weak entity is dependent on another entity to exist. Attributes are the properties or characteristics of an entity. A key attribute is the unique,distinguishing characteristic of the entity. For example, person number is Sweden is a unique key attribute. A multi valued attribute can have more than one value. For example, an employee entity can have multiple skill values. A derived attribute is based on another attribute. For example, an employee’s monthly salary which is based on the employee’s annual salary. Relationship illustrate
2.1. Introduction 7
how two entities are related to each other. This is a type of relation which can be self-linked. For example, employees can supervise other employees.
Use Case Diagram
Basic objective of Use Case approach is to describe functions of the system that the users need to perform. Use Cases describes an external view of the system. They are services provided by the system to its users. They capture only functional requirements and cannot capture non functional requirements. Some basic Use Case Diagram symbols and notations include.
A rectangle represents system which has use cases. Actors are placed outside of the system’s boundaries. Ovals are used to represent use cases. These are labeled with verbs that represent the system’s functions. Actors are the users of a system. A simple lines illustrate relationships between an actor and a use case.
Formal Notation
Formal specification of requirements are based on mathematical notations. They are helpful in verifying incompleteness and correctness of the requirements. They also help to remove ambiguity of the requirements. Formal method basically focus on data and its function. If automated tools developed for formal specification than this method would be more useful.
Formal specification language has three components. Syntax specifies specific nota-tion used for representing data. Semantics are used to represent system requirements. Relations are rules used to indicate objects proper function [17].
State Transition Diagram
State diagrams show behavior of a system. They present states of an object [12]. These diagram are useful in describing the classes to understand the behavior of the object through the entire system. Rounded boxes are used to show objects which represents state of the objects. Arrows are used to show transitions in the next state. A super state of object is used to depict many transitions that lead to a certain state. It eliminate redundancy.
Interaction Diagram
Interaction diagrams describe how a group of objects interact in order to complete a particular task. These diagrams are used to model the behavior of many objects in a use case. The two kinds of interaction diagrams are sequence and collaboration dia-grams. Both sequence diagrams and collaboration diagrams can be used to demonstrate a scenario.
Sequence diagrams describe the objects and message they pass within a use case. They show sequence of events that occur. They are read in descending order from left to right.
Collaboration diagrams are used for demonstrating the relationship between objects and the order of messages that are passed between them. They show how objects are statically connected.
Icons are used to represent objects and messages are depicted by arrows. Sequence numbers are the numbers allotted to the messages. These numbers show the sequence order in which the messages are passed between the objects.
2.2
Requirements Management
Requirements Management is the process of managing changes to requirements. Changes are inevitable because of system errors and better understanding development of cus-tomers’ real needs. Requirements Management is carried out in parallel with other requirements activities in the software development. Activities of requirements manage-ment includes keeping project plan undated with requiremanage-ments, controlling requiremanage-ments versions, tracking status of requirements and tracing the requirements as depicted in fig-ure 2.4.
Figure 2.4: Requirements Management Activities (according to [28])
Every project is prone to changes during its development. Changes to requirements cannot be totally avoided but they can be managed. Changes can be due to addition of requirements. They can also be due to fixing of errors. Changes can be done to meet new requirements or missed requirements in initial drafts of requirements. Each proposed change should be evaluated on existing requirements and system design and implementation should be modified. There could be environment changes for example platform changes from Windows to Linux. Emergent changes due to customers new needs. Consequential changes which are due to previous changes. In order to maintain changes large database should be maintained. These changes should be tracked on requirements document.
One of the main task of requirements management is to track the current status of the project. Database should be maintained and updated daily about the current status. If database about changes to requirements is not maintained than developers might work on the changed requirements and resources can be wasted. How many requirements are covered and up to what level they are covered is known by status tracking. Stake holders will be interested in knowing the current status of the product.
2.3. Software Requirements Specification 9
Links should be maintained to changed requirements. Traceability determines how the requirements can be read, query and navigate in document. Requirements should be numbered dynamically. Database record identification and symbolic identification can also be used for numbering the requirements. Requirements traceability plays an important role in managing changes of requirements. Requirements must be traceable and traced to customers needs. These should also be traceable to work products like design and code.
2.3
Software Requirements Specification
The Requirements document or Software Requirements Specification describe external behavior of software system. This document can be written by user/customer or de-veloper. A well written requirements documents helps in meeting the desired goals of successful software within time limit. This requirement document can also have adverse effect on the software if not written with care. Errors that are found in the require-ments document are easy to fix, cost less and consume less time. If these docurequire-ments are handled properly errors can be reduced. Fixing requirements errors during the design, coding or implementation phase will be a tedious task.
There are two types of errors that can be found in requirements document. Knowl-edge errors, which are caused due to not knowing what the requirements are and Specifi-cation errors, caused due to lack of knowledge or experience of specifying requirements. A good requirements document has behavioral requirements and non-behavioral require-ments. Behavioral requirements specify what the system does including its inputs and outputs. Non-behavioral requirements includes complete description of efficiency, relia-bility, security, portability and maintainability.
A requirements document is considered good if it has following characteristics. Though requirement document can have many of the following characters it cannot have all of them. Though SRSs are inter-related and inter-dependent they can be grouped into following groups.
INTERNALattributes of requirements documents describe how requirements should be specified. What they should include and how they effect others attributes.
Unambiguous - A requirement document is unambiguous if and only if every re-quirement stated therein has only one interpretation. Natural language such as English has many inherent ambiguous words. Scott et al. [24] suggest to use deterministic Finite State Machine (FM), Pertinens , and Decisional Tree. Though they have less ambiguity inherent in them they are used for formal specification.
Correct- In order to be a requirements document correct each and every sentence or requirement mentioned in the document should be required by the system to be build. For example, the client specified that users should be permitted to enter password for 3 times if their early 2 trials were wrong. If the requirement document says that users should be permitted to enter password up to 5 times then it is not correct. Correct also refers to formulae for eg. 2+2=4 and if the result is other than 4 it is not correct.
Complete- A requirement document is said to be complete if it satisfies 4 conditions. 1. Everything the software is supposed to do must be included in the document [8]. 2. All pages are numbered, table and figures are numbered, named and referenced and all referenced material is present. 3. No ‘TB’ To Be Determined should be present in the document. 4. For every input of the system there must be some output.
Understandable- A requirement document should be understandable by all read-ers which include customread-ers, usread-ers, project managread-ers etc. This is hard to achieve as
Figure 2.5: Traced Vs Traceability (according to [17])
if the requirements document has technical terms then customers will not be able to understand. There could also be instance where customers or users use technical terms which are not understandable by the developers. In order to avoid ambiguity or to make requirements document more clear natural simple language can be used but requirements document will become lengthy.
Verifiable - A requirements document is verifiable if and only if there exist finite cost effective process with which a person or machine can check that the actual as built software product meets the requirements. If the requirements are ambiguous then requirements document will be non verifiable. For example, terms such as usually or often cannot be verified.
Internal Consistent- A requirements document is said to be internally consistent if no subset of requirements conflict with other requirements of a set. Conflicts can be of terms such as focus, drag and press etc. This can be avoided by maintaining cross-references between all requirements.
Traced - In order to be a requirements document traced the origin of each of its requirements should have references to earlier versions of the supportive documents see figure 2.5.
Traceable- A requirements document is said to be traceable if it has reference of every requirement stated [8]. This can be achieved by numbering every paragraphs and requirements uniquely. Traceability helps in locating the requirements.
Modifiable- A requirements document is said to be modifiable if changes are easy to made consistently. As the software building is prone to continuous changes modifying
2.3. Software Requirements Specification 11
the requirements documents is necessary. Improvements and removing errors are also important factors that lead to modification of the documents.
Annotated by Relative Importance- A requirements documents could be anno-tated by relative importance. It should be in ascending order of the importance which features are of most important to the customers. They can be marked as compulsory, recommended and optional [24] .
Annotated by Relative Stability- A requirements documents can be annotated by relative stability depending on the help by designers. Changes of requirements is the cause of the stability of the features like which can be prone to early changes or which features can stay for longer period.
Annotated by Version - A requirements documents is said to be annotated by version if the reader can determine which features can be implemented in which version of the software. This attribute can be application dependent.
Not Redundant- If the requirements document has same information stored in more than one place it is called redundant. Redundancy is on one side helpful for readability and on other hand it can create problems. When changes at done at one place and not done on the other places it lead to inconsistencies.
At right level of detail - A requirements document can provide different levels of details. It can be from very general to very specific. It should cover the minimum functions specified by the customer. For example, 1. System should accept payment. 2. System should accept cash payment. 3. System should accept previous bills with credit cards.
Precise- In order to be a requirements document precise it should not contain vague details. For example the system should not keep the user waiting for acknowledgment long is not precise instead it should have certain numbers like 2 minutes.
Organized- A requirements document is organized if its contents are made for easy navigation of information easy to users. Overmyer [24] suggests few methods to make the document organized. Group the functional requirements by user class. Group the functional requirements by objects. Group the functional requirements by features.
EXTERNAL attributes of requirements documents describe overall or outer ap-pearance of SRS.
Achievable- A requirements document is achievable if and only if there exists at least one system design and implementation that correctly implements all the require-ments stated in the document. This can be done by building prototypes of the system [24].
Electronically Stored- If a word processor is used for storing the requirements documents then it is electronically stored [24]. It can be generated from requirements database.
Concise- A requirements document is said to be concise if the length of the document is made short without effecting other qualities. For example There are two requirements documents which are written for the same software to be built. If 1 document is made of 25 pages and the other 30 pages. Then the first is obviously concise.
Design Independent - Requirements document should be design independent. This means if there are many ways to solve a problem then no single solution should be made compulsory. There should be only required features mentioned instead of imposing a design.
For example redundancy makes a requirements document ambiguous but allowing redundancy will be against other attribute non redundancy. In order to specify complete requirements if natural language is used then the document will become lengthy and
difficult to understand and keep focus. Hence a good requirements document is one which has as much qualities as mentioned above.
Reusable- A requirements document is said to be reusable when a part of it is used for the future requirements documents. This can help in reducing time. Reusability could be of general terms in non similar projects and could be specialized for similar projects. For example, requirements for payroll system can be reused of one project to other projects as most of the information is similar.
2.4
Summary
Requirements are the intended features of a system or functions it must perform. Along with functional requirements there are non functional requirements of a system like reliability, portability, efficiency etc. Requirements are taken care by a process called requirements engineering. Requirements engineering is the process of elicitation, vali-dation, communication and management of requirements. Change is inevitable during software development but it can be managed by requirements management. Require-ments management is an important phase of the software engineering. Errors detected during requirements phase are less expensive to fix than later stages of software devel-opment. Requirements can be managed by software requirements document. Although creating a perfect quality requirements document is impossible but it can be managed by including as many quality attributes as possible. Software Process Improvement is necessary to improve the software development processes as better processes results in higher quality and better productivity see Chapter 3 for details.
Chapter 3
Process Improvement
3.1
Introduction
This chapter introduce software process improvement approaches. An organization needs continuous improvement to its software process in order to remain competi-tive in the market. It should assess its functions and how it is achieving its goals. There are different ways of assessing the software improvement process starting from CMM/CMMI, GM, BOOTSTRAP, and ISO 9001 to SPICE/ISO/IEC. These models are used to achieve desired quality by the users. Objectives of software process im-provement, principles and improvement cycle are discussed and various approaches of improvement are mentioned.
Software companies use process improvement to achieve their objectives. Kotonya and Sommerville [17] mention 3 objectives of process improvement. One of the objectives of using process improvement models is to improve quality of the product. It can be achieved by reducing number of errors or fulfilling user needs in better way. Wieners [28] mention resource reduction is the main objective for using process improvement models. These models are used to reduce resources like developers, programmers and testers. To cut short schedule of the projects by learning from previous projects. Wieners [28] suggest the above objectives can be achieved by learning from past experiences and by correcting problems on earlier projects. By adopting good practices and by anticipating and preventing problems in future.
When planning process improvement the following questions must be answered. What are current process’s problems? There can be problems like poor quality prod-uct, more time consumption or budget over run. What are improvement goals? The goals of the organization must be achievable. Goals can be reduction of over work and budget over run. How can process improvement be introduced? First study the present process and slowly change a portion of that process to see the result and then gradually change the whole process. How should improvements be controlled and managed? By maintaining feedback regularly from the employees using the new process.
Wieners [28] discuss general principles of software improvement processes in which he focuses on the continuous cycle of improvement. Process improvement should be continuous and cyclical. Overall improvement should be the aim but start with a little improvement. Expecting overall change initially is not good as it takes more time to change. Goal orientation should be present in the improving process. Starting the improvement without knowing what to improve is total fail. Goal of improvement for
e.g. cost reduction must be known first before starting. Peoples can avoid making changes as making changes is a tough task. Employees may think that they have to learn new technologies, adapt new ways of work etc, if the changes are to be made. Build the need of change in employees.
3.2
Software Process Improvement Cycle
Improvement process of the software is a cyclical process which should be done contin-uously see figure 3.1.
Figure 3.1: The Software Process Improvement Cycle (according to [28])
First step in improving software process is to assess the current practice that is followed in the organization. Assess its strengths and weaknesses. Assessment can be done by using questionnaires, interview or team members or external consultants would also serve the purpose. Assessment leads to choice of improvements. Once the current practice is assessed write an action plan. Strategic plans focuses on overall software improvement. Tactical plan targets on particular area like gathering requirements from customers. New plan must be created and implemented. Employees should be given time until they become familiar with the new process. Activities should be recorded and results should be compared with the new process and the old one. There may be results which are clear and unclear in few areas.
Software process maturity models are used to capture understanding of a process. Process maturity models like CMM/CMMI, SPICE, GM, BOOTSTRAP and ISO 9001 are used to assess software process in an organization.
3.2.1
CMM/CMMI
Capability Maturity Model (CMM) was developed by Software Engineering Institute (SEI) a part of Carnegie Mellon University. CMM is a reference model of mature practices in a specified discipline. This model is used to approve and appraise a group’s
3.2. Software Process Improvement Cycle 15
capability to perform that discipline [2]. This model assess an organization´s goals and capabilities.
CMM has five predefined levels of process maturing and key process areas associated to each level as depicted in figure 3.2 [26]. The initial adhoc level is an immature process which leads to second level where software configuration management is handled. Peer reviews are done at defined third level and quality is managed at fourth which ultimately leads to optimized and mature software process. Requirements management is one of the key process areas in second level. This level also has other key process areas like commitment and ability of performance.
Figure 3.2: The CMM five levels of software process maturity with their key process areas (according to [26])
COMM - Capability Maturity Model Integration
Capability Maturity Model Integration (COMM) is a process improvement approach. COMM provide guidance for process improvement from specific division to entire or-ganization. It integrate different organizational functions. It also guide various quality processes and set improvement goals and priorities [18].
Figure 3.3: The BOOTSTRAP Methodology (according to [26])
COMM provides many benefits to the organization. It provides consistency in re-quirements development and management. It help in system design and development, risk management and measurement [2]. It enables process integration and product im-provement and help the organization to comply with relevant ISO standards.
3.2.2
BOOTSTRAP
The BOOTSTRAP approach is the equivalent of the CMM model of USA. It was ini-tially started for European Strategic Program for Research in Information Technology (ESPIRIT) project in Europe and later BOOTSTRAP Institute was established. It is complaint with ISO 9001 and suitable for all kinds and size of software development organizations.
The objectives of BOOTSTRAP approach is to identify strengths and weakness of different process used by the organizations. BOOTSTRAP support to evaluate process capability. It provides support to the recognized software engineering standards. It provide assurance of reliability. Thomsen [26] mention BOOTSTRAP approach has a software producing unit assessment (SPA)and many project assessments see figure 3.3. SPA assess processes of the organizations to know what is really done.
The BOOTSTRAP approach has a database supporting the organizations to com-pare its maturity level with other organizations. This database is also useful to assess an organization internally, for example to assess the employees. One of the main goal of BOOTSTRAP approach is to demonstrate the benefits of better utilization of good practice management in order to produce good quality products. BOOTSTRAP intro-duce the concept of Total Quality in software development through good practices in the organizations. It has adopted SEP based on ISO 9000 quality standards and European Space Agency’s (ESC) process mode. Hossein [23] state that BOOTSTRAP does not support an organization to self-assessment.
3.2. Software Process Improvement Cycle 17
Figure 3.4: The Goal Question Metrics Approach (according to [27])
3.2.3
GQM
The Goal Question Metrics Approach was originally used to define and evaluate goals for particular project in particular environment. Now GQM is used for quality improvement in many organizations. The GQM approach has three levels. Goals, Questions and Metrics see figure 3.4 [27].
Conceptual level - Goal of an object is defined. Here processes such as testing the software and avoiding budget over-run. In Operational level questions are asked about how the mentioned goals can be achieved. Questions help to characterize the product, process or resources qualities from different point of view. Third level is Quantitative level, Metric which is a set of data to measure the resultant product, process or resources. This helps in maintaining quality in the organization.
Example: An organization has problem of not completing the projects on time. Project Manager has a goal to complete the product on time. Questions can be raised about reasons behind not completing previous projects on time. Metrics can be devel-oped to overcome deficiencies identified in the operational level questions.
According to Basili [27] a goal has 3 coordinates. Issue, object and viewpoint. In the above example issue is timeliness. Object is product. When model is ready data collection methods are used for improving the overall process.
3.2.4
SPICE/ ISO/IEC15504
Software Process Improvement and Capability Determination (SPICE) was developed to fulfill rising need of an international software process assessment standard. SPICE is also known as ISO/IEC 15504. An international standard provide purchaser choice of software supplier after comparing them. This can be done only when there is a universal standard to compare different organizations. SPICE help organization to keep a watch on continuous process improvement. There are two uses of SPICE standard one is to assess capability and quality improvement of a process another is to determine purchasing quality intensive software system.
Figure 3.5: An overview of the ISO/IEC 15504 two dimensional architecture (according to [10])
ISO/IEC 15504 has two dimensional architecture as shown in figure 3.5 [10]. Di-mension one is capability scale to evaluate the capabilities of process and diDi-mension two deals with scale to evaluate the capabilities of process. There are five levels of capabili-ties which define how the organization works. During these levels process performance are checked.
3.2.5
The ISO 9001 Series
International Organization for Standards (ISO) was established in 1947 combining 149 national standards. It is a non-governmental organization. Presently it has 156 member countries. Its main features are equality among all member countries i.e. every member has a right to present their ideas. ISO standard is a voluntary to be adopted by the organizations. It never forces an organization to adopt any standard but as the standards are being developed according to the emerging market needs few standards became
3.3. Summary 19
defacto1 such as ISO 9001 and ISO 14000 [14]. ISO has global recognition which help
international business and trade.
ISO 9000 is most widely known standards in the world. It became international ref-erence for quality requirements in Business-to-Business dealing. It has world reputation as “Generic Management System Standard” [16]. Generic means this standard can be applied to any organization irrespective of the size and its products. Organization can be a government or private sector. It provide guidelines for managing the processes of an organization. Objectives of ISO 9000 include quality management. Meeting cus-tomers quality expectations. It also help to achieve continuous improvement. It is not a product standard [15]. It is concerned with process which meaning how to do. It does not consider what results are?
3.3
Summary
In order to survive in the market software producing organizations have to continuously improve their process. Process improvement cycle starts with assessing present pro-cess conditions. In order to assess present conditions different models are used. CMM, SPICE, ISO 9001 etc are few process improvement models. Depending on needs orga-nization can adopt to different approaches available. CM model is used mostly in USA whereas SPICE covers EU. Irrespective of the models organization adopts them to fulfill their ultimate goal - quality improvement. In order to check whether processes actually improved or not we need to measure them. software measurement is discussed in next chapter.
1A standard which is not an official standard but automatically followed by the people or
Chapter 4
Software Metrics
This chapter introduce software measurement. Software metrics deal with the measure-ment of the software product and process by which it is developed. Several objectives of software metrics are discussed. Different types of metrics such as size metrics, ob-ject oriented metrics, communication metrics and requirements metrics are discussed in detail.
4.1
Introduction
Mills [30] suggest Ideal metrics should be simple facilitating its evaluation. They should measure what they are intended to measure. They should also be objective, robust and easily obtainable.
“Asoftware metric is a measurement derived from a software product, process, or resource. Its purpose is to provide a quantitative assessment of the extent to which the product, process, or resource possesses certain attributes.”
According to Costers [6] software metrics are necessary in order to effectively manage software development. This can be done by accurate schedule, better quality products, good productivity and good cost estimates. The goals of software metrics are to identify and measure essential factors which effects software development. However, organiza-tions face certain hindrances for metrics such as ill defined metrics, misrepresentation of software life cycle, incompleteness of models, weakness of measurement atomization and lack of metric validation.
Metrics that are gathered from requirements phase include size metrics constituting functions, lines of code and complexity. Quality of requirements for example, can be measured as volatility - The degree to which requirements changes over period of time. Traceability can be from requirements to requirements and requirements to design or test documents. Consistency and Complexity can also be gathered from requirements phase.
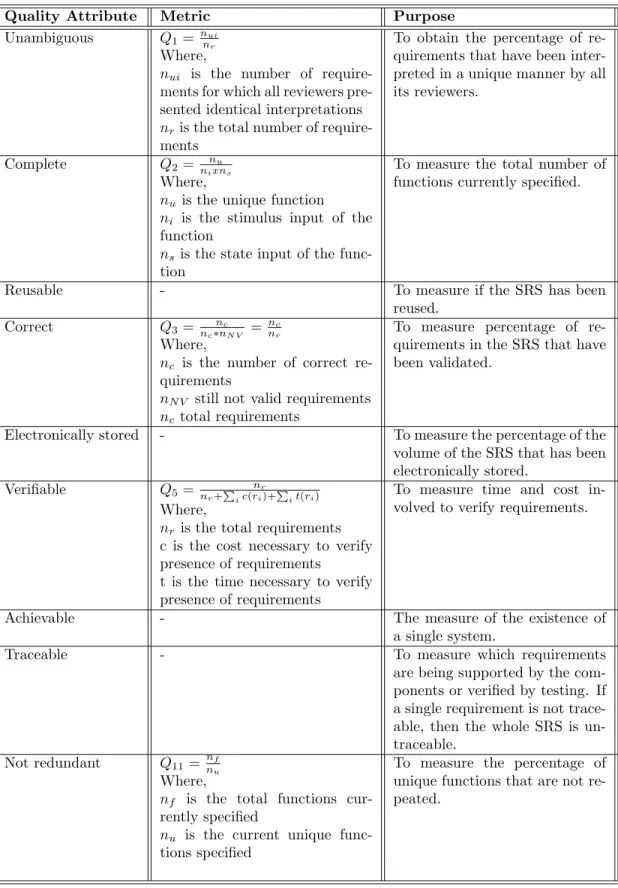
Quality attributes discussed in section 2.3. have formulae to measure them. Table 4.1 shows quality attributes and metrics to measure them.
Quality Attribute Metric Purpose
Unambiguous Q1= nnuir
Where,
nui is the number of require-ments for which all reviewers pre-sented identical interpretations
nris the total number of require-ments
To obtain the percentage of re-quirements that have been inter-preted in a unique manner by all its reviewers.
Complete Q2= ninxnus
Where,
nu is the unique function
ni is the stimulus input of the function
ns is the state input of the func-tion
To measure the total number of functions currently specified.
Reusable - To measure if the SRS has been reused.
Correct Q3= nc∗nncN V =
nc
nr
Where,
nc is the number of correct re-quirements
nN V still not valid requirements
nc total requirements
To measure percentage of re-quirements in the SRS that have been validated.
Electronically stored - To measure the percentage of the volume of the SRS that has been electronically stored.
Verifiable Q5= nr+Pic(rnir)+Pit(ri)
Where,
nr is the total requirements c is the cost necessary to verify presence of requirements
t is the time necessary to verify presence of requirements
To measure time and cost in-volved to verify requirements.
Achievable - The measure of the existence of a single system.
Traceable - To measure which requirements are being supported by the com-ponents or verified by testing. If a single requirement is not trace-able, then the whole SRS is un-traceable.
Not redundant Q11=
nf
nu
Where,
nf is the total functions cur-rently specified
nu is the current unique func-tions specified
To measure the percentage of unique functions that are not re-peated.
4.1. Introduction 23 Quality At-tribute Metric Purpose Internally consis-tent Q6= nu −nn nu Where,
nu is the number of unique func-tions specified
nn is the number of unique func-tions that are non deterministic
To measure the percentage of unique functions that are deter-ministic assuming that SRS can be defined as a function that maps inputs and states into out-puts.
Traced - Measuring the level of trace-ness is impossible, therefore none metric is presented. Design Indepen-dent Q10= D(RE ∪RI) D(RE)
REis the total requirements that describe pure external behavior
RI is the total requirements that directly address architecture or algorithms of the solution
To meet the percentage of pos-sible solution systems that are eliminated by adding the overly constraining requirements.
Modifiable - To measure if- it contains a table of context and index.
Concise Q9= size1+1
Where,
size is the number of pages
Determine if two systems SASS describe identical systems is un-decidable, therefore one way is to count page using the hyperbole function.
Annotated by Rela-tive Importance
- To calculate the percentage of requirements that are annotated by relative importance.
Annotated by Rela-tive Stability
- To calculate the percentage of requirements that are annotated by relative stability.
Annotated by Ver-sion
- To calculate the percentage of requirements annotated by ver-sion.
4.2
Objectives of Software Measurement
Measurement is needed for assessing the status of products, processes and resources. Ev-ery measurement activity must be in the way of achieving clearly defined goals. Modeler and Norman [11, 20] mention the following objectives of software measurements.
Understanding - Measurement help to understand what is happening during de-velopment and maintenance phases of software dede-velopment. Measurement should be done in order to derive models of processes and examine relationships among the process parameters. It leads to better understanding and improved software projects.
Q1= nnurr
Where,
nur is the number of understood requirements
nr total requirements
Early Problem Identification- Measurement, rather than waiting problem to oc-cur, allows early problem identification and rectification as software management strat-egy. If problems are detected earlier it saves resources of the organization.
Planning/Estimation- Better project planning and estimation. Amount of rework is a significant cause of failure for exceeding the estimated budget. As the number of defects increases the cost of fixing those errors also increases.
Quality- The number and frequency of problems and defects are inversely propor-tional to the software quality. This is one of the direct measurements of the software product.
Complete
Q2= ninxnus
Where,
nu is the unique function
ni is the stimulus input of the function
ns is the state input of the function
Correct
Q3=nc∗nncN V =
nc
nr
Where,
nc is the number of correct requirements
nN V still not valid requirements
nr total requirements
Schedule - The amount of workload, number of people and the way processes are used are initial factors that contribute to the preparation of schedule. Projects can be tracked on regular basis. Increased development team productivity, measurement allows to control what is happening on projects. Davis [8] claims if metrics are not applied early in the software development then the number of errors will increase during later stages.
4.3. Types of Metrics 25
Entity Attribute Measure
Completed project Duration Months from start to finish Completed project Duration Days from start to finish Program code Length No. of line of code (LOS) Program code Length No. of executable statements Integration testing
pro-cess
Duration Hours from start to finish
Integration testing pro-cess
Rate at which faults No. of faults found per BLOC(Thousand LOS
Tester Efficiency No. of faults found per BLOC (Thousand LOS)
Program code Quality No. of faults found per BLOC (Thousand LOS)
Program code Reliability Mean time to failure in CPU hours
Program code Reliability Rate of occurrence of failures in CPU hours
Table 4.2: Examples of direct measures used in software engineering (with permission from [11])
4.3
Types of Metrics
Different types of metrics are used to measure software. Metrics are categorized into products, process and resource metrics.
4.3.1
Product Metrics
Product metrics measure the software products at any stage of software development. They can be applied from requirements phase through installation. These metrics mea-sures size of the program. They measure number of pages of documents and complexity of software design. Primitive metrics or direct measurement of an attribute involves no other entity. It is independent of other entities. It can be LOC, duration of tests calculated in number of hours, months and number of defects discovered see table 4.2. Size of the software can be measured by its length, functionality and complexity. LOC is a common criteria used to measure length of the software. It is the physical size of the programs used to write code. There are different notations for writing the code. Code may have only executable statements, blank lines, comments and headers. In-dustry standard for measuring LOC is to count non-commented code. Programs have statement declarations, header statements and executable statements in which only ex-ecutable statements are counted as LOC and commented lines are ignored. Software Engineering Institute suggest to measure code by keeping in view of automatic code generators. SEI also suggest to consider differentiated physical lines of code from logical lines of code and reused or copied and modified code [22].
Object Oriented Metricsare helpful for the allocation of resources in software development. These metrics are particularly used to identify fault-prone classes and predicts maintenance efforts, error proneness, and error rate. Chicaner [5] discussed
Weighted Methods per Class - (WAC) This metric is used to measure the complexity of a class. This is computed as the sum of the complexity of each method of the class. In Depth of Inheritance Tree - (DID) number of the ancestors of the class are measured. Response for a Class - (REC) This metric measure the number of methods which are executed on objects of a class.
Bellini [7] categorize different groups of objects. Group 1 measure structures such as methods which measure complexity of objects, number of classes provide idea of over-all complexity, number of messages and global variables. Object Oriented metrics are mainly limited to the changes during the design and implementation phases of software development.
Communication MetricsCommunication with in a team is defined as intra-team communication while communication among members of different teams is known as inter-team communication. Communication artifacts for example electronic mail, weekly meetings, informal interactions, liaisons, personal e-mail, and informal interactions are available in entire project capturing information such as code, politics and process. This communication metrics give a good picture of software development process. These metrics measure the incidents of a specified type within a process. These are available in initial phases of software development and are easier to collect. As communication is done regularly during software development excommunication can result in costly defects later.
Design Metrics- Design metrics in contrast to traditional metrics does not rely on syntax or data structure. These metrics are computed from requirements or design documents before the system has been implemented. These metrics are calculated on the basis of codes functionality in problem domain. This calculate psychological complexity of module instead of number of paths through a piece of code [3]. As these metrics are independent of code structure they can be calculated from design specifications which allow an earlier sense of quality of software.
Semantic metrics includes Logical Relatedness of Methods - (LORD) the number of relations in a class divided by the number of pairs of methods in the class. Class Domain Complexity - (CDs) is the sum of concepts associated with a class with their associated conceptual relations. Class Overlap - (COB) is the sum of concepts in common between two classes. Stein [3] discuss relationships of output in design documents such as Co-incidental relationship - here two outputs are independent of each others, conditional relationship -two outputs are dependent on the same input and functional relationship - here module has only one output. Design metrics are useful means for improving the quality of software.
4.3.2
Process Metrics
Process metrics measure the process of software development. It includes the type of methodology used, experience level of human resources and overall development time. Overall development time of the software product is an objective metrics. If given as a task this should have same results from all the observers.
Computed metrics or indirect measurement is to make direct measurement interac-tion visible. These metrics are combinainterac-tion of metrics see table 4.3.
4.3. Types of Metrics 27
Category Formula
Programmer productivity LOS Produced/Persons months of ef-fort
Module defect density no. of defects/module size
Defect detection efficiency no. of defects detected/total no. of de-fects
Requirement stability no. of initial requirements/total no. of requirements
Test effectiveness ration no.of items covered/total no. of items System spoilage effort spent fixing faults/total project
effort
Table 4.3: Examples of common indirect measures used in software engineering (with permission from [11])
4.3.3
Requirements Metrics
Requirements engineering deals with elicitation, analysis, communication and validation of the requirements. As early as errors are identified it is easy to fix them compared to later identification of errors. It is obvious that the cost of fixing these errors in initial stages is lower than fixing them in later stages of software development. Many of these errors are caused due to changes in the requirements. In order to eliminate errors there should be some measurement. Metrics that can be gathered from requirements are the size of the requirements, requirements traceability, requirements completeness and requirements volatility.
Use Case/Size Metrics
Size is an important and general metrics used to measure requirements. LOS is com-mon metrics used to measure size of software. Comment lines and blank lines are not considered as code. A Non commented line is considered as a code but it also include executable commands, executable statements and data declarations. Use Cases can also be considered as a size measurements when they are used to describe requirements. For example number of use cases, number of functions covered etc.
The Use Case model is used to ensure that the right system is built. Use cases are at high level of abstraction. However they can capture only functional requirements of a system. Non functional requirements are not captured in use cases. Bullishness [1] discuss metrics for use case can be derived by counting number of actors according to weights. Number of use cased according to number of transactions that they perform and number of analysis classes used to implement each use case according to their complexity.
A cumulative sum, Unadjusted Use Case Points - UNC, is derived based on use case points - UP. UP are weights of the function points where effort is calculated by number of hours per person multiplied by UP. An Atomic action is action which cannot be further decomposed in to deeper level. An atomic action is used as a unit of measurement for use cases. Bellahsene [1] categorized use case metrics into 3 categories. Use case size metrics includes number of atomic actions in main flow. Number of atomic actions in alternative flow. Longest path between first and last atomic actions of use case and
number of alternative flows. Here, alternative flows are measured from start and end of use case. Size of use case can be determined by counting number of actors weighted by their complexity. Number of use cases weighted by number of transactions they contain and number of analysis classes used to implement each use case. Use case environment metrics are the factors which has influence on complexity level of the use cases. These are independent of the size of the use cases. These include number of stake holders, number of actors and total number of goals. Use case composite metrics are derived from size metrics and environment metrics. They include total number of atomic actions in the alternative flows. Total number of atomic actions in all flows. Number of atomic actions per actor. Number of atomic actions per goal and number of goals per stakeholder.
Requirements Traceability Metrics
Traceability is the ability to trace requirements in a specification to their origin from higher level to lower level requirements in a set of documented links. Traceability pro-vides information which help in determining whether all relationship and dependencies are addressed. This also make requirements leakage - existence of lower level require-ments with no valid origin from higher level visible. It help in preventing wrong in-terpretations of other metrics. There exist 5 types of traceability metrics. Next level coverage metrics - COB. This metric trace number of requirements to next level up and next level down. This also trace number of requirements in both directions.
Full depth and height coverage - DECO. This is similar to COB but it traces re-quirements to highest and lowest level of specifications instead of only immediate next level in both directions. This best suit for 3 or less level specifications.
Inconsistent traceability metrics - This include the numbers of requirements in a specification that have ablest one inconsistent link in both upward and downward direc-tions.
Undefined traceability metrics - It include the numbers of requirements in a specifi-cation that have no traceability links upward and download. However, the highest link will not have any upward link as it is derived from design document and the lowest level link has no down link.
Linkage statistic metric measure the complexity level of traceability data by count-ing the number of higher or lower level requirements to which each requirements is a specification is traced.
Requirements Completeness Metric
Requirements Completeness Metrics are used to assess whether a requirement is at wrong level of hierarchy or too complex. Requirements are considered as complete if all pages are numbered, all figures and tables have captions and numbers, all references are present, all sections and subsections are numbered and no ‘TB’ to be determine should be present see section 2.3 for details.
This metric quantify decomposition level of higher level requirements allocated to a specification. These are marked with ‘to be completed’ tag and the number of it in lower level specification. Requirements Completeness Metrics are of 3 types. Requirements Decomposition Metrics - This metric is used to know whether the requirements specified have been decomposed sufficiently to be used in next phase. A complex function will have many levels of specification and a simple function will have few levels.
Requirements Specification Development - This metric is used to provide information about the work completed and the work remaining for a given specification. This metric
4.4. Summary 29
is a solution to the question that queries have all the requirements in higher levels have sufficient low level specifications.
Requirements Specification Metrics - This metric provide information about the quantity of items for which issue resolution is needed. It also provide information about the unresolved issues affected by higher level of requirements. This metric used ‘to be determined’, ‘to be supplied’ tags used for completing the requirements document. This also trace number of high level requirements allocated to specification for incomplete requirements.
Requirements Volatility Metric
The degree to which requirements changes over a time period is called volatility of requirements. This metric is used to assess reasons for change of requirements over a period of time. Requirements degree of change is also checked by this metric. Both these factors are checked to know whether the changes are consistent with current development activities. It indicate changes such as addition, deletion and modifications. It help in tracing future requirements, design and code volatility. Volatility can be high in the initial phase of software development. It should be reduced as the project progress so that further development should not be affected. This metric is a good indication of other metrics for example, if a specific portion of a software is tested without knowing the volatility of the requirements than this testing would not be wrathful.
NASA has quality indicators such as imperatives for example, shall, is required to etc. Continuances for example, as follows, listed etc. Weak phrases such as as a minimum, easy. Options words such as can , may etc. see section 5.2.1 for details. These indicators are used in 4 metrics discussed earlier in chapter namely size, traceability, completeness and volatility.
4.4
Summary
This chapter started with objectives of software measurement. Better understanding, quality, early problem detection and estimation of schedule and resources are few objec-tives of measuring the software. Product metrics such as LOS, object oriented metrics, communication and design metrics are discussed in detail. Metrics used for checking the process and resources used to develop the software are mentioned. Requirements metrics checks the degree of change of requirements, volatility. Traceability, process of linking high level to low level requirements. Incompleteness in requirements docu-ments is also checked. Quality factors such as completeness, correctness, understanding etc. are discussed and their corresponding formulae are mentioned. These requirements metrics help in identifying and rectifying errors in requirements document. Measuring the requirements manually is time consuming and a complex task therefore automated tools should be used. In next chapter different automated tools and their functions are discussed.
Chapter 5
Requirements Tools
5.1
Introduction
Requirements metrics are useful in identifying risks of a project by identifying errors in requirements document. These metrics validate the written requirements against actual requirements. They evaluate whether the requirements are complete or not. There are many metrics used for measuring the requirements. Volatility metrics checks the changes of the requirements, traceability evaluates links between requirements to requirements within a document and requirements completeness metrics checks whether the requirements specified and complete or not. Single metric cannot ensure overall quality therefore multiple metrics should be used for measurement. Measuring the metrics manually is a tedious and time consuming task. Moreover it is not free from errors. Therefore automated requirements measurement tools should be used. Collection of metrics is faster and more reliable with the use of automated requirements tools. Requirements can be managed in a better way through these automated tools and consequently better requirements management leads to better product.
Automated Requirements Tool, Dynamic Object Oriented Requirements Systems, Requirements Use Case Tool and IBM Rational Rose are few automated requirements tools used for collecting, viewing, and changing requirements. These tools manage changes and provide traceability matrix. Use of automated tools enhance requirements management. Before using any requirements tool its function, uses and limitations must be understood.
Automated tools supports requirements management and trace requirements and asses testing of requirements. These tools help in reducing errors in software devel-opment. These tools are sophisticated and complex to use. EXTRA, PDF, RAMS, Function Point Workbench, COSMOS, MOOD, SQUAT, COMP, Bodycheck, QUALMS, COSMOS, LIRA Tested, STD-METRIC, Smallage Measure, Foundation Manager, Sunned Manager, SOFT-MESS and EXCEL are few tools used for measurement. These metric tools are used for product evaluation, process evaluation and resource evaluation.
Dumke [9] has classified software metrics Computer Assisted Software Measurement and Evaluation Tools - CAME into various categories such as. These tools assists in realizing software measurement processes. CAME tools for component classification: These tools are classified on the basis of components of product, process and resources. Main criteria in these metrics is the distance between components which is statistically evaluated. CAME tools for component measurement: Measurement task is done by
these tools which include code analysis tools, compilers and editors. CAME tools for evaluated software measurement: Dynamic testing of code, values and simulation are measured in this category of tools. Microsoft Excel is used for interpretation of the measurement values. CAME tools for the evaluation of the measurement method and methodology: These tools help in understand basic goals of the software measurements and the approaches adopted in order to achieve them. CAME tools for software process evaluation: Software process improvement models such as CM is used as a criteria in this category of metric tools.
5.2
Requirements Tools
There are many tools available for requirements engineering Calibers, Catalyze, Over-trade, DOORS and IBM Requisite Pro etc. Among those DOORS, IBM Requisite Pro and Requirements Use Case Tool are prominent and are discussed below.
5.2.1
Automated Requirements Measurement Tool - ARM
Automated Requirements Measurement tool is an early life cycle tool used for require-ments written in natural language. It was developed at the National Aeronautics and Space Administration - (NASA) Goddess Space Flight Center by Software Assurance Technology Center - (SATC). It measure quality of requirements documents/SRS. It help in writing the requirements in right manner. ARM tool basically fetch quality indi-cators from requirements documents and create three reports namely, summary report, imperative report and detail weak phrase report. It also provide details like number of occurrence of weak phrases, location etc.
NASA categorized quality indicators which can be easily found out using a computer program. These categories have two types of classes in relation to individual statements and in relation to total requirements documents [29].
Imperatives- are the words/phrases commands that something must be provided such as shall, must/must not, is required to, are applicable, responsible for, will and should.
Text Structure/Specification Depth - Requirements document organization is determined by text structure while specification depth determine number of imperative found at each text structure level. They report number of statement identified in hi-erarchical level. Each high level category is divided into many medium and low level categories.
Continuances - These are phrases which follow an imperative and refer to low level requirements. Traceability is done using these phrases such as below, as follows, following, listed, in particular and support.
Weak Phrases- These words can be interpreted in multiple ways. This list include adequate, as a minimum, as applicable, easy, as appropriate, be able to, be capable, but not limited to, capability of, capability to, effective, if practical, normal, provide for and timely.
Directives- figure, table, for example and note belong to the category of words/phrases which leads to illustrative information. These words indicate the complexity level of the requirements documents.
Options- can, may and optionally, these words provides certain degree of flexibility to developers. These words help in reducing the overall control of customer on the final product and allows changes in schedule, risk and cost.
![Figure 2.1: Requirements Engineering Process Coarse-Grain Activity Model (according to [17])](https://thumb-us.123doks.com/thumbv2/123dok_us/9054999.2394697/14.918.169.729.87.276/figure-requirements-engineering-process-coarse-grain-activity-according.webp)
![Figure 2.4: Requirements Management Activities (according to [28])](https://thumb-us.123doks.com/thumbv2/123dok_us/9054999.2394697/18.918.197.700.249.621/figure-requirements-management-activities-according-to.webp)
![Figure 2.5: Traced Vs Traceability (according to [17])](https://thumb-us.123doks.com/thumbv2/123dok_us/9054999.2394697/20.918.225.666.106.462/figure-traced-vs-traceability-according-to.webp)
![Figure 3.1: The Software Process Improvement Cycle (according to [28]) First step in improving software process is to assess the current practice that is followed in the organization](https://thumb-us.123doks.com/thumbv2/123dok_us/9054999.2394697/24.918.303.586.264.569/software-process-improvement-according-improving-software-practice-organization.webp)
![Figure 3.2: The CMM five levels of software process maturity with their key process areas (according to [26])](https://thumb-us.123doks.com/thumbv2/123dok_us/9054999.2394697/25.918.229.620.252.780/figure-levels-software-process-maturity-process-areas-according.webp)
![Figure 3.3: The BOOTSTRAP Methodology (according to [26])](https://thumb-us.123doks.com/thumbv2/123dok_us/9054999.2394697/26.918.228.668.98.316/figure-the-bootstrap-methodology-according-to.webp)
![Figure 3.4: The Goal Question Metrics Approach (according to [27])](https://thumb-us.123doks.com/thumbv2/123dok_us/9054999.2394697/27.918.234.656.91.343/figure-goal-question-metrics-approach-according.webp)
![Figure 3.5: An overview of the ISO/IEC 15504 two dimensional architecture (according to [10])](https://thumb-us.123doks.com/thumbv2/123dok_us/9054999.2394697/28.918.254.646.74.585/figure-overview-iso-iec-dimensional-architecture-according.webp)