ISSN: 2278-3369
International Journal of Advances in Management and Economics
Available online at: www.managementjournal.info
RESEARCH ARTICLE
Prosenjit Das et. al.| March.-April. 2017| Vol.6| Issue 2|52-70 52
Performance Evaluation of Indian Information
Technology-enabled Services (ITeS) Industry: An Application of Two-Stage
Data Envelopment Analysis
Prosenjit Das*
1, Arundhati Datta
21PhD Scholar, Department of Economics, University of Kalyani, West Bengal, India.
2Associate Professor, Department of Economics, University of Kalyani, West Bengal, India.
*Corresponding Author : Email: [email protected]
Abstract
This study aims to evaluate the performance of Indian ITeS industry during 2000-01 to 2014-15 by using a two-stage empirical method. In the first stage, performance is evaluated in terms of technical efficiency by using data envelopment analysis (DEA). In the second stage, the determinants of the technical efficiency score are assessed by using random-effects tobit model. For this purpose, data is collated from the Centre for Monitoring Indian Economy (CMIE) Prowess database. In DEA, overall, managerial and scale efficiency scores are evaluated. Pareto-Koopmans technical efficiency is evaluated to take care of the presence of non-radial input and/or output slacks. The DEA results reveal that managerial inefficiency is the major contributor to the overall technical inefficiency as compared to the inefficient scale of production. Moreover, the Indian ITeS industry is found to be dominated by the firms exhibiting decreasing returns to scale for most of the study period. The findings of the second-stage regression show that firm-size, Market concentration, net exports and profit rate have positive and statistically significant impact on efficiency. The empirical results also reveal that Public limited and non-group firms are more efficient than their private and group counterparts, respectively. Finally, the regression results indicate that 2008’s US sub-prime crisis has negative and statistically significant impact on the performance of Indian ITeS industry.
Keywords: Indian ITeS industry; Data envelopment analysis; Pareto-Koopmans technical efficiency; Input-specific Efficiency; Two-stage analysis; Random-effects Tobit model.
JEL Classification: C23, C61, L86
Introduction
According to the three-sector theory [1], the economy of a nation is divided into three broad sectors, viz. agriculture, manufacturing and services.
These sectors are also known as primary, secondary and tertiary sectors, respectively. This theory states that, over time, as a nation develops, the economic activity shifts from agriculture to manufacturing, and finally to the service sector. As a result, initially, the contribution of primary sector starts to fall and that of the secondary sector starts to rise, and finally the contribution of tertiary sector starts to increase along with
a fall in that of secondary sector. This is generally the path of transition of a country from the underdeveloped to the developing, and ultimately to the developed stage. But India’s development process has not fully supported the three-sector theory.
Prosenjit Das et. al.| March.-April. 2017| Vol.6| Issue 2|52-70 53 Bank. One of the major reasons behind the
dominance of the service sector is the emergence of IT and ITeS sector as a key exporter of services [2].
During this phase, IT and ITeS sector emerged as the major high growth service sector in India. Availability of cheap and skilled work force is one of the important factors behind the competitive advantage for the Indian IT and ITeS sector in the world export market of software and outsourcing services. For this reason, developed countries like US and EU are outsourcing IT and ITeS services to India. The post 1991’s reforms period also played a significant role in the expansion of the telecommunication sector, which, in turn, had given impetus to the IT and ITeS sector for its requisite expansion.
India’s exports of BPO services have experienced a significant increase since the year 2000, especially due to the Y2K problem. The Y2K problem turned out to be boon for India. Indian software professionals successfully handled the Y2K project, which, in turn increased outsourcing of the non-core IT activities by US and EU from India [3].
In this connection, it has been observed that the availability of English speaking cheap labour force is the primary source of India’s comparative cost advantage in BPO outsourcing. Along with this, sustained public investment in Indian education system through some of India’s premier institutes, such as Indian Institute of Technology (IITs), Indian Institute of Management (IIMs) and other technical colleges, innovation in software technology, difference in time-zone, etc. have been played a pivotal role in the growth of BPO sector in India. On the one hand, Indian BPO sector has been contributing a significant amount of foreign exchange in country’s foreign exchange reserve every year while on the other hand; ITeS firms have been providing direct as well as indirect employment opportunities to Indian youths [3].
It has been observed that during 2008’s sub-prime crisis in US, India’s BoP was largely supported by the IT-ITeS export earnings as the IT/ITeS exports were robust amidst the crisis situation.
There is a notable increase in competition in BPO sector with the advent of a number of countries, namely, Philippines, Mexico, China, Malaysia, and Canada. These countries have either advantage in English speaking and skilled workforce or good telecom infrastructure or both. Consequently, these countries are emerging as strong competitors for India. Although India enjoys the leading position in the BPO industry till now, it requires a continual improvisation in technology and linguistic capabilities to maintain its global position intact.
Over the last decade, offshore outsourcing of ITeS services has emerged as one of the most rapidly rising elements of worldwide commerce in services. BPO firms are outsourcing a wide range of activities, such as after sales services, research and development, etc. It is already a well-established fact that the comparative cost advantage is the main reason of outsourcing. But outsourcing is also associated with risks.
These risks sometimes bring failures and it becomes imperative for the BPO firms to reversing their outsourcing model. On the other hand, consequences of outsourcing are manifold. For instance, it can affect operational efficiency of BPO firms, quality of service/ product, wage structure of workers etc. In the last two decades, BPO sector has become an integral part of the Indian service sector. IT and ITeS sectors have been the most discussed sectors of the service sector in recent times.
Although Indian IT-ITeS industry has been resilient to the US sub-prime crisis, lately, this sector is facing many challenges, both internal and external. For instance, exchange rate volatility is an unavoidable external challenge as this sector’s large portion of yearly revenue comes from exports.
Prosenjit Das et. al.| March.-April. 2017| Vol.6| Issue 2|52-70 54 Against this backdrop, the present study
tries to contribute to the existing literature pertaining to the performance analysis of the Indian ITeS sector in a number of ways. First, we incorporate data envelopment analysis to estimate efficiency scores of ITeS firms, which is essentially a non-parametric method that does not require a priori parametric specification of production function unlike the stochastic frontier analysis. Second, we employ a measure of efficiency, namely, Pareto-Koopmans efficiency, which is non-radial non-oriented in nature that takes care of the presence of input and output slacks unlike other radial DEA measures of efficiency.
On the other hand, the Pareto-Koopmans efficiency score can be decomposed into output-oriented and input-oriented components. Finally, we employ random effects tobit model to investigate the determinants of efficiency instead of a pooled tobit model as the former would be more appropriate to capture the essence of individual (here, firm)-specific heterogeneity present in a panel dataset.
In view of the above discussion, the objective of the present study is to investigate the following:
The trend of technical efficiency of the Indian ITeS industry over the study period
Measurement of managerial and scale efficiencies
Decomposition of Pareto-Koopmans efficiency into input- and output-specific components
The impact of environmental variables, which are not under control of the individual firms, on the Pareto-Koopmans (PK) efficiency.
To realize the above objectives, firm level data has been collected from CMIE prowess database for the years 20001 to 2014.The present paper confines the performance analysis to Indian ITeS industry only, which essentially includes BPO and other IT enabled services. The reason for choosing Indian ITeS industry is twofold: 1) we have
1CMIE Prowess provides data for Financial Year (FY) rather than the calendar year. In this paper, any data for the year 2000 would actually indicate the data for the FY 2000, i.e., from April 2000 to March 2001. The same will be applicable for the consecutive years.
not found any study so far that exclusively investigate the performance of this industry and 2) the sustainability of performance of this industry needs to be examined with respect to the ownership-type, competitiveness in the domestic market, vulnerabilities to the world market etc. We found few literature that assessed performance of either IT industry or both IT and ITeS industry taken together. Since the output and production process of these two industries are not similar, the performance of ITeS industry needs to be investigated separately.
This paper is organized as follows. Section-2 provides a brief discussion on the composition of Indian ITeS industry.
Section-3 presents selective summary of
previous literature. Section-4 discusses the methodological aspects. Section-5 describes data. Section-6 contains results and discussions, and finally; Section-7 presents summary and concluding remarks.
Composition of Indian ITeS industry
The Indian ITeS sector comprises of Call Centers, Business Process Outsourcing (BPO), Medical Transcription (MT), Knowledge Process Outsourcing (KPO), Legal Process Outsourcing (LPO) and other IT-enabled services (viz. data entry, document processing etc.).
Whereas an IT firm mainly dedicated to the development and maintenance of software applications, an ITeS firm provides various back office services to its clients by using software and computer applications. Hence, an ITeS firm involves in outsourcing of low-end IT-enables services to a third-party service provider and not directly associated with the production of high-end products such as software applications. Moreover, the ITeS sector is more labour intensive than their IT counterpart [4].
A call center is a centralized facility where telephone calls from customers are handled by an organization with the help of some
computer automation and
Prosenjit Das et. al.| March.-April. 2017| Vol.6| Issue 2|52-70 55 handle inbound2 and/or outbound3 calls. A
typical BPO firm performs back office outsourced4 jobs of other organizations. The aforementioned activities, viz. call center, MT, KPO, LPO etc. are all different variants of BPO5. A Medical transcription6 firm’s job is to manually process the medical history/reports of patients dictated by physician and other healthcare professionals into a digital text format. This digital information then helps physicians to diagnose other patient with similar kind a medical history. Moreover, this standardization of medical information would helps researchers to carry out further research.
The main activities of a KPO firm includes various research and information assembling activities; such as business and market research, domain-based processes, consultancy, R&D in pharmaceuticals, equity research, assessment of intellectual property for patent applications, etc. Generally, a KPO firm requires more skilled and specialized personnel as compared to its other BPO counterparts.
A LPO firm primarily associated with the outsourcing activity of legal support services. For example, legal document review, patent services, legal research, drafting legal briefs, etc. are few activities of a LPO firm.
A Brief Review of Literature
2Inbound calls are mostly associated with ordering, help, information enquiries, and complaints about products from customers.
3 Outbound calls are related to sales promotion,
telemarketing, market research, debt collection etc.
4 There are mainly three types of outsource activities prevail
in the ITeS sector, viz. offshoring, nearshoring and onshoring. Offshoring occurs when the BPO contracted for outsourcing situated outside the firm’s own country. Nearshoring happens when the contracted BPO is a nearby country. Finally, onshoring occurs when the contacted BPO located within the firm’s own country.
5 Basically, the organizations of developed countries (viz.
USA, UK) outsource their non-core activities, such as payroll, human resources, accounting, call center activities, data transcription etc. to low-cost destination nations, for instance, India. BPO is a generic name of all ITeS firms such as call center, MT, KPO, and LPO etc.
6 A typical medical transcriptionist, who has a comprehensive
understanding of medical vocabulary, treatment and procedures, usually prepare a typed document of medical records of a patient with the help of computer applications and then forward to the dictation of the same (viz. physician) for review. The content of the transcription could be any of the following: operative reports, diagnostic tests and admission summaries, consultations etc.
The present study intends to measure the technical efficiency of Indian Information Technology-enabled Service (ITeS) firms during the financial year 2000 to 2014. Although there are plenty of research papers on Indian ITeS industry, however, studies on its performance is scant. We have found some relevant studies on efficiency evaluation of Information Technology (IT)/ software firms. We are summarizing those studies below.
Mathur[5]evaluated technical efficiency of 92 Indian software firms by applying input-oriented DEA model. In this study, sales and net exports are considered as output variables and number of employees, total costs and years in business are taken as input variables. The data was collected from CMIE Prowess database for the financial year 2005-06. The efficiency analysis reveals that out of 92 software firms, 16 firms are efficient (i.e., having efficiency scores equal to one).
In the second stage, Tobit model was applied to analyze the determinants of efficiency scores (calculated from the first stage) by using maximum likelihood estimator (MLE). The second stage regression analysis reveals that net exports and firm size have positive and statistically significant impact on technical efficiency whereas total cost has negative and statistically significant impact on technical efficiency. The study considers sales as proxy for firm size. Years in business and number of employees have no statistically significant impact on technical efficiency.
Bhattacharjee[4] examined the efficiency dynamics and sustainability of Kolkata’s Software Technology Park (STP) based IT-ITeS firms. The study was conducted over the period of 15 years (FY 1993 to FY 2007). The data was collected from the STP, Kolkata. This study employs output-oriented DEA model under VRS technology to measure the technical efficiency of IT-ITeS firms.
Prosenjit Das et. al.| March.-April. 2017| Vol.6| Issue 2|52-70 56 is also revealed that software firms are more
efficient on an average as compared to the ITeS firms. To investigate the determinants of efficiency in the second stage, OLS regression method has employed. Technical efficiency scores are considered as the dependent variable and net foreign exchange earnings and the share of other foreign exchange outflow in total cost are considered as independent variables. The share of other foreign exchange outflow in total cost has taken as proxy for the international orientation of the firm. Both the independent variables are found to be positive and statistically significant at 1% level of significance. On the other hand, the study concludes that higher the net foreign exchange earnings (or the higher the global orientation in terms of higher export), the higher the technical efficiency.
Chen et al. [6] employed DEA method to evaluate the managerial, technical and scale efficiencies for 73 listed Chinese Information Technology (IT) companies during the period of 2005 to 2007. They also used Malmquist Productivity Index (MPI) to measure Total Factor Productivity (TFP) and its sources in the IT companies. To measure efficiency scores, intangible assets, fixed assets, number of employees and operating costs are considered as input variables and net profit, annual sales and are taken as output variables.
The results show that on an average, the Chinese IT sector is 6.8 percent technically inefficient and 5.1 percent managerially inefficient during the study period. The MPI analysis reveals no significant improvement in TFP during the study period. Finally, the efficiency convergence analysis indicates an occurrence of substantial technical diffusion along with a fall in the technical convergence from 2005 to 2007. The study suggests that the IT companies should invest in R&D activities and improve intellectual capital for attaining competitive advantages and enhancement of performance.
Sahoo[7] estimated technical efficiency of Indian IT sector and the contribution of this sector to the economic development of the nation. To evaluate efficiency, this paper applies DEA technique. Firm level data had been collected from CMIE prowess database.
The paper considers sales as output variable, and expenditure of computers and electronic equipments, power, fuel and water charges, employment, and operating expenditure as input variables. Overall technical efficiency (OTE), pure technical efficiency (PTE) and scale efficiency (SE) are estimated at the firm level using DEA. The study reveals that the average scale efficiency of Indian software companies has been decreasing over the years during the study period. The second-stage regression analysis shows that the overall technical efficiency of the private Indian IT companies is better than their foreign counterparts and group-owned companies.
Methodology
First-Stage Data Envelopment Analysis (DEA)
In the literature of measuring technical efficiency, one of the prominent and widely used techniques is DEA. DEA is a non-parametric, deterministic mathematical programming technique and it evaluates efficiency of a DMU7 with respect to the ‘best-practice’ production frontier. Basically, this technique evaluates relative efficiency scores with respect to the efficient DMUs. In this study, DMUs are the ITeS firms. The advantage of DEA over other techniques is that it does not require any functional specification of the production function.
Moreover, this method can evaluate efficiency score under multi input-multi output environment. The DEA technique was came into existence since the seminal paper published by Farrell [8].
His model was based on one output multi input framework and constant returns to scale (CRS) technology. Charnes et al. [9] elaborately explained the DEA technique mathematically by using linear programming model (popularly known as CCR model) under CRS technology. Since the introduction of CCR model, DEA was started gaining popularity among the researchers of technical efficiency. The CCR efficiency score is also known as the overall technical efficiency. Banker et al. [10] introduced a DEA model under the
7 In DEA literature, a Decision Making Unit (DMU) is
Prosenjit Das et. al.| March.-April. 2017| Vol.6| Issue 2|52-70 57 assumption of variable returns to scale
(VRS) technology by incorporating a convexity condition into the CCR liner programming model. This is known as BCC model. BCC efficiency score is known as pure technical efficiency or managerial efficiency. Since the inception of these two DEA models, namely, CCR and BCC, a significant number of empirical researches in various fields, like non-profit public organizations, banking sector, hospitals, airports, and various industries have been taken place.
There are broadly two types of orientation of radial measures of technical efficiency (TE), namely, input-and output-orientations. The input-oriented TE is associated with proportionate reduction of all inputs given the output bundle. On the other hand, the output-oriented TE considers proportionate expansion of all outputs given the input bundle. These two measures of TE can be given as under:
Input-oriented TE8 =
Output-oriented TE =
The BCC measure of TE, also known as pure TE (PTE), considers the managerial efficiency only. On the other hand, the CCR measure of TE, also known as overall TE (OTE), takes care of managerial efficiency as well as the scale efficiency. The CCR measure of TE can be decomposed as follows:
OTE = PTE * SE …………(1)
Hence, the scale efficiency (SE) can be defined as the ratio of OTE and PTE.
i.e., SE = 0 < SE ≤ 1
Whereas the managerial efficiency (or PTE) is associated with the performance of a DMU’s management in transforming inputs into outputs, the measure of scale efficiency
8When minimum possible input and actual input are equal, the input-oriented TE score will be one, which implies the DMU under evaluation is fully efficient. If minimum possible input is less than the actual input, the DMU will be inefficient. In the context of output-oriented TE, a firm is said to be fully efficient if maximum possible output and actual output are equal. If actual output is less than the maximum possible output, the DMU under consideration will be called inefficient.
indicates whether the DMU operates at optimal scale or not. In this context, the SE score would be equal to 1 if the DMU under evaluation operates at the most productive scale size (MPSS); otherwise SE would be less than 1. Moreover, it can be said that the SE will be equal to 1 only when the technology of the DMU exhibits CRS. For any non-CRS technology, the SE would be less that one, which means the associated DMU, would be scale inefficient. When a DMU operates at MPSS, SE = 1, which further implies OTE = PTE. In this case, both CCR and BCC scores are equal to one and the DMU will be called efficient. The above discussion can be explained in the following graphical illustration (Figure 1).
Source: Authors’ construction
Figure-1depicts CCR and BCC production frontiers under one input-one output case. The line OF represents the CCR-efficient9 frontier10 (under CRS technology) and the line segment ABCDE represents the BCC-efficient frontier (under VRS technology). Any DMU on the OF frontier would exhibit MPSS. On the other hand, the scale efficiency score of a DMU on the OF frontier would be one. Moreover, the OTE score of a DMU will always be equal to one on the OF frontier, which implies the DMU is globally11 efficient. Now, we analyze the TE of DMU H. It can be clearly understood that DMU H is inefficient on the basis of both CCR and BCC frontiers. For instance, the input-oriented
9A DMU is called ‘CCR –efficient’ if the CCR efficiency score
is equal to one and it is called ‘BCC-efficient’ if the BCC efficiency score is equal to one. The CCR-efficient frontier is also known as CRS-efficient frontier and the BCC-efficient frontier is known as VRS-efficient frontier.
10 The CCR-efficient and BCC-efficient frontiers are also
known as free-disposal conical hull and free-disposal convex hull, respectively.
11 In DEA literature, a CCR-efficient DMU is known as
Prosenjit Das et. al.| March.-April. 2017| Vol.6| Issue 2|52-70 58 CCR efficiency for DMU H would be OJ/OQ,
which is clearly less than one (since OJ<OQ). On the other hand, the output-oriented CCR efficiency for DMU H would be OP/OM, which is also less than one (since OP<OM). In the similar manner, the input- and output-oriented BCC efficiencies for DMU H can be defined as OI/OQ and OP/ON, respectively. It is clearly revealed from figure 1 that the BCC efficiencies under both the orientations are less than one, which implies that the DMU H is also BCC inefficient. From figure 1, the input- and output-oriented scale efficiency measures for DMU H can be defined as follows:
Input-oriented scale efficiency = =
Output-oriented scale efficiency = =
In both the cases, the SE is less than one for DMU H, which implies the DMU is scale inefficient. On the other hand, DMU H’s scale of operation is not optimal. For DMU C, OTE and PTE are equal, which implies DMU C is having MPSS (i.e., SE = 1).
All the DMUs on and below the VRS-frontier are scale inefficient except DMU C. Furthermore, except DMU C, all DMUs on or below the line segment ABCDE either exhibit Increasing Returns to Scale (IRS) or Decreasing Returns to Scale (DRS) technology. In this context, it is noted that all the DMUs on the CRS-frontier are scale efficient (i.e., MPSS).
Although the CCR and BCC models have gained popularity in the empirical studies of evaluating technical efficiency, these models suffer from some limitations. Since both these CCR and BCC models are associated with radial (or proportional) measure of efficiency, one of the main limitations is the non-consideration of non-radial output and input slacks.
Moreover, CCR model considers only the pure technical efficiency and does not consider the presence of input-output slacks. To overcome this problem, this study also considers a Pareto-Koopmans measure of non-radial (non-oriented) model to evaluate efficiency scores of ITeS firms. Along with the no-radial efficiency score, the present study also evaluates efficiency scores on the
basis of output-oriented CCR and BCC models for more comprehensive analysis. It is mentioned that the technical efficiency score lies between 0 and 1 for all those three models.
Now, we are going to describe the assumptions and technical specifications of the DEA models discussed above. In DEA, the benchmark technology is created from observed input-output bundles of the DMUs presents in the sample. DEA does not require any a priori specification on the functional form of the production function. There are some generic assumptions regarding the technology given as under:
All observed input-output combinations (x, y) are feasible. We consider there are N numbers of DMUs, which are producing m outputs from n inputs. For DMU ‘j’, the observed input bundle is: xj = (x1j,x2j,…,xnj) and the output bundle is: yt = (y1j, y2j,…, ymj).
The production possibility set is convex.
All inputs and outputs are freely disposable.
Each DMU has at least one positive input and one positive output value.
For CCR model, the production technology exhibits constant returns to scale (CRS) globally, i.e.
If the input-output bundle (x, y) is feasible, then for any k≥0, (kx, ky) is also feasible.
On the basis of these assumptions, the production possibility set (S) under CRS can be defined as
S = {(x, y): x ≥ λjxj, y ≤ λjyj; λj≥ 0, (j = 1, 2…. ,N)}
Under CRS assumption, the production possibility set is constituted by the conical hull. The output-oriented CCR LPP model for DMU ‘t’ can be stated as follows:
Max θ Subject to,
Prosenjit Das et. al.| March.-April. 2017| Vol.6| Issue 2|52-70 59 The optimal solution of the CCR model may
be presented as (θ*; .
The resulting output-oriented technical efficiency score of DMU ‘t’ under CCR model may be denoted as
The BCC-DEA model can be constructed by inserting an additional constraint in the above CCR-DEA linear programming problem. This additional constraint is also known as the convexity restriction, viz. =1, which captures the essence of variable returns to scale (VRS) technology. Under the BCC model, the production possibility set I constituted by a convex hull. The output-oriented BCC model for DMU ‘t’ can be stated as follows:
Max φ Subject to,
r = 1, 2, … m; i = 1, 2, … n; =1
φ free; λj ≥ 0 j = 1, 2, … N
The optimal solution of the BCC model can be represented as (φ*; . The resulting output-oriented technical efficiency score of DMU ‘t’ under BCC model may be denoted as
In the CCR model, if θ*=1, then the DMU under evaluation is called efficient. On the other hand, if θ*>1, the DMU under evaluation is said to be inefficient. The same explanation is applicable for the BCC model.
Both the CCR and BCC output-oriented models are the measures of radial efficiency. It means these models only consider proportional increase in output given the inputs. But in reality, there exists input/output slacks, which are not being captured by the conventional radial models (viz. BCC and CCR models).
The reason behind the existence of slacks in any radial DEA model is the expansion of all output or reduction of all inputs by equal
proportion. In this context, it is to mention that the notion of technical efficiency is closely associated with the concept of Pareto optimality [11].
An input-output combination is said to be Pareto-Koopmans efficient if and only if (1) it is not feasible to increase at least one output without raising any input and/or decreasing any other output; and (2) it is not feasible to decrease at least one input without reducing any output and/or raising any other input. It is clear from this discussion that radial projection of an observed input-output bundle under CCR and BCC models does not satisfy the condition of Pareto optimality.
On the other hand, it implies that In case of CCR and BCC models, there would exist input and/or output slacks at the optimal solution. To overcome this shortcoming of CCR and BCC models, we introduce a non-radial Pareto-Koopmans measure of technical efficiency proposed by Pastor et al. [12]. This non-radial measure provides a non-oriented efficiency score unlike radial measures which is either input or output-oriented [13]. Since this model has no orientation, it incorporates possible increase in output as well as viable reduction in inputs. The corresponding LP problem for DMU ‘t’ can be given as under:
Min Γ = Subject to,
r = 1, 2… m; i = 1, 2…n; r = 1, 2… m; i = 1, 2… n; j = 1, 2… N
Where, θ = (θ1, θ2, …,θn) and φ = (φ1, φ2, …, φm).
Prosenjit Das et. al.| March.-April. 2017| Vol.6| Issue 2|52-70 60 Where, is the input-specific
component and ) is the
output-specific component of efficiency. Like the radial models discussed above, the PK-efficiency score also lies between the interval (0, 1].
The novelty of the DEA technique is that it does not require any a-priori information about the input and outputs prices. It computes the shadow prices of inputs and outputs endogenously. On the other hand, all the three DEA models considered here are unit invariant. That means there is no need to deflate the output and input variables for mitigating the impact of change in price level.
Second-Stage Random-Effects Tobit Regression Analysis
When the values of dependent variable lie in the interval (0, 1], the application of ordinary least square (OLS) generates biased and inconsistent estimates of parameters [14]. As the DEA-efficiency scores are censored between 0 and 1, a limited dependent variable model would provide unbiased and consistent estimates of the regression parameters. Most of the two-stage DEA studies generally apply either Logit or Tobit model for the second-stage regression analysis [15,16,17,18].
In this paper, following Selim et al. [19], Merkert et al. [20], Zeng et al. [21],Susiluoto [22] and Das [23], we employed random effects Tobit model for second-stage regression analysis instead of a pooled Tobit model to capture firm-specific heterogeneity present in panel dataset. The random effects Tobit model can be formulated as under:
yit* = β′xit + uiti = 1, 2,…, N t = 1, 2,…, Ti
uit = vi + εit vi ~ IID(0, ) and εit ~ IID(0, )
yit =
Where, IID implies independently and identically distributed; yit denotes the PK-efficiency score, yit* denotes the latent or unobserved variable, ‘β’ denotes the vector of unknown regression parameters, xi denotes the vector of regressors. uit is an composite
error term that consists of two elements, namely, vi and εit. vi captures the time-invariant individual random effects; and εit is the time-varying idiosyncratic random error component [24].
The underlying assumptions are
The idiosyncratic error term εit is serially uncorrelated;
The individual random effects viare uncorrelated across individual (here, firm).
Data
Data Description for DEA
The study is based on secondary data. Data extracted from CMIE Prowess online database on ITeS firms for the period 2000 to 2014. Sales12 is chosen as output variable, whereas net fixed assets, wages and salaries, and other operating expenses are chosen as input variables for conducting efficiency analysis. For the second stage regression analysis, we have considered various control variables which are discussed in the next section.
Output Variable: Sales
It has been observed that efficiency studies usually consider either sales revenue or the gross value added (GVA) as output variable, along with other output variables, such as profits, exports etc. According to Dogramaci et al. [25], the existence of intermediate inputs is not very significant for software and related industries. Empirical studies pertaining to the assessment of technical efficiency of Indian IT industry using DEA are found to be considered sales as one of the output variable [4, 5, 26, 27]. Since, one of the prime objective of the present study is to examine how ITeS firms efficiently produces their output given the inputs, sale would be the most appropriate output variable. Input Variables
Salaries and Wages
The use of salaries and wages as one of the input variable is consistent with prior studies of this genre [28-30]. Wages and salaries data consists of total annual expenses incurred by an ITeS firm on all employees.
12In this paper, all the input and output variables are
Prosenjit Das et. al.| March.-April. 2017| Vol.6| Issue 2|52-70 61
Net Fixed Assets
A significant number of studies [31-34] consider gross fixed assets or net fixed assets as an input variable in evaluation of technical efficiency of various industries by using DEA. The consideration of gross fixed assets as an input can be problematic as it does not consider depreciation of fixed assets. On the other hand, net fixed assets of a company comprises of the all the fixed assets such as land, buildings, equipment, machinery, etc. less the accumulated
Depreciation. Hence, NFA takes care of the
presence of depreciation of the fixed assets. For an ITeS/ BPO firm, a net fixed asset mainly comprises of the costs of installation and maintenance of servers, desktop terminals, networking apparatuses, VSAT terminals etc. Therefore, net fixed assets seem to be more accurate approximation for capital input instead of the gross fixed assets.
Operating Expenses
Finally, we have taken operating expenses as another input variable for the estimation of relative efficiency scores. Operating expenses of a firm includes day to day expenses like wages and salaries of its employees, research and development (R&D) expenses, inventory cost, insurance and marketing costs etc.
Operating expenses is considered as one the important input variable in the production process [6, 27, 35]. Since wages and salaries is already included in our efficiency analysis as an input variable, we subtract wages and salaries from the operating expenses and the resulting variable is considered as an input variable in our DEA models. This input variable captures costs of core operations incurred by a firm on a daily basis. This is the cost that managers always desire to minimize without compromising the quality of its output.
Variable Measurement for Second Stage Regression
In the second stage regression analysis, the efficiency scores obtained from the first stage DEA analysis are regressed on various external environmental variables such as experience in business, size, managerial quality, market concentration, profit rate, returns to scale, effect of US subprime crisis, net export, group dummy and ownership
dummy. A brief description of independent variables is given below.
‘Size’ variable is measured as the natural logarithm of the sale. We have converted the nominal values of sale into real values by using GDP deflator prior to its logarithmic transformation. ‘Experience in business’ is measured as natural logarithm of years in business. ‘Managerial quality’ is constructed as the ratio of operating expenses to total assets. Management of a firm always aims to improve sales without increasing the operating expenses or at least proportionately [36].
It is worthwhile to mention that the managerial quality and the ratio of operating expenses to total assets are inversely related. Therefore, it can be stated that as the ratio of operating expenses to total assets rises, the managerial quality decreases and vice versa. If management is able to do that over time, then it will said to be competent.
It is generally believed that there is a positive relationship between technical efficiency and managerial quality. In this study, we would like to examine whether there exist any significant relationship between technical efficiency and managerial quality of ITeS companies.
Market concentration is evaluated on the basis of Herfindahl-Hirschman index (HHI). ‘Profitability’ variable is measured as the ratio of profit to sales.
‘Net export’ is measured as the ration of net export to sales. ‘Return to scale’ dummies are incorporated to examine which ITeS firms are more efficient among IRS, CRS and DRS technologies. To examine the impact of US subprime crisis, we use time dummy variable. Ownership dummy is introduced to check the dynamics of efficiency between public13 and private limited ITeS. Finally, to examine whether the group14 or non-group firms are more efficient, we have considered the group dummy variable.
13Public limited firms are those firms which are listed in the
stock market, whereas the private limited firms are not listed in the stock market.
14A group firm is a subsidiary firm of
Prosenjit Das et. al.| March.-April. 2017| Vol.6| Issue 2|52-70 62 We summarize the variable description in
table 1 given below:
Results and Discussions
Analysis of First Stage DEA Results
In this section, we discuss trends of average efficiency of Indian ITeS industry over the study period.
Table 1: Description of Variables for second stage regressions
Variable Measurement
Dependent variable: Pareto-Koopmans DEA efficiency scores Independent variables
1. Size Natural logarithm of real sale
2. Experience in business Natural logarithm of years in business 3. Managerial quality Ratio of operating expenses to total assets 4. Market concentration Herfindahl-Hirschman index
5. Profitability Ratio of profit to sales
6. Net export (export - import)/sales
7. Returns to scale (Dummy) a.CRS dummy =1, if the firm exhibits CRS =0, otherwise
b.DRS dummy =1, if the firm exhibits DRS = 0, otherwise
8. US subprime crisis (Dummy) =1, for the years 2008 to 2014 = 0, otherwise
9. Ownership (Dummy) =1, if the firm is a public limited company = 0, otherwise
10. Group (Dummy) =1, if the firm is a group company =0, otherwise
11. BPO (Dummy) =1, if the firm is a BPO =0, otherwise
Source: Authors’ constructions
The efficiency scores are obtained from three different DEA models, namely, CCR, BCC and PK. For both the CCR and BCC models, we have evaluated output-oriented radial efficiency scores. The output-oriented radial measure basically emphasis on the question that by how much output could be increased proportionately without changing the
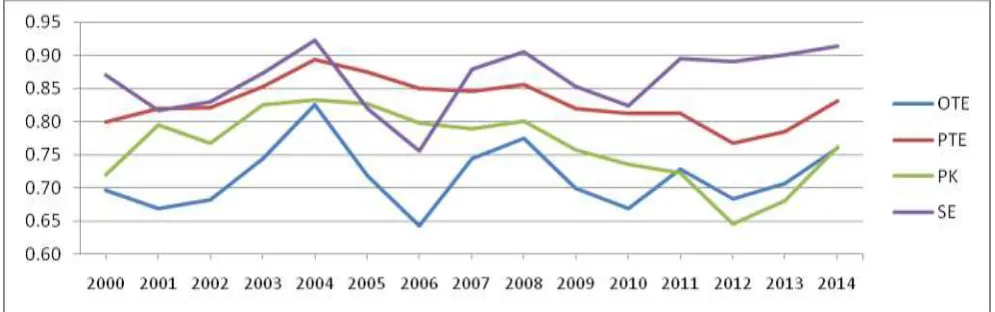
amount of inputs used in the production process. On the other hand, the PK efficiency is based on a oriented non-radial measure. Table 1 shows the mean CCR, BCC, PK and scale efficiency (SE) scores during 2000 to 2014. Figure 2 is the graphical depiction of table 1.
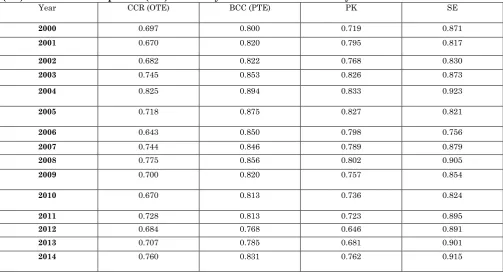
Table 1:Overall Technical Efficiency (CCR), Pure Technical Efficiency (BCC), Scale Efficiency (SE) and Pareto-Koopmans (PK)Efficiency for Indian ITeS Industry
Year CCR (OTE) BCC (PTE) PK SE
2000 0.697 0.800 0.719 0.871
2001 0.670 0.820 0.795 0.817
2002 0.682 0.822 0.768 0.830
2003 0.745 0.853 0.826 0.873
2004 0.825 0.894 0.833 0.923
2005 0.718 0.875 0.827 0.821
2006 0.643 0.850 0.798 0.756
2007 0.744 0.846 0.789 0.879
2008 0.775 0.856 0.802 0.905
2009 0.700 0.820 0.757 0.854
2010 0.670 0.813 0.736 0.824
2011 0.728 0.813 0.723 0.895
2012 0.684 0.768 0.646 0.891
2013 0.707 0.785 0.681 0.901
2014 0.760 0.831 0.762 0.915
Prosenjit Das et. al.| March.-April. 2017| Vol.6| Issue 2|52-70 63 Figure 2: Year-wise Mean Technical Efficiency of Indian ITeS Industry during 2000 to 2014
The findings in Table 1 reveal that average OTE, PTE, SE and PK scores were highest during the year 2004, viz. 0.825, 0.894, 0.923 and 0.833, respectively. On the other hand, average OTE and SE scores were lowest during 2006, viz. 0.643 and 0.756, respectively. The average PTE and PK scores were lowest during 2012, viz. 0.768 and 0.646, respectively. In regards to the
mean PK efficiency, it has been observed that after reaching its peak level during 2004; it was started to fall upto 2012, except the year 2008. Since 2008, there is a sharp decline in average PK efficiency till the year 2012. Since 2012, an upward movement in mean PK efficiency score had been noticed till the end of the study period, i.e., the year 2014.
Figure 3: Decomposition of Overall Technical Inefficiency (OTIE) into Pure Technical Inefficiency (PTIE) and Scale Inefficiency (SIE)
To assess the relative contributions of Pure Technical Inefficiency (PTIE) and Scale Inefficiency SIE) in Overall Technical Inefficiency (OTIE)15, we have plotted year-wise average OTIE, PTIE and SIE in figure 3 based on table A1 (see appendix).
Figure 3 reveals that the contribution of PTIE is higher than the SIE in OTIE, except for the years 2001, 2005 and 2006. Therefore, over the study period, the primary source of OTIE is found to be the PTIE, rather than SIE. Moreover, it can be said that the OTIE occurs mainly due to managerial inefficiency (or
15 OTIE = (1-OTE)*100. Similarly, PTIE = (1-PTE)*100 and
SIE = (1-SE)*100. Here, OTIE, PTIE and SIE are calculated in percentage.
underperformance) rather than inappropriate scale size.
Returns to Scale
Prosenjit Das et. al.| March.-April. 2017| Vol.6| Issue 2|52-70 64 If ≤ 1, it implies the firm exhibits
IRS. If ≥ 1, it means the firm exhibits DRS, and finally, = 1 implies that the firm exhibits CRS or the optimal scale size.
Based on table A2 (see appendix), figure 4 depicts year-wise relative share (in percentage) of ITeS firms exhibiting CRS, IRS and DRS technologies. It is observed that the firms exhibiting IRS
Figure 4: Year-wise Percentage Share of Firms Exhibiting CRS, IRS and DRS Technologies
technology dominated the industry during the initial years of the study period ( from 2001 to 2005), except the years 2000 and 2002. Afterward, DRS firms became predominant in the ITeS industry during 2006 to 2014. Moreover, more than 50 percent firms were found to be exhibiting DRS during 2006 to 2014, except the year 2008 (41.46%). Overall, it can be said that decreasing returns to scale is the primary source of scale inefficiency in Indian ITeS industry as a whole during the study period.
Decomposition of Pareto-Koopmans (PK) Efficiency
In this section, we have segregated the input-specific efficiency from the PK efficiency. First, we have decomposed the PK efficiency into total input and output efficiencies. The total input efficiency is further decomposed into three input-specific efficiencies, namely, efficiency of wages and salaries, efficiency of operating expenses and efficiency of net fixed assets. The efficiency scores are summarized in the following table 2.
Table 2: Decomposition of Pareto-Koopmans (PK) efficiency over the study period Year Wages &
salaries efficiency
Operating expenses efficiency
Net fixed assets efficiency
Input efficiency
Output efficiency
PK efficiency
2000 0.853 0.980 0.717 0.850 0.808 0.719 2001 0.921 0.999 0.910 0.943 0.820 0.795 2002 0.878 1 0.832 0.903 0.835 0.768 2003 0.928 1 0.906 0.945 0.861 0.826 2004 0.941 0.990 0.783 0.905 0.910 0.833 2005 0.974 0.955 0.820 0.916 0.890 0.827 2006 0.923 0.968 0.811 0.901 0.877 0.798 2007 0.966 1 0.767 0.911 0.865 0.789 2008 0.940 1 0.780 0.907 0.879 0.802 2009 0.969 0.994 0.705 0.889 0.843 0.757 2010 0.960 0.921 0.691 0.857 0.852 0.736 2011 0.985 0.958 0.587 0.843 0.843 0.723 2012 0.977 0.993 0.442 0.804 0.787 0.646 2013 0.945 0.992 0.582 0.840 0.800 0.681 2014 0.994 1 0.676 0.890 0.836 0.762 Mean 0.944 0.983 0.734 0.887 0.847 0.764
Standard Deviation (SD) 0.039 0.023 0.127 0.040 0.035 0.055
Prosenjit Das et. al.| March.-April. 2017| Vol.6| Issue 2|52-70 65 The trends in various input-specific average
efficiencies reported in table 2 are graphically presented in the following figure 5. We have plotted the average total input efficiency and three input-specific average efficiency scores over the study period. After some initial fluctuations, the average efficiency of net fixed assets has experienced more or less a declining trend since 2005. In 2012, it reached its minimum level (0.442) and stared to improve thereafter.
Both the other two inputs, namely, operating expenses and wages and salaries have shown more or less a stable trend unlike the net fixed asset. The operating expenses performed best among the three inputs as it is evident from figure 4. From table 2, it can be inferred that the stability of input-specific PK efficiency is highest for operating expenses (as it has lowest SD, viz. 0.023) over time. On the other hand, the efficiency of net fixed assets has the lowest stability (viz. 0.127) over time.
Figure 5: Year-wise Input-specific and total input efficiency of Indian ITeS industry
Analysis of Second StageRegression Results
The pre-regression diagnostic checking found that there exist high correlation between the size and DRS dummy and between profitability and managerial quality variables. Therefore, to mitigate the problem of multicollinearity, we have estimated two regression models. In model I, we exclude managerial quality and RTS dummies and in model II, we exclude size and profit rate as independent variables.
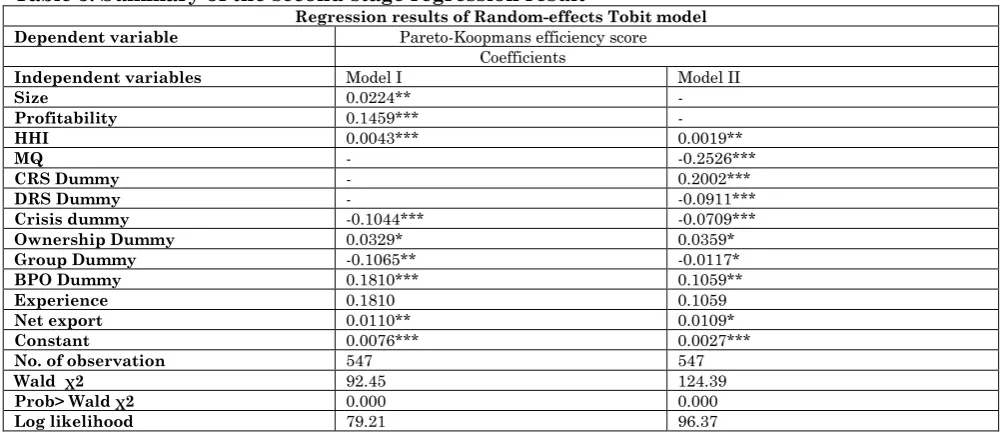
The regression results are summarized in the following table 3. The regression coefficients of size, profitability, HHI, CRS dummy, ownership dummy, net export and BPO dummy are found to be positive and statistically significant. On the other hand, the coefficient of managerial quality (MQ), DRS dummy, crisis dummy and group dummy are found to be negative and statistically significant. The coefficient of experience is found to be positive but statistically insignificant across both the models. The Wald χ2 test results indicate that both the models are overall significant.
Table 3: Summary of the second-stage regression result
Regression results of Random-effects Tobit model Dependent variable Pareto-Koopmans efficiency score
Coefficients
Independent variables Model I Model II
Size 0.0224** -
Profitability 0.1459*** -
HHI 0.0043*** 0.0019**
MQ - -0.2526***
CRS Dummy - 0.2002***
DRS Dummy - -0.0911***
Crisis dummy -0.1044*** -0.0709***
Ownership Dummy 0.0329* 0.0359*
Group Dummy -0.1065** -0.0117*
BPO Dummy 0.1810*** 0.1059**
Experience 0.1810 0.1059
Net export 0.0110** 0.0109*
Constant 0.0076*** 0.0027***
No. of observation 547 547
Wald χ2 92.45 124.39
Prob> Wald χ2 0.000 0.000
Prosenjit Das et. al.| March.-April. 2017| Vol.6| Issue 2|52-70 66 *, **, *** => significant at 10%, 5% and 1% respectively
On the basis of the regression results presented in table 2, we are going to discuss the impact of each independent variable on the dependent variable (i.e., technical efficiency) across various models below.
The coefficient of the variable ‘size’ is found to be statistically significant at 5% level. It implies that higher the size of the firm, higher the technical efficiency. Since size is measured by taking the natural log of sales, it may be inferred that the firm with higher sales is technically more efficient.
The regression coefficient of ‘profitability’variable is positive and significant at 1% level. Hence, there exists a statistically significant positive relationship between profitability and technical efficiency of the ITeS firms over the study period. It can also be concluded that more profitable firms are more efficient in transforming inputs into output.Herfindahl-Hirschman Index (HHI) measures the market concentration. It is a known fact that higher the value of the HHI, the higher the market concentration and lesser the competition. Both the models provide a positive and statistically significant coefficient of HHI.
This implies that the higher the market concentration, the higher the technical efficiency of the ITeS firms. In this connection, it can be said that the general perception regarding the negative relationship between market concentration and efficiency may not be applicable here.
Theoretically, it is believed that the as market concentration falls, competition among firms rises and hence efficiency also rises. But our empirical finding provides just the opposite evidence. One of the logical explanations may the embedded in the efficient structure hypothesis. According to this hypothesis, a low cost structure firm can increase profits by lowering prices and raising market share.
Hence, higher efficiency in production process leads to higher profit, which ultimately raises market concentration. Therefore, a positive relationship between efficiency and market concentration can be explained by this hypothesis. Our empirical result also supports this. Managerial
Quality (MQ) is measured as the ratio of operating expenses to the total assets [36]. The coefficient of this variable is significant at 1% level. This indicates a positive association between managerial quality and technical efficiency of ITeS firms over the study period.
The sign of the coefficient of MQ is negative here. It implies that as the operating expenses increases more proportionately to the total assets, the managerial quality falls, and subsequently the efficiency of the firm under consideration falls. Basically, superior management of the firm leads to lower operational expenses relative to the total assets. Therefore, the negative sign of the coefficient of MQ justifies the expected relation between MQ and efficiency. We can conclude that on an average, the management of an ITeS firm was able to contain the day to day operating costs without compromising the efficiency of the production process during the study period.
The coefficient of this variable ‘net export’ is found to be positive and significant across both the models. On the basis of this result, we can state that as net export rises, the average efficiency of the industry also rises over time. We can also say that a firm with higher net export implies it earns higher foreign exchange, which has positive impact on technical efficiency of that firm.
Moreover, an ITeS firm with higher export-orientation would generally found to be more efficient.The coefficients of both CRS and DRS dummies are found to be statistically significant at 1% level. The sign of the coefficient of CRS dummy is positive whereas it is negative for the DRS dummy. In the regression analysis, IRS firms have been considered as benchmark. We can say that the firms which exhibit CRS technology performed better than the benchmark IRS firms.
Prosenjit Das et. al.| March.-April. 2017| Vol.6| Issue 2|52-70 67 Indian ITeS industry, we have considered
the crisis dummy variable.
The pre-crisis period (i.e., from 2000 to 2007) was taken as benchmark. The regression coefficient of this dummy variable is found to be negative and statistically significant at 1% level in both the models. It can be said that the average performance of the Indian ITeS industry has deteriorated during the post-crisis period (from 2008 to 2014) as compared to the pre-crisis period.
We have introduced theownership dummy variable to examine whether the public Ltd. firms or the private Ltd. firms perform better during the study period. The coefficient of this variable is found to be positive and statistically significant in both the models. It may be inferred as a general conclusion that the public Ltd. ITeS firms performed better than their private counterpart during the study period.
The coefficient ofGroup dummy variable is found to be negative and statistically significant in both the models. The results imply that the non-group (which is considered as benchmark) firms perform better than their group counterparts during the study period.
Although the coefficient of ‘experience’ variable is positive, it is found to be insignificant across both the models. Hence, the relationship between experience and performance of Indian ITeS industry cannot further be explained. The BPO dummy variable is considered to investigate whether the BPO firms are more efficient than the other ITeS firms. The regression coefficient of the variable is found to be positive and significant across both the models. The positive sign of the coefficient indicates that the BPO firm performed relatively better than the non-BPO firms during the study period.
Summary and Concluding Remarks
In this paper, we have assessed the performance of the Indian ITeS industry during the period 2000-01 to 2014-15. For this purpose, we have employed a two-stage empirical methodology. In the first stage, output-oriented technical efficiency scores have been evaluated by employing three DEA models, namely, CCR, BCC and PK. In
the second stage, we have employed RE-Tobit regression model to investigate the determinants of the PK-efficiency obtained from the first stage DEA analysis. In the first stage, we have considered those variables as inputs and output, which are under direct control of a DMU. During the second stage, we have considered some environmental variables which are not under direct control of a DMU.
The first stage DEA results provide some interesting facts about Indian ITeS industry. During the investigation regarding the sources of overall technical inefficiency; it has been found that managerial underperformance is the primary source of overall inefficiency.
Therefore, the ITeS firms need to improve the managerial performance in transforming inputs into output more judiciously. The results of CCR model found that the firms which exhibit DRS technology had been dominating the ITeS industry for most of the study period (precisely, since 2003 to 2014). This indicates that Indian ITeS industry is dominated by the DRS technology, which implies the industry, as a whole, over-utilizes its resources.
The firms need to calibrate their input use to optimize resource utilization in the long run. Moreover, the firms should resize their input-output mix to exhibit CRS technology in the long run. The decomposition of overall input PK-efficiency into three input-specific efficiency scores revealed that the efficiency of net fixed assets over time exhibits a falling trend and it is the worst performing input. On the other hand, the operating expenses is found to be most efficient input during the study period. It can be suggested that the firms need to utilize net fixed assets more judiciously to improve its efficient use in future.
Prosenjit Das et. al.| March.-April. 2017| Vol.6| Issue 2|52-70 68 found to be negative and statistically
significant, which implies that during the US crisis period, the outsourcing assignments from US to India had reduced considerably, as a consequence, the performance of the Indian ITeS firms was declined. The public Ltd. firms performed better than the private Ltd. firms. The non-group firms are found to be more efficient than the group firms during the study period. And finally, the BPO firms have performed better than the non-BPO firms.
The Indian ITeS industry has been performing remarkably and consistently since its inception and birth in 1999-00. This industry earns a significant portion of the foreign exchange reserves due to its higher export orientation. On the other hand, this industry has created both direct and indirect employment opportunities at a large scale.
So far, the Indian Government has played a key role in supporting the growth of this industry by providing various tax sops and incentives, establishing Software Technology Parks of India (STPI) etc. Since this industry is mainly export oriented and a significant portion of its profit comes from outsourcing, the policy makers should devise policies to encourage exports of this sector in future. Keeping the heterogeneity of this industry in mind, government should plan separate policies for various segments of this industry (such as public Ltd., Private Ltd., Group and non-group firms).
Emerging competition in outsourcing business from various Countries like
Ireland, China, and Philippines is a matter of concern for India. In this regard, suitable policy formulation is required to maintain India’s global leadership position intact. To maintain a significant supply of English speaking and IT educated talent pool every year, the policy makers should develop relevant education policy.
In this front, focus should be given on updating the IT-Engineering course curricula as per the international standard. Since the ITeS industry need reliable and high-speed network connection, focus on the up gradation of the telecommunication policy should be provided. On the other hand, uninterrupted supply of electricity and easy access to venture capital are some basic other prerequisites for the sustainable development of this industry. Our study could be extended in three broad directions in future research.
Firstly, in our study, we employed only DEA to evaluate technical efficiency. Other popular techniques such as Stochastic Frontier Analysis (SFA) might be considered to evaluate efficiency along with DEA for a comparative analysis. Secondly, the presence of structural break(s) in the trend of technical efficiency could be examined by incorporating time series analysis. Finally, some control variables, which are not considered in the present study, such as government policy, dynamics of global economic environment etc, could be considered in the second-stage regression analysis.
References
1.Fisher AGB (1939) Production, Primary, Secondary and Tertiary, Economic Record 15(1):24-38.
2.Rakshit M (2007) Service-led Growth: The Indian Experience, Money and Finance, ICRA Bulletin, February, 91-126.
3.“Exports of Services and Offshore Outsourcing: An Empirical Investigation in the Indian Context”, Export-Import Bank of India, July, 2012, Occasional paper No. 156.
4.Bhattacharjee S (2012) Efficiency Dynamics and Sustainability of the Indian IT-ITeS Industry: An Empirical Investigation using DEA, IIMB Management Review, 24:203-214.
5.Mathur SK (2007) Indian IT Industry: A Firm Level Analysis Using DEA and Malmquist Index, RIS Working Paper.
6.Chen X, Wang X, Wu DD, Zang Z (2011)Analysing Firm Performance in Chinese IT industry: DEA Malmquist Productivity Measure, International Journal of Information Technology and Management, 10 (1):3-23.
7.Sahoo BK (2016) Ownership, Size and Efficiency: Evidence from Software Companies in India, Benchmarking: An International Journal, 23(2):313-328.
Prosenjit Das et. al.| March.-April. 2017| Vol.6| Issue 2|52-70 69 9.Charnes A, Cooper WW, Rhodes E (1978)
Measuring the Efficiency of Decision Making Units. European Journal of Operational Research, 2(6):429–444.
10. Banker RD, Charnes A, Cooper WW (1984) Some Models for Estimating Technical and Scale Inefficiencies in Data Envelopment Analysis. Management Science, 30(9):1078-1092.
11. Ray SC (2004) Data Envelopment Analysis: Theory and Techniques for Economics and Operations Research. Cambridge University Press, Cambridge.
12. Pastor JT, Ruiz JL, Sirvent I (1999) An Enhanced DEA Russell-graph Efficiency Measure. European Journal of Operational Research. 115(3): 596–607.
13. Ray SC, Neogi C (2007) A Non-Radial Measure of Efficiency in Indian Textile Industry: An Analysis of Unit-level Data. Working Paper No. 38, Department of Economics, University of Connecticut, USA.
14. Greene WH (2008) Econometric Analysis, Fifth Edition, Pearson Education.
15. ChilingerianJA (1995) Evaluating Physician Efficiency in Hospitals: A Multivariate Analysis of Best Practices. European Journal of Operational Research, 80(3):548-574.
16. JacksonPM, Fethi MD (2000) Evaluating the Technical Efficiency of Turkish Commercial Banks: An Application of DEA and Tobit Analysis. International DEA Symposium, University of Queensland, Brisbane, Australia, 2-4 July.
17. Kirjavainen T, Loikkanen H (1998)Efficiency Differences of Finnish Senior Secondary Schools: An Application of DEA and Tobit Analysis, Economics of Education Review, 17(4):377-39.
18. Pasiouras F (2008) International Evidence on the Impact of Regulations and Supervisions on Banks’ Technical Efficiency: An Application of Two-stage Data Envelopment Analysis. Review of Quantitative Finance and Accounting, 30(2):187-223.
19. Selim S, Bursalıoğlu S (2015) Efficiency of Higher Education in Turkey: A Bootstrapped Two- stage DEA Approach, International Journal of Statistics and Applications, 5(2): 56-67.
20. Merkert R, Hensher DA (2011). The Impact of Strategic Management and Fleet Planning on Airline Efficiency - A Random Effects Tobit Model Based on DEA Efficiency Scores. Transportation Research, Part A, 45:686–695.
21. Zeng W,Shepard D, Chilingerian J, Carlos Avila-Figueroa A (2012)How Much can We Gain from Improved Efficiency? An Examination of Performance of National HIV/AIDS Programs and its Determinants in Low- and Middle-income Countries, BMC Health Services Research. 12: 74.
22. Susiluoto I (2013) Effects of ICT on Regional Economic Efficiency, Helsinki City Urban Facts Office, Web Publications, MUTEIS Impact Study, 16.
23. Das P (2017)An Assessment of Performance of Indian Software Industry During 2000-01 to 2014-15 Using Data Envelopment Analysis, International Journal of Engineering, Applied and Management Sciences Paradigms, 44(01):7-21.
24. Baltagi B (1995) Econometric Analysis of Panel Data. New York: John Wiley & Sons.
25. Dogramaci A, Adam NR (1981) Aggregate and Industry-Level Productivity Analyses, MartinusNijhoff Publishing.
26. Sahoo D (2011) A Cross-Industry Efficiency Analysis and Contribution of the Information and Technology Sector to Indian Economic Growth, SSRN Electronic Journal, DOI: 10.2139/ssrn.1976083.
27. Sahoo BK (2013) Total Factor Productivity of the Software Industry in India, Working Paper No. 331, Institute of Economic Growth, New Delhi.
28. Bhattacharya R, Patnaik I, Shah A (2010) Productivity and Outbound FDI in Software Services: A Reversal of the HMY Model, NIPFP-DEA Research Program.
29. Dastidar SG (2004) A DEA Approach to Measure the Performance of Indian Software Companies: An Empirical Study, The International Journal of Applied Strategic Management, Volume 1, Issue 3.
30. Mahajan V, Nauriyal DK, Singh SP (2014) Efficiency and Ranking of Indian Pharmaceutical Industry: Does Type of Ownership Matter?, Eurasian Journal of Business and Economics, 7 (14):29-50.
31. Mogha SK, Yadav SP, Singh SP (2012) Performance Evaluation of Indian Private Hospitals Using DEA Approach with Sensitivity Analysis, International Journal of Advances in Management and Economics, Vol.1, Issue 2.