ISSN: 2278-3369
International Journal of Advances in Management and Economics Available online at: www.managementjournal.info
RESEARCH ARTICLE
Analysing CO2 Emissions from Transportation Expenditures by
Malaysian Households
Norlaila Abdullah Chik
*, Khalthum Hassan,
Wahida Ayob
School of Government, College of Law, Government and International Studies, Universiti Utara Malaysia,06010 Sintok, Kedah, Malaysia.
*Corresponding Author: Norlaila Abdullah Chik
Abstract
This study analyses the impact of Malaysian household consumption on the transportation sector regarding CO2 emissions by using the Hybrid Input Output Table from 1991, 2000, 2005 and 2010. Initially, this study calculates CO2 emissions intensity for every sector. Results show that the sector with the highest CO2 emission intensity was Transportation at 1.16 (T- CO2/M-MyR). By using the hybrid, I-O table, the average values of the total CO2 emission intensity caused by energy consumption in Malaysia were found to be 0.272 (T- CO2/M-MyR). Transportation sector contributed the relatively high level of consumption and produces the highest amount of CO2 emission in 1991, 2000, 2005 and 2010. Our analysis shows that continuously increasing consumption in the Transportation sector will continue to affect the environment. Thus, through encourage consumers to use hybrid or solar cars and the imposition of a carbon tax on old vehicles, owners will reduce their CO2 emissions. By imposing a carbon tax, motor vehicle owners will strive to reduce their CO2 emissions by consuming renewable energy or use energy saving techniques in their everyday lifestyle.
Keywords -CO2 emission, Transportation, Expenditure, Hybrid input-output analysis, Households.
Introduction
Since its remarkable change from an agriculture country to an industrialized country, Malaysia has seen its GDP grow from RM105 billion in 1990 to RM1,012 billion in 2014. There is a strong
relationship between income and
expenditure because when incomes increase, expenditure patterns tend to change [1].
Households benefited from the continued increase in disposable income arising from high export earnings and economic growth, which also generated full-employment and
income-earning opportunities among
Malaysians. Moreover, the availability of affordable, low-interest credit provided further support to more household spending particularly on motor vehicles.
In general, consumption is obviously
something good and the more the consumption, the better enhanced is a
person’s lifestyle. With increasing
consumption, households have been able to improve the material lifestyles more than previously possible [2][3]. Based on Fig. 1, household spending is due to the introduction of GST on 1 April 2015.
0 20,000 40,000 60,000 80,000 100,000 120,000 140,000
Food Rea l Esta te Tra nsporta tion Other services Com m unica tion Resta ura nts a nd hotels
Ty
pe
o
f E
xp
en
di
tu
re
(R
M
'm
ill
io
n)
2010 2015
Figure 1: Type of Expenditure by Malaysian Households Sources: Department of Statistics, Malaysia (2016)
According to the [4], about 13.8 percent of total private consumption came from Transportation. However, in terms of energy
consumption, the Transportation sector accounted for the highest level of energy consumption, as shown in Fig. 2.
Figure 2: Final Energy consumed by Sectors Sources: Source: National Energy Balance (2015)
Energy consumption by the Transportation sector only competes with that by the Manufacturing sector. Energy consumption by the Transportation sector represents energy used for all kinds of transportation except international marine bunkers. This sector covers road, air, railway and internal
navigation. Demand of households on the Transportation sector contributed the
highest CO2 emissions due to the number of
private motor vehicles and public
transportation on Malaysian roads steadily
increasing, thereby increasing the
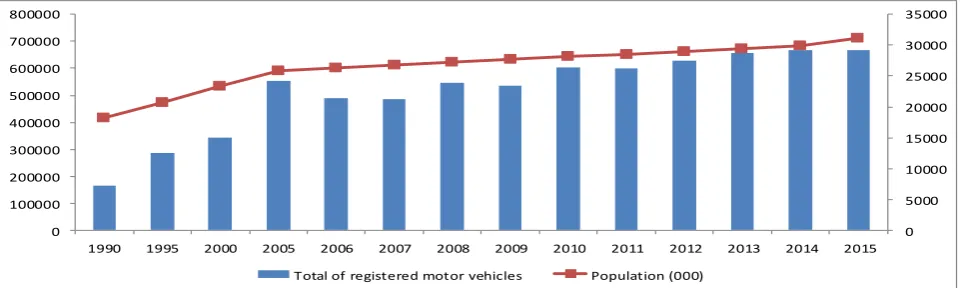
population and energy consumption pattern shown in Fig. 3.
0 5000 10000 15000 20000 25000 30000 35000
0 100000 200000 300000 400000 500000 600000 700000 800000
1990 1995 2000 2005 2006 2007 2008 2009 2010 2011 2012 2013 2014 2015 Total of registered motor vehicles Population (000)
Figure 3: Relationship between total of registered motor vehicles and population Source: Ministry of Transportation and United Nation Statistic Division, WDI (2015)
Besides that, petroleum products used by
motor vehicles also causes side effects on the environment. The growth rate of motor car ownership tends to slacken over time as the
0 5000 10000 15000 20000 25000 30000
1990 1995 2000 2005 2010 2014
F
in
al
En
er
g
y
C
o
n
su
mp
ti
o
n
b
y
S
ec
to
r
(K
to
e)
diffusion rate increases. This is the same trend seen for most other household durable goods because they are near the point of dispersion. Increased transportation usage, combined with inadequate road systems, has caused unendurable traffic congestion in large cities, such as Kuala Lumpur, Penang and other developing cities. This in turn has effected huge economic losses as well as worsened the environment in Malaysia.
Private motor vehicles pollute the
environment by emitting CO2 and other
greenhouse gases (GHG) from fuel
combustion, fuel supply, vehicle
manufacture and disposal. Road
transportation is the most significant contributor to environmental impact in Malaysia, which consumed about 36% of the total energy [5][6].
Figure 4: Relationship between energy consumption and carbon dioxide (CO2) emission Sources: United Nation Statistic Division, WDI (2015)
Currently, many countries struggle to achieve the goal of emitting zero carbon from energy consumption, but this is very difficult to achieve. Although, carbon dioxide can be cleaned, this requires both short- and long-term investments [7] and is mainly for countries with high GDP. The trade-off
between economic growth and
environmental degradation is a national and local concern. It is very important to save the environment through efficient energy management and consumption before the reduction in quality of the environment becomes irreversible (see Fig. 4).
With rapid development, the transportation sector has contributed significantly to development of socioeconomic of the country and its contradiction to quality of environment. Recently, the transportation sector accounts for 28% of total CO 2 emissions, of which 85% comes from road transport [8]. However, the threat posed by
the generation of CO2 emissions was not
appreciated but has grown over time and now appears as serious global warming causing climate changes [9].
Household activities are among the major
contributors to the generation of CO2
emissions through burning of fossil fuels for private motor vehicles and the provision of public transportation. In recent years, the number of private motor vehicles on Malaysian roads has steadily increased, thereby increasing the consumption of fossil fuels.
Moreover, even though Malaysia is a non-annex 1 country in the Kyoto Protocol, Malaysia has shown its concern for the environment in its declaration to reduce the amount of carbon dioxide in the air by up to 40 percent by the year 2020 in comparison to the 2005 level.
According to the [10], the trend of energy consumption and production will continue to rise in the next few years. In that case, a shortage of energy will occur in the future if consumers use energy inefficiently and the
amount of related CO2 emissions continues
to increase.
Given the situation, this study analyses the impact of Malaysian household consumption
on the transportation sector towards CO2
0 10000 20000 30000 40000 50000 60000 70000 80000 90000
0 500 1000 1500 2000 2500 3000 3500
199
0
199
1
199
2
199
3
199
4
199
5
199
6
199
7
199
8
199
9
200
0
200
1
200
2
200
3
200
4
200
5
200
6
200
7
200
8
200
9
201
0
201
1
201
2
201
3
emissions using the Hybrid Input Output Tables from 1991, 2000, 2005 and 2010. This paper is organized as follows. Section 2 presents a literature review of energy
consumption and CO2 emission by the
Transportation sector. Section 3 describes an overview of the model employed in this study. Section 4 presents results and
findings. Conclusions and Policy
implications of the results are discussed in Section 5.
Literature Review
The relationships between population, economic growth, energy consumption and the environment have been greatly analysed over last two decades. [11] States that far from being a hazard to the environment in the long term, economic growth is necessary to maintain and improve environmental quality.
Population density, energy consumption and economic growth have a positive relationship
to CO2 emissions both in the short-run and
long-run [12]. Many studies analysed the
CO2 emissions and various implementing
policies and planning strategies to reduce
CO2 emissions. Therefore, various studies
previously conducted focused on the
reduction of CO2 emissions. [13] used a
simple method to estimate changes in consumption that were assessed during the period of survey by suggesting a way for households to use energy efficiently.
Several researchers applied an econometric model for environmental analysis. For instance, [14] studied the linkages among economic growth, energy consumption, financial development, trade openness and
CO2 emission by using the Zizot-Andrew
unit root test and ADRL found that the variables are cointegrated. [15] found that economic growth influences energy demand
and CO2 emission. While [16] found that the
relationship between urbanization and CO2
emissions is U-shaped.
Increases in population size effects the environment through energy consumption by transportation sector because the relationship between them very significant in various countries. [17] found that about 43% of total GHG emission is attributable to 10% of households in UK from personal
travel. [18] studied the causal relationships between transportation energy consumption
and CO2 emission generated by
transportation using the Johansen
multivariate cointegration approach. [19] found that that there is a positive
relationship between CO2 emission and road
transportation value added and population.
The current study uses the methods of input output analysis and hybrid analysis that are combinations of two units, which are monetary and physical units [20]. The use of
input output analysis for energy
requirement was applied by [21] and [22].
Their work was followed by the overview on input output energy requirement by [23] and emissions as an external multiplier to the model as mentioned by [24]. The Hybrid analysis is also work intensive and requires complete data, as shown in the method of firm calculation by [25] previously proposed by [26] followed by [27] and [28].
This form of analysis was increasingly used for energy analysis and the environment as shown in the work by [29] [27] and [30]. [31] and [32] estimated energy intensity and GHG emission intensity in Korea using Hybrid input output analysis (HIO), [33] proposed hybrid physical input-output model for energy analysis (HPIOMEA).[34] and
[35] developed the GHG emission
embodiment.[36] found that energy
requirements are influenced by urban forms, income levels and demographics.[37] found that declining energy intensity contributes the most to emission reductions followed by residential lifestyle in Beijing. Households are the most significant contributors to the
generation of CO2 because of the direct
impact of their energy consumption and the indirect impact of their demand for products and services [38] [39] [40].
Among all final demand factors, the impact of household consumption on energy
consumption and CO2 emission has drawn
significant attention in recent years, particularly on the Transportation sector.
There are few studies on energy
consumption and CO2 emissions using the
flow of indirect energy of this sector is high. Research literature reveals that the energy
consumption caused by household
consumption is high and more importantly
emphasizes that indirect energy
consumption accounts for a large proportion in total energy consumption. [42] found that the primary positive drivers of carbon emissions in the Transportation sector and negative drivers are the transportation intensity and energy structure.
In Malaysia, there are limited studies and reports on topics that apply hybrid input-output analysis (HIOA). In other words, the process of analysis was used to calculate the energy requirement of the energy intensive products while the input–output analysis was applied to calculate that of other products.
Moreover, HIOA is an important method in the analysis of energy consumption, especially for resources to meet energy
demand and the impact of final use of energy by different sectors such as the energy consumed both directly and indirectly by households.
Methodology
The basic I-O model extended into
environmental I-O analysis considers
additional intersectoral flows, for instance natural resources (energy) and pollution (greenhouse gas) in addition to conventional economic flows. In this study, to extend a standard I-O model into an environmental
input-output (E-IO) model, the direct CO2
emission matrix (W) was introduced.
In order to calculate indirect CO2 emission
by the household, the CO2 intensity or multiplier in equation (1) was used by using the extended input-output model first introduced by [43] and later extended by others, for example [44][45][46][31]. The basic environmental
I-O model can be represented using the
equation as follows:
W = (m # r) f’ Eq. (1)
Equation (1) can be represented in matrix form: -
W
W
W
40 13 1 . . . . =
m
m
m
m
m
m
m
m
m
4011 711 111 711 77 17 111 17 11 #.
.
.
.
.
.
.
.
.
.
.
.
.
.
.
.
.
.
.
.
.
.
.
.
.
.
r
r
r
4 0 1 3 1 . . . . x f
f
f
11 7 1 . . . .where W denotes a scalar of CO2 emission
intensity for sector 1 to sector 40, # denotes element by element multiplication (cell by
cell), f is the transpose of an 1x11 vector of
CO2 emissions per unit of energy
consumption of each of the 11 energy types
or is considered as CO2 emission factor; mis
a 40x11 matrix of energy mix or energy consumption in the production sectors for sector 1, i.e. the demand for 11 energy types per unit of total demand for energy for all
production sectors; r is a 40x1 vector of total
energy intensity for sector 1, i.e. total energy consumption per unit of all 40 sectors.
Total CO2 emissions by sectors
Firstly, the quantity of CO2 emission for
each industry can be expressed in matrix form as follows:
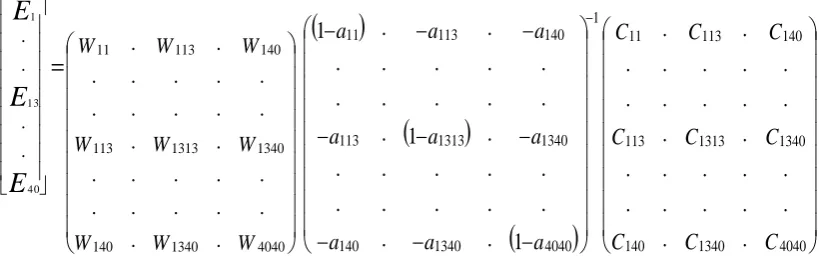
Ec = W. (I-A)-1.C Eq. (2)
E
E
E
40 13 1 . . . . = W W W W W W W W W 4040 1340 140 1340 1313 113 140 113 11 . . . . . . . . . . . . . . . . . . . . . . . . . .
a a a a a a a a a 1 . . . . . . . . . . . . . 1 . . . . . . . . . . . . . 1 4040 1340 140 1340 1313 113 140 113 11 1 C C C C C C C C C 4040 1340 140 1340 1313 113 140 113 11 . . . . . . . . . . . . . . . . . . . . . . . . . .where Ec is denoted as a scalar of total CO2
emission from the production sectors, W is a
40x1 vector of CO2 emission intensities, i.e.
total CO2 emission per unit of production
sector in all 40 sectors; (I-A)-1 is the 40 x 40
Leontief inverse matrix, C (Private consumption). With the last equation,
changes in the total emission of CO2 can be
attributed to changes in the factors W
(CO2emission intensity), L (Leontief
inverse), and C (private consumption).
Data Sources
This study utilized two kinds of data:
The first set of data was based on four Malaysian input-output tables for the years 1991, 2000, 2005 and 2010 from the Department of Statistics (DOS).
The second set of data regarding the energy consumption for the years 1991-2015 were taken from the National Energy Centre (PTM).
The CO2 emission factors were calculated
based on the carbon contents of the fuels (as shown in the IPCC revised 1996-Module 1- Tier 1).
Results and Discussions
High embodied energy intensity effects CO2
emission intensity through energy
consumption. The results from quantifying
the CO2 emission intensities show that the
sector with the highest CO2 emission
intensities. Regression analysis can be applied to determine the relationship
between CO2 emissions intensity and
household consumption for 2010 based on private consumption [47] (Final demand, 2010). By using the hybrid, I-O table, the
average values of the total CO2 emission
intensity caused by energy consumption and household expenditure in Malaysia were
found to 0.272 (T- CO2/M-RM) and RM 8,
787,622 thousand, respectively as shown in Figure 5. This figure is divided into quadrants of low-high (Quadrant I), high-high (Quadrant II), low-low (Quadrant III) and high-low (Quadrant IV). Most of the sectors lie on average values except for the Cements and Transportation sectors. The main concern of this study is the Transportation sector due to it having the
highest CO2 emission intensity at 1.16 (T-
CO2/M-MyR), even households consume less
on this sector.
Figure 5: Distribution of 40 sectors from total energy use in 2010
In an effort to reduce CO2 emissions, CO2 emissions intensity must be reduced in the
initial stage. The way to reduce CO2
emissions intensity is through changes in lifestyle, the use of solar power, green tech products and encouraging people to consume renewable energy.
This study also applied regression analysis to estimate the relationship between
consumption and CO2 emission produced, as
shown in Fig. 6, 7, 8 and 9 based on Equation 2. The result from Equation 2 shows that in the case of total energy use in 1991, 2000, 2005 and 2010, the average
values of consumption by sector and CO2
emission intensity of the 40-economic sector, including energy and non-energy sectors, were shown in every figure. Those figures show the relationship between consumption
by sector and CO2 emission produced in by
consumption.
Every scatter plot was divided into four quadrants, i.e. quadrant I, II, III and IV. Most of the Transportation sector lays in quadrant II and III compared to quadrant I and IV. The sector that lies in quadrant I
indicates that this sector contributed high
consumption with low CO2 emission while
the sector that lies in quadrant II indicates
that this sector contributed high
consumption with high of CO2 emission. The
sector that lies in quadrant II indicates that this sector contributed low consumption with
low CO2 emission. The sector that lies in
quadrant IV indicates that this sector contributed high in consumption with low
CO2 emission.
The sectors lie in quadrant I and II are
produced high CO2 emission products.
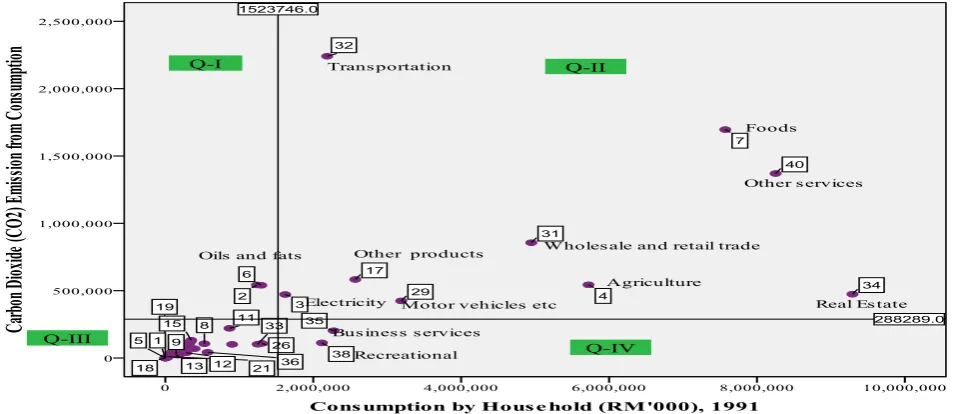
Figure 6 show the relationship between
consumption and CO2 emission from
consumption in 1991. From this figure, it is shown that there were fewer sectors in quadrant I and IV. Most sectors lie in quadrant II and III. By observing quadrant II, transportation has contributed the relatively high of consumption and produces
the highest of CO2 emission. In 1991, the
transportation sector is the most polluted
due to the highest of CO2 emissions
intensity. Even consumption by households is less than consumption on real estate and wholesale and retail trade (Fig. 6).
Figure 6: Distribution of 40 sectors from the private consumption, 1991
However, Fig. 7 shows the relationship
between CO2 emissions and consumption by
households in 2000. The average value of
consumption and CO2 emissions increased
by 98% from 1991 to 2000, the sectors that
lie in that scatter diagram have remained unchanged if compared to Fig. 6. The
transportation still contributed the
relatively high level of consumption and
produced the highest of CO2 emission in
Figure 7: Distribution of 40 sectors from the private consumption, 2000
Fig. 8 shows the transportation sector still
contributed the relatively high of
consumption and produced the highest of
CO2 emission in 2005. However average
value of consumption and CO2 emissions
increased by 44.8% and 92.8%, respectively.
Figure 8: Distribution of 40 sectors from the private consumption, 2005
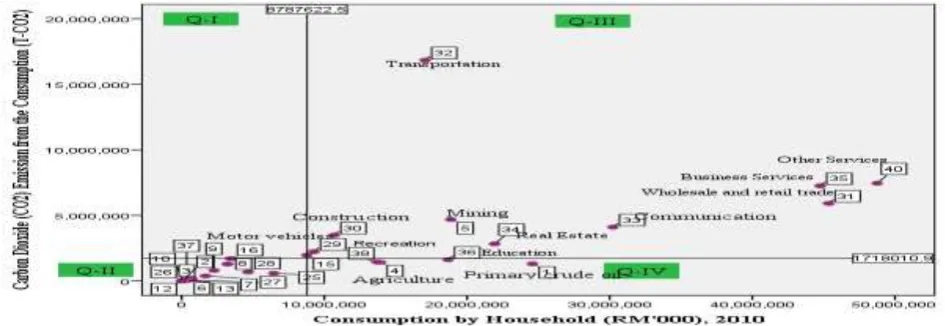
More sectors in Quadrant II in 2005 moved near to Quadrant IV in 2010 (as shown in Fig. 9). Transportation still contributed the
highest CO2 emissions in 2010. However, the
transportation sector still contributed the relatively high level of consumption and
produced the highest CO2 emissions in 2010.
Private Consumption increased about 51 percent from 2005 to 2010. Based on National Account, private consumption contributed 91 percent in GDP 2015 after exports.
Most of sectors are in quadrant III and IV, which indicates that this sector as low dependence on energy sources and is characterized by industries that use environmentally friendly processes in terms of energy use because this sector remains below the horizontal average value line for
CO2 emission.
This distribution is very important in order to identify the energy intensive sectors because more energy use will produce more
CO2 emissions. This study estimates that
consumption in the Transportation sector
still will contribute the highest CO2
emissions in the future. Based on data of Private Final Consumption Expenditure 2016, expenditure by households on Transportation increased by 36% from 2010 to 2015 compared to 2005 through 2010 consumption on that sector increased by 29%.
This figure shows that expenditure on Transportation continues to increase,
causing the level of CO2 emissions also to
rise. In addition, the Malaysian
transportation sector has generated about
28% of the total CO2 emission, of which 85%
comes from road transportation.
Conclusion and Policy Implication
The trend of private consumption shows thatwhen consumer income rises, the
consumption pattern also changes,
particularly the demand on transportation, wholesale and retail trade, construction and electricity [48]. From Fig. 6, 7, 8 and 9, demand on motor vehicles is the highest after wholesale and retail trade and this
sector produced the highest level of CO2
emission. Based on [10] energy consumption of that sector still is relatively high particularly for road transportation, which contributed the largest share (82%) of total
CO2 emissions [8].
Based on this analysis, CO2 emissions
intensity of Transportation is difficult to reduce due to growing of Malaysian economy and demands on motor vehicles continues to grow. Therefore, the conclusion is that Malaysia will have difficulty achieving its
target of reducing its CO2 intensity, but
Malaysia can achieve the target if it gradually changes to renewable energy such as biomass, solar power, nuclear and hydropower as well as from educating people to change their lifestyle and behaviour towards green tech and environmentally
sustainable and low emission CO2 products.
To achieve environmental impact reduction goals, management of public transportation also must be efficient because it can encourage people to use mass public transportation, particularly bus and train. Moreover, public transport only contributed
about 5% of total CO2 emissions of the road
transportation sector in Malaysia and motorcars as well as motorcycles contributed 52% and 15%, respectively [8]. From this percentage, most Malaysians prefers to use private transportation rather than public transportation for travelling. This study also provides information to the government and policy makers in identifying the sectors that consume a large amount of energy and
produce a large amount of CO2
emissions.
Final Conclusion
In this study, energy consumption was shown to be is increasing for the
Transportation sector. Therefore, CO2
emissions will rise. This sector has not been able to achieve their voluntary targets in
reducing their CO2 emissions due to
increasing demand for motor vehicles. With this information, the government can encourage consumers to use hybrid or solar cars and impose a higher carbon tax on old
vehicles owners so that they become
moreconcerned about the current
environment level. Old engines may cause incomplete combustion that generates more CO2 compared to new vehicles. By imposing a carbon tax, motor vehicle owners will
strive to reduce their CO2 emissions by
sector is still results in high CO2 emissions
and high CO2 emission intensity. The
findings of such future study have the potential to indicate the best way in the short term to curtail or control growth in
CO2 emissions because domestically,
consumption is the highest contributor to GDP compared to government spending.
This responsibility to protect the
environment rests on the household due to its important place in the economy
References
1.Sanne C (1998) “The (I’m) possibility of sustainable lifestyle: Can we trust the public opinion and plan for reduced consumption? Urban Research Program Working Paper No. 63.”Research School of Social Science, Australian National University, Canberra.
2.Sachdeva S, Jordan J, Mazar N (2015) Green consumerism: moral motivations to a sustainable future, Current Opinion in Psychology, 6:60-65
3.Alfredsson EC (2004) ‘‘Green’’ consumption—no solution for climate change. Energy, 29:513–524.
4.Department of Statistics, Malaysia. Input-Output Tables for, 1999, 2000 and 2005.
5.Kamarudin SK, Daud WRW, Yaakub Z, Misron Z, Anuar W, Yusuf NN (2009) Synthesis and optimization of future hydrogen energy infrastructure planning in peninsular Malaysia. International Journal of Hydrogen Energy, 3(4):2077-2088.
6.Lim S, Lee KT (2012) Implementation of bio fuels in Malaysian transportation sector towards sustainable development: a case study of international co-operation between Malaysia and Japan. Renewable and Sustainable Energy Reviews, 1: (6) 1790–1800.
7.Radetzki M (2001) the green myth - economic growth and the quality of the environment (UK: Multi science Publishing Co.
8.Mustapa SI, Bekhet AH (2016) Analysis of CO2 emissions reduction in the Malaysian transportation sector: An optimisation approach. Energy Policy, 8 (9) , 171–183. 9.IPCC, IPCC (2006) guidelines for national greenhouse gas
inventories; 2007, Intergovernmental Panel on Climate Change.
10. National Energy Balance, Malaysia Energy Centre, 2015.
11. Meadows DH, Meadows DL, Randers J, Behrens W (1992) the limits to growth (New York: Universe Books.
12. Ohlan R (2015) the impact of population density, energy consumption, economic growth and trade openness on CO2emissions in India. Natural
Hazard, 7(9)1409-1428.
13. Benders RMJ, Moll HC, Nidjam DS (2011) from energy to environmental analysis: improving the resolution of the environmental impact of Dutch private consumption with hybrid analysis. Industrial Ecology, 1(6) 163-175.
14. Shahbaz M, Qazi M, (2013) A Economic growth, energy consumption, financial development, international trade and CO2 emissions, in Indonesia.
Renewable and Sustainable Energy Reviews, 2: (5) 109-121.
15. Rawshan AB, Sohag K, Sharifah SA, Mokhtar J (2015) CO2 emissions, energy consumption, economic and
population growth in Malaysia. Renewable Sustainable Energy, 4: (1) 594–601.
16. Shahbaz M, Logan than N, Muzaffar AT, Ahmed K, Jabran M (2016) A How urbanization affects CO2 emissions in Malaysia? The application of STIRPAT model. Renewable and Sustainable Energy Reviews, 5: (7) 83-93.
17. Brand C, Boardman B (2008) Taming of the few—the unequal distribution of greenhouse gas emissions from personal travel in UK. Energy Policy 3: (6) 224–238.
18. Achour H, Belloumi M (2016) Investigating the causal relationship between transport infrastructure, transport energy consumption and economic growth in Tunisia. Renewable and Sustainable Energy Reviews, 5: (6) 988–998.
19. Alipour MS (2016) A review of road transportation value added and CO2 emission in Iran. Environmental
Sciences, 4: (1) 5 – 22.
20. Leontief W (1966) Input–output economics (New York: Oxford University Press.
21. Bullard C, Herendeen R (1975) the energy costs of goods and services. Energy Policy, 1, 268-277.
22. Wright D (1974) Goods and services: an input–output analysis. Energy Policy, 2 307–315.
23. Peet J (1993) Input-output methods of energy analysis. International Journal of Global Energy Issues, Special Issue on Energy Analysis, 5: (1), 10-18. 24. Miller R, Blair P (2009) Input-output analysis:
foundations and extensions. (New Jersey: Prentice Hall.
25. Van Engelenberg, BCW Van, Rossum TFM, Blok K, Vringer K (1994) Calculating the energy requirements of household purchases: a practical step-by-step method. Energy Policy 2: (1), 648–656.
26. Bullard CW, Penner PS, Pilati DA (1978) Net energy analysis: handbook for combining process and input– output analysis. Resources Energy 1,267–313. 27. Vringer K, Blok K (2000) Long-term trends in direct
and indirect household energy intensities: a factor in dematerialization? Energy Policy, 2(8)713–727.
28. Vringer K, Blok K, Van Engelenburg B (2006) Determining the primary energy requirement of consumption patterns, in: Suh, S. (Ed.), Handbook of Input–Output Economics for Industrial Ecology. (The Netherlands: Springer, Dordrecht, 20–40.
29. Suh S, Lenzen M, Treloar GJ, Hondo H, Horvath A, Huppes G, Jolliet, O, et al.(2004) System boundary selection in life-cycle inventories using hybrid approaches. Environmental Science & Technology, 3: (8) 657–664.
technology and government outlay options. Energy Economics, 2: (4) 377–403.
31. Chung WS, Tohno S, Shim SY (2009) an estimation of energy and GHG emission intensity caused by energy consumption in Korea: an energy IO approach. Applied Energy, 8: (6) 1902-1914.
32. Liu CH, Lenzen M, Murray J (2012) A disaggregated emissions inventory for Taiwan with uses in hybrid input-output life cycle analysis (IO-LCA), Natural Resources Forum.
33. Liang. S, Wang C, Zhang T (2010) An improved input– output model for energy analysis: A case study of Suzhou, Ecological Economics,6: (9) 1805–1813
34. Zhou X, Kojima S (2009) How does trade adjustment influence national emissions? Inventory of open economies? Accounting embodied carbon based on multi-region input–output model. 17th International Input–Output Conference of the International Input– Output Association (IIOA), São Paulo, Brazil.
35. Chen GQ, Zhang B (2010) Greenhouse gas emissions in China 2007: inventory and input–output analysis. Energy Policy 3: (8), 6180–6193.
36. Wiedenhofer D, Lenzen M (2013) Steinberger JK Energy requirements of consumption: Urban form, climatic and socio-economic factors, rebounds and their policy implications. Energy Policy, 6: (3) 696-707. 37. Wang Z, Yang Y (2016) Features and influencing
factors of carbon emissions indicators in the perspective of residential consumption: Evidence from Beijing, China. Ecological Indicators, 6: (1) 634-645.
38. Park H, Heo E (2007) the direct and indirect household energy requirements in the Republic of Korea from 1980 to 2000 – an input–output analysis. Energy Policy, 3: (5) 2839–2851.
39. Reinders AHME, Vringer K, Blok K, (2003) The direct and indirect energy requirement of households in the European Union. Energy Policy, 3: (1) 139–153.
40. Yuan B, Ren S, Chen X (2015) the effects of urbanization, consumption ratio and consumption structure on residential indirect CO2 emissions in
China: a regional comparative analysis. Applied Energy, 1: (40) 94–106.
41. Chen S, Chen B (2015) urban energy consumption: Different insights from energy flow analysis, input– output analysis and ecological network analysis. Applied Energy, 13: (8) 99-107.
42. Fan F, Lei Y (2016) decomposition analysis of energy-related carbon emissions from the transportation sector in Beijing. Transportation Research Part D: Transport and Environment, 4: (2) 135-145.
43. Leontief W, Ford D (1972) Air pollution and the economic structure: empirical results of input-output computations. In: Brody, A, Carter, A (Eds.), Input-Output Techniques, (North-Holland Publ. Company. 44. Munksgaard J, Pedersen KA Wier M (2000) Impact of
household consumption on CO2 emissions. Energy
Economics, 2: (2) 423-440.
45. Cruz LMG (2002) Energy-Environment-Economy Interactions: An input output approach applied to the Portuguese case. A paper presented for the 7th Biennial Conference of the International Society for Ecological Economics on, Environment and Development: Globalization & the Challenges for Local & International Governance, Sousse, Tunisia, 2002.
46. Kim JH (2002) Changes in consumption patterns and environmental degradation in Korea. Structural Change and Economic Dynamics, 1: (3), 1-48.
47. Final demand (2010).