Volume 8 (2008)
Proceedings of the
Third International ERCIM Symposium on
Software Evolution
(Software Evolution 2007)
On the Resilience of Classes to Change
Rajesh Vasa, Jean-Guy Schneider, Oscar Nierstrasz and Clinton Woodward
11 pages
Guest Editors: Tom Mens, Ellen Van Paesschen, Kim Mens, Maja D’Hondt Managing Editors: Tiziana Margaria, Julia Padberg, Gabriele Taentzer
On the Resilience of Classes to Change
Rajesh Vasa1, Jean-Guy Schneider1, Oscar Nierstrasz2and Clinton Woodward1
1Faculty of Information & Communication Technologies
Swinburne University of Technology P.O. Box 218, Hawthorn, VIC 3122, AUSTRALIA
[email protected],[email protected], [email protected]
2Institute of Computer Science
University of Bern
Bern, CH-3012, SWITZERLAND
Abstract: Software systems evolve over time incrementally and sections of code are modified. But, how much does code really change? Lehman’s laws suggest that software must be continuously adapted to be useful. We have studied the evolution of several public domain object-oriented software systems and analyzed the rate as well as the amount of change that individual classes undergo as they evolve. Our observations suggest that although classes are modified, the majority of changes are minor and only a small proportion of classes undergo significant modification.
Keywords:Open-source, change, metrics.
1
Introduction
It is a well-established fact that software systems change and become more complex over time as they are used in practice [LB85]. However, it is less well-understood how change and complexity are distributed over time, and there has been little research conducted into understanding how change is distributed over the parts of object-oriented software systems.
In previous work, we have studied typical growth and change patterns in open-source, object-oriented software systems and shown that although software grows and changes over time, the structure and scope of both growth and change is, in general, predictable rather than erratic or purely random [VSWC05,VLS07,VSN07]. This leads us to ask whether we can gain a more detailed insight into where change occurs, and the degree to which change can be expected.
Not only do we need a suitable distance measure to indicate how much a class or component changes, but we should also collect information about change both at a fine-grained level to gain insights into change of individual artefacts, and at a coarse-grain to gain insight into system-level change. This will then allow us to address questions such as:
• What proportion of a release contains code that has never been touched since creation?
• What is the probability that a class is modified after it is created?
• Does a class or component tend to change a lot or are most modifications minor adjust-ments?
Continuing our previous work, we have analyzed a number of open source applications that have evolved over at least 18 releases during a period of at least 28 months. For each of these ap-plications we have collected information on the amount of change individual classes go through as they evolve over time. The key results of our studies show that:
1. Most classes will be modified at least once during their lifetime, but a substantial propor-tion of classes stay unchanged during their entire history.
2. Of the classes that are modified, the probability that a class is modified multiple times is quite low.
3. The amount of change that most classes undergo is also minimal. However, a small pro-portion of classes is modified significantly.
The rest of this paper is organized as follows: in Section 2 we provide an overview of our experimental method, and we justify the selection of the case studies. Section3 presents the results of our studies. In Section 4 we suggest possible interpretations and consequences of our observations, followed by a discussion of some limitations of our approach in Section5. Section6provides a brief overview of related work. We conclude in Section7with some remarks about future work.
2
Experimental method
In this section, we briefly present the systems studied. Next, we describe the means by which measurements are performed, followed by a discussion about the measures that we collected. Finally, we illustrate the approach used to detect clones and measure change.
2.1 Input data set selection
As in our previous work [VSWC05, VLS07, VSN07], we have restricted our study to open-source software developed using the Java programming language. The main reasons for selecting open source software are their availability, access to change logs (e.g., such as developer release notes), as well as licensing practices that allow access to both source and object code. The choice of the systems using the Java programming language was influenced by its use in a variety of application domains, as well as by the availability of a suitable infrastructure to implement the necessary metrics tool.
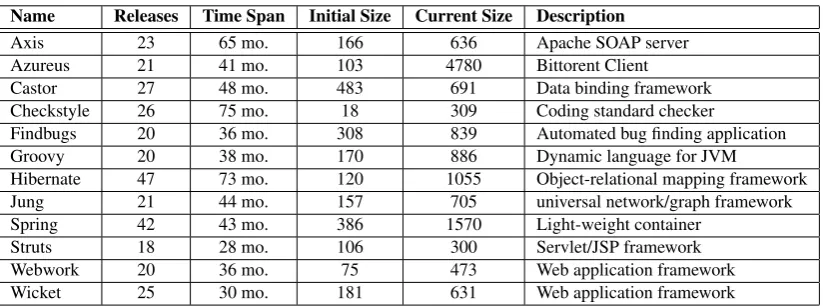
Name Releases Time Span Initial Size Current Size Description
Axis 23 65 mo. 166 636 Apache SOAP server
Azureus 21 41 mo. 103 4780 Bittorent Client
Castor 27 48 mo. 483 691 Data binding framework
Checkstyle 26 75 mo. 18 309 Coding standard checker
Findbugs 20 36 mo. 308 839 Automated bug finding application
Groovy 20 38 mo. 170 886 Dynamic language for JVM
Hibernate 47 73 mo. 120 1055 Object-relational mapping framework
Jung 21 44 mo. 157 705 universal network/graph framework
Spring 42 43 mo. 386 1570 Light-weight container
Struts 18 28 mo. 106 300 Servlet/JSP framework
Webwork 20 36 mo. 75 473 Web application framework
Wicket 25 30 mo. 181 631 Web application framework
Table 1: Systems under analysis for this study with size being the number of classes and inter-faces.
2.2 Extracting Measures
In order to perform the analysis, we developed a metrics extraction tool [VSWC05], which analyzes Java Bytecode and extracts data to capture the degree of change of a system with respect to its size and complexity. Java Bytecode generally reveals almost as much about a system as its source code, and only some subtle changes to a software system cannot be detected using this approach (e.g., use of local variables).
Our metrics extraction tool takes as input thecore JAR filesfor each release of a system, and extracts metrics by processing the raw Java Bytecode. This approach allows us to avoid running a potentially complexbuild processfor each release, and limits analysis to “code” that has been correctly compiled as the developers intended. For each class1 in a system under analysis, we extract simple measures such as the number of methods, fields, branches as well as the set of classes that this class depends upon, either as direct client or direct subclass. Type dependency graph analysis [VCS02] can then be used to compute other measures such as Fan-In [VSN07].
2.3 Software measures
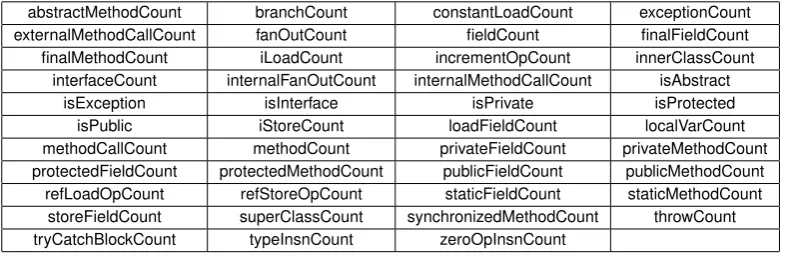
Using the metrics extraction tool, we have extracted 43 different count measures for each class in each system analyzed. The names we have given to these measures are listed in Table2and include, amongst others, Fan-Out and Branch Count (i.e., the number ofbranchinstructions in the Java Bytecode), Load Instruction Count (i.e., the number ofload instructions), and Store Instruction Count (i.e., the number ofstoreinstructions).
A detailed discussion of all these measures is beyond the scope of this work. However, they naturally align with the most common instructions of the Java Bytecode as well as covering some basic structural relationships.
Furthermore, to support a more detailed comparison, we store the name of each class, its superclass name, all method names (including full signatures), field names and the name of all
1 To improve readability we will refer to “classes” when we mean “classes or interfaces”. We will only refer to
abstractMethodCount branchCount constantLoadCount exceptionCount externalMethodCallCount fanOutCount fieldCount finalFieldCount finalMethodCount iLoadCount incrementOpCount innerClassCount
interfaceCount internalFanOutCount internalMethodCallCount isAbstract
isException isInterface isPrivate isProtected
isPublic iStoreCount loadFieldCount localVarCount
methodCallCount methodCount privateFieldCount privateMethodCount protectedFieldCount protectedMethodCount publicFieldCount publicMethodCount refLoadOpCount refStoreOpCount staticFieldCount staticMethodCount
storeFieldCount superClassCount synchronizedMethodCount throwCount tryCatchBlockCount typeInsnCount zeroOpInsnCount
Table 2: Java Bytecode measures extracted for analysis.
other classes that a class depends upon. This information is then used in our clone detection method discussed in the next section.
2.4 Detecting clones and measuring change
In order to perform our analysis, in particular to detect clones and measure changes between versions of a given system, we consider the following information for each class under analysis: (i) the fully qualified class name, including its class modifier (i.e., public, private, protected, interface, final or abstract) (ii) the name of its direct super class, (iii) the name, types and class modifier(s) of all fields, (iv) the name, signature and class modifier(s) of all methods, and (v) the set of classes this class depends upon. Additionally, we extract all 43 class level measures for each version of a class under investigation.
For our analysis, we consider two classes to be clonesof each other (we treat them as being identical) ifall metrics for each class are identical (i.e., all 43 measures have the same value, same class name with the same modifiers etc.). Furthermore, thedistancebetween two classes is defined as thenumber of measures(out of the 43) that differ (i.e., if two of the 43 measures differ between two classes, then they have a distance of 2). Note that even if two classes have a distance of 0, they may not be identical (e.g., the name of a field is modified). However, our analysis has revealed that this is only rarely the case and over all 310 versions we analyzed, at most 4% of modified classes have a distance of 0. Finally, we consider thehistory of a system as the set of versions, ordered by RSN, whereas aversionis the set of all classes contained in a particular release.
We compare thefinalversion of each system with all previous versions (i.e., over the entire evolutionary history) in order to compute the following information:
• Theproportionof classes in the final version that remain unchanged since creation as well as the proportion that are modified after being created.
• Thenumber of timesa class has been modified since its creation.
The information gathered from the first point gives us an overall picture of the number of classes that stay unchanged over their lifetime. The last point indicates if changes are substantial, and can provide an indication of the distribution of small and large changes.
3
Observations
We now summarize our observations from analyzing the 12 systems listed in Table1. First, we analyze the percentage of classes that have not changed since being added into the respective system. We then consider the set of modified classes and analyze the number of times they have been modified. Finally, we illustrate how much modified classes change over time.
3.1 Probability of change
At a class level, systems evolve by addition of new classes, modification of existing classes or removal of classes. Hence, given an evolutionary history, for any given version we can identify three types of classes: new classes, classes that have been modified at some point in their life, and classes that have not changed since their creation.
In our analysis, we use thelastrelease of a given system as the base-line for comparison. We consider a class as being unchanged if it is a clone of its first release,i.e., the release in which it was first defined. Any potential changes in between are not analyzed in our approach. Similarly, we consider a class as having changed (at least once) if it is not identical to its first release. A class is considered to be new if it did not appear in any release before the last one.
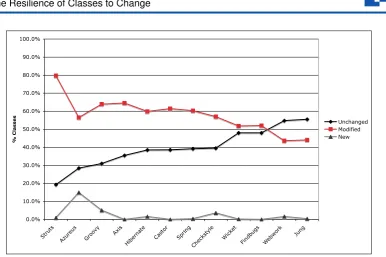
The results of our analysis are illustrated in Figure 1. Except for Webwork and Jung, the percentage of unchanged classes is lower than the percentage of modified classes. However, it is interesting to see that the percentage of unchanged classes ranges between 20% and 55%, depending on the system. The lower end of the range indicates that in general there is a certain proportion of classes that are never touched and the average, which is closer to 40%, suggests that there is a certain inherent resistance to change in many of the classes once they have been added. Also, our analysis shows that the number of new classes introduced in the last release is small and generally tends to be under 5%.
3.2 Rate of modification
As noted in the previous section, only a small proportion of all classes undergoes some change. However,how oftenare these classes modified? What does the distribution of this modification look like?
Again, we use the last release as our base-line and only report on classes that are part of this release – any classes that have been removed before then are not considered. From our previous work [VSN07] we know that only about 2% to 5% of classes fall into this category.
0.0% 10.0% 20.0% 30.0% 40.0% 50.0% 60.0% 70.0% 80.0% 90.0% 100.0%
Struts
Azureus Groo
vy Axis
Hibernate Castor SpringCheckst
yle Wick
et
Findbugs Webwork
Jung
% Classes
Unchanged Modified New
Figure 1: Proportion of new, unchanged, and modified classes using final version as base-line.
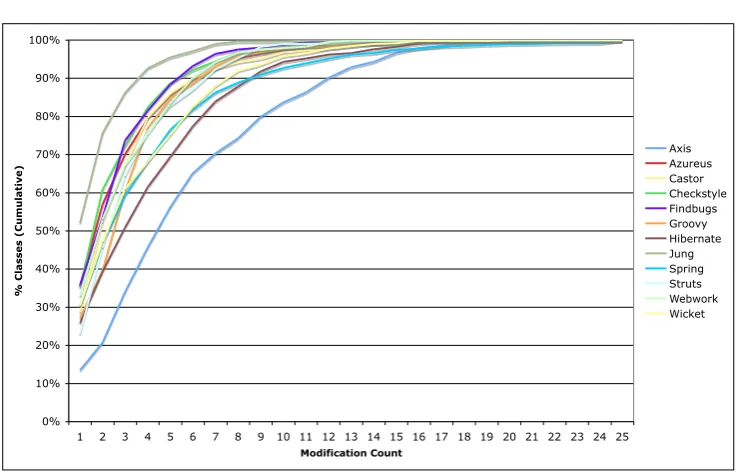
Jung show up as minor outliers. On average, 5% or less of all modified classes are changed more than 8 times in their life cycle. This suggests that the probability that a class is modifiedmultiple times is quite low and that this probability reduces non-linearly, as is shown in Figure2. Please note that only 0.01% of classes were modified more than 25 times.
3.3 Distribution of the amount of change
As software evolves, we have observed that there is a proportion of code that changes, but the number of modifications is in most cases minimal. But how much change does happen,i.e., how many measures do actually change? Is there a typical profile for most systems, like the one we observe in the modification frequency?
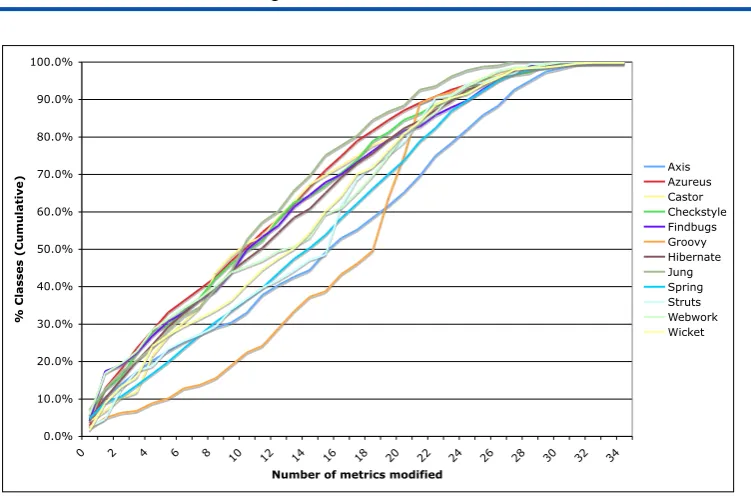
In order to detect the amount of change, we focus on the classes in the final version that have been modified at least once in their life cycle. We then compute the number of measures (out of the 43 possible) that have changed between the version the class was first defined and the final version. This high-level approach allows us to see if there is a common profile across the various systems, but does not indicate how big the changes in each of the 43 measures are. Our observations for all systems under analysis are shown in Figure3.
The reader may first notice that a few classes do not indicate a change in any of the measures at all. This is possible since the clone detection technique that we apply also takes into consid-eration method signatures, field names etc. (cf.Section2.4). However, there is a probability that some other measure that we do not collect has changed in such a situation. On average, in our data less than 4% of the classes fall into this category.
0% 10% 20% 30% 40% 50% 60% 70% 80% 90% 100%
1 2 3 4 5 6 7 8 9 10 11 12 13 14 15 16 17 18 19 20 21 22 23 24 25 Modification Count
% Classes (Cumulative)
Axis Azureus Castor Checkstyle Findbugs Groovy Hibernate Jung Spring Struts Webwork Wicket
Figure 2: Cumulative distribution of the modification frequency of classes that have undergone a change in their lifetime.
of the classes across multiple systems and only 10% of the modified classes have more than 23 measures modified. The cumulative growth for the remaining 10% is not linear any more and needs further analysis.
The reader may note that as some of the measures are closely related (e.g., a store instruction is generally aligned with at least one load instruction), it can be expected that they change in a similar way. Early analysis indeed suggests that the number of load instructions and the number of store instructions have a very close relationship. However, further analysis is required to clarify the correlation between the various measures.
4
Interpretation
Probability of change: In all of the systems that we have studied, a good proportion of classes remained unchanged. This indicates that some abstractions tend to stay very stable after they are created. The range of values for different systems suggests that this stability depends on the domain and possibly the development approach as well as the architectural style that the team has adopted early in their life cycle.
0.0% 10.0% 20.0% 30.0% 40.0% 50.0% 60.0% 70.0% 80.0% 90.0% 100.0%
0 2 4 6 8 10 12 14 16 18 20 22 24 26 28 30 32 34 Number of metrics modified
% Classes (Cumulative)
Axis Azureus Castor Checkstyle Findbugs Groovy Hibernate Jung Spring Struts Webwork Wicket
Figure 3: Number of measures that change for modified classes.
Distribution of the modifications: Modifications are unavoidable as systems evolve. How-ever, very few of the classes tend to experience a high level of modification (as computed by the number of measures that change). Although our approach does not reveal the actual amount of code changed, it provides us a broad indicator which may serve as a starting point for further analysis.
5
Limitations
In order to place our study in context, we highlight some of the known limitations of our approach in addition to our findings.
The clone detection method used in this work may pick up false positives since there may be changes to a class that our 43 metrics are unable to detect. We intend to improve this by adding further metrics and additional aspects like the method calls and the call sequence. Furthermore, our distance measure compares the initial version of a class to the final version. This may miss edits where a class is modified and returned back to its original shape, as seen by the metrics. This limitation can be addressed by looking at distance incrementally. As a consequence, the analysis approach would have to be adjusted to take into consideration the way the metric information is being collected.
Our method of computing modification misses classes that have been renamed; they will be considered as a deletion and an addition. This is a weakness that we are addressing in future work by improving clone detection to accept a certain level of name changes (e.g., package name change).
lim-its the ability to interpret our findings in other languages, since every language tends to promote a certain culture and a different language may have a different outcome. Furthermore, com-mercially developed software systems, or systems that are substantially larger than those in our investigation, may reveal different patterns of stability and maintenance profiles.
6
Related work
Kemerer and Slaughter have studied the profile of software maintenance in five business systems at the granularity of modules. They conclude that very few modules change frequently, and those that do are considered to be strategic [KS97]. Gˆırba has noted that classes that have changed in the past are also those most likely to change in the future, but these classes are in the minority [Gir05].
A number of researchers have studied methods of detecting existence of a class in previous ver-sions (i.e., a clone) using a range of different techniques from string matching [?,Joh94,RD03], abstract syntax trees [BYM+98] and metrics-based fingerprinting [ACCD00,KDM+96]. In our study we detect clones by combining metrics as well as string matching. We collect string in-formation to the extent possible by bytecode analysis (for example, method signatures and de-pendent type names). Although definitions and methods to detect clones have been provided, a comprehensive study with an intention of understanding change and stability using clone detec-tion has not previously been done.
Origin analysis [ZG05] uses a semantic perspective of the context and usage of code in order to determine where, why and how changes have occurred. The technique also makes use of version control log data to determine the true origin of code components and changes. Their technique is in contrast to metrics-based methods, such as our own and those proposed by Demeyeret al. [DDN00] designed to identify specific components rather than origins.
Barryet al. [BKS03] describe software volatility as a concept with 3 dimensions: amplitude (size of change),periodicity(frequency of change) anddeviation(consistency of change). Using a phase sequence analysis approach, they detected a distinct set of volatility patterns. Their data set involved studying maintenance activity log from 23 different systems. In our approach, we have focused on information that can be collected automatically rather than by parsing log files.
7
Conclusions and Future Work
In this paper, we have investigated where change occurs within 12 open-source Java systems that have evolved over a period of at least 2 years at the granularity of classes through bytecode analysis.
Our work leads us to ask the following questions as possible future work: is there an inherent profile for classes that tend to change significantly? Are there any factors that correlate with classes becoming stable? When changes are made, are large modifications made in a single version or do they tend to make these over multiple versions? When a class is modified a few times, are the changes minor? Is there any strong correlation that suggests that either size or complexity play a role in the tendency for a class to be modified? Can one characterize the nature of frequently occurring changes?
Acknowledgements: The authors would like to thank Orla Greevy for her comments on a draft of this paper. Oscar Nierstrasz gratefully acknowledges the financial support of the Swiss National Science Foundation for the project “Analyzing, capturing and taming software change” (SNF Project No. 200020-113342, Oct. 2006 - Sept. 2008).
Bibliography
[ACCD00] G. Antoniol, G. Canfora, G. Casazza, A. De Lucia. Information Retrieval Models for Recovering Traceability Links between Code and Documentation. InProceedings of the International Conference on Software Maintenance (ICSM 2000). Pp. 40–49. 2000.
doi:10.1109/ICSM.2000.883003
[BKS03] E. J. Barry, C. F. Kemerer, S. A. Slaughter. On the Uniformity of Software Evolution Patterns.icse00:106–113, 2003.
doi:10.1109/ICSE.2003.1201192
[BYM+98] I. Baxter, A. Yahin, L. Moura, M. S. Anna, L. Bier. Clone Detection Using Abstract Syntax Trees. InProceedings of the International Conference on Software Mainte-nance (ICSM 1998). Pp. 368–377. IEEE Computer Society, Washington, DC, USA, 1998.
doi:10.1109/ICSM.1998.738528
[CL66] D. Cox, P. Lewis. The Statistical Analysis of Series of Events. In Monographs on Applied Probability and Statistics. Chapman and Hall, 1966.
[DDN00] S. Demeyer, S. Ducasse, O. Nierstrasz. Finding Refactorings via Change Metrics. InProceedings of 15th International Conference on Object-Oriented Programming, Systems, Languages, and Applications (OOPSLA ’00). Pp. 166–178. ACM Press, New York NY, 2000. Also appeared in ACM SIGPLAN Notices 35 (10).
doi:10.1145/353171.353183
[Gir05] T. Gˆırba.Modeling History to Understand Software Evolution. PhD thesis, Univer-sity of Berne, Berne, Nov. 2005.
Pp. 120–126. 1994.
doi:10.1109/ICSM.1994.336783
[KDM+96] K. Kontogiannis, R. DeMori, E. Merlo, M. Galler, M. Bernstein. Pattern Matching for Clone and Concept Detection.Journal of Automated Software Engineering3:77– 108, 1996.
doi:10.1007/BF00126960
[KS97] C. F. Kemerer, S. A. Slaughter. Determinants of Software Maintenance Profiles: An Empirical Investigation.Software Maintenance: Research and Practice 9(4):235– 251, 1997.
[LB85] M. Lehman, L. Belady.Program Evolution: Processes of Software Change. London Academic Press, London, 1985.
[RD03] F. V. Rysselberghe, S. Demeyer. Reconstruction of Successful Software Evolution Using Clone Detection. InProc. of International Workshop on Principles of Software Evolution (IWPSE). Pp. 126–130. 2003.
[VCS02] S. Valverde, R. F. Cancho, R. Sole. Scale-free networks from optimal design. Euro-physics Letters60(4):512–517, 2002.
[VLS07] R. Vasa, M. Lumpe, J.-G. Schneider. Patterns of Component Evolution. In Lumpe and Vanderperren (eds.), Proceedings of the 6th International Symposium on Soft-ware Composition (SC 2007). Pp. 244–260. Springer, Braga, Portugal, Mar. 2007.
[VSN07] R. Vasa, J.-G. Schneider, O. Nierstrasz. The Inevitable Stability of Software Change. In Proceedings of 23rd IEEE International Conference on Software Maintenance (ICSM ’07). IEEE Computer Society, Los Alamitos CA, 2007. To appear.
[VSWC05] R. Vasa, J.-G. Schneider, C. Woodward, A. Cain. Detecting Structural Changes in Object-Oriented Software Systems. In Verner and Travassos (eds.),Proceedings of 4th International Symposium on Empirical Software Engineering (ISESE ’05). Pp. 463–470. IEEE Computer Society Press, Noosa Heads, Australia, Nov. 2005.
doi:10.1109/ISESE.2005.1541855
[ZG05] L. Zou, M. Godfrey. Using Origin Analysis to Detect Merging and Splitting of Source Code Entities.IEEE Transactions on Software Engineering31(2):166–181, 2005.