ANALYSIS OF THE CORRELATIONS BETWEEN NO, NO
2AND
O
3CONCENTRATIONS IN CAMPO GRANDE – MS, BRAZIL
Amaury de Souza,
[a]Flavio Aristone,
[a]Ujjwal Kumar,
[b]E. Kovač -Andrić
[c]Milica Arsić
[d]Priscilla Ikefuti
[e]and Ismail Sabbah
[f]Keywords: Ozone; Nitrogen dioxide; NOx; Oxidant; Regional Pollution; Local pollution; Nitrous acid; Network monitoring.
Ozone (O3) is a secondary gaseous pollutant in the urban environment, and its variation correlates well with nitrogen oxides (NOx = NO +
NO2). Continuous monitoring has been done in the Campo Grande city urban area, using ozone 49C and NO-NO2-NOx 42CTL gas
analyzers. The results show that the maximum concentrations of O3 and oxidant (Ox = O3 + NO2) in Campo Grande often appear in the
early afternoon around 15:00 hours. The daily variation of NO concentrations shows a very clear cycle with two peaks, one appearing around 07:00 a.m. and the other at 11:00 p.m. At the lowest level, NO2 is the main component of NOx, while NO dominates the higher
mixing ratio. It is also shown that the level of Ox is composed of two factors: the regional and the local contributions. The former is affected
by the regional O3 level, while the latter is effectively correlated with the primary pollution level. The daily variation also appears in the
concentrations of oxidant components.
* Corresponding Authors
E-Mail: [email protected]
[a] Author Address line 11 Federal University of Mato Grosso do
Sul, C.P. 549, 79070-900 Campo Grande, MS – Brazil [b] SENR - School of Environment & Natural Resource, Doon
University, Dehradun, India
[c] University of Osijek, Osijek Department of Chemistry Croatia
[d] University of Belgrade, Technical faculty in Bor, Serbia [e] Federal University of South Border, campus Erechim,
Geography Department, Brazil.
[f] Department of Natural Sciences College of Health Sciences, Kuwait
INTRODUCTION
One of the main problems caused by air pollution in urban areas is the presence of photochemical oxidizers. Among these, ozone (O3) and nitrogen dioxide (NO2) are
particularly important since they are susceptible of provoking adverse effects on human health (OMS, 2000). The formation of ozone at ground level depends on the intensity of the solar radiation, the absolute concentration of NOx and the VOCs (Volatile Organic Compounds), and the
ratio between NOx and VOCs.
Various observations have shown that, in shiny days, the ozone concentration increases with the growing intensities of solar radiation and temperature. The concentration of photochemical oxidizers may be reduced throughout the control of theirs precursors, which are nitrogen oxides NOx (NO and NO2) and VOCs.2-4 It is necessary, hence, to
search for a complete comprehension of the relationships involving concentrations of O3, NO and NO2 under different
atmospheric conditions. Different authors, 5-7 studied the
relationship between the environmental levels of O3, NO
and NO2 to improve the comprehension of their chemical
coupling.
There is not an official network for air quality monitoring installed in the city of Campo Grande. Nonetheless, some studies and campaigns of weather and climate monitoring
have been systematically realized by different researchers, 8-12 Furthermore, modeling of urban atmospheric dispersion
has been applied to exploit results of Campo Grande climate effects. 13-14 It has been developed, recently, the first version
of a CO and NOx inventory of emissions. 8
In the present study, the values of environmental concentration of O3, NO, NO2 and NOx, continually
measured in the city of Campo Grande, are used to investigate, for the first time for this town, the concentration of oxidizers (Ox, O3 and NO2) along with NOx. This analysis
shall contribute to a better understanding of atmospheric sources of Ox for this specific urban area. The relationships
that were found to describe the concentrations of O3, NO
and NO2 are in agreement with the current knowledge of
their chemical coupling.
MATERIALS AND METHODS
Studied and observational data
activities, to the presence of dumping grounds, to the use of small power generators running on oil to supply the lack of electric grid power, and to the induced fire outbreak used to clean up local terrains.
Ensemble of observational data
The air quality and meteorological variables are monitored by an automatic station operated by the Institute of Physics of the Federal University of South Mato Grosso (UFMS). This station is located on the University campus, 8 km or 5 miles to the west of downtown. The main sources of pollution in that area are the building activities; therefore, there are no significant precursor sources of ozone identified close to the region. The ozone levels of Campo Grande area are stored in a regular database since 2004. The equipment of measurement was installed at the top of a tower from where air samples are extracted throughout vertical pipes that are placed approximately 2 meters above the ground level. The concentrations values for O3, NOx, NO and NO2,
the ultraviolet (UV) radiation and other meteorological features, such as the air temperature, relative humidity, wind speed and direction are values measured systematically.
The concentrations of pollutants NO, NO2, NOx
(NO+NO2) and O3, were measured continuously during a
one–year period (2015). The equipments used for measurements included a nitrogen oxide analyzer (AC31M– using chemiluminescence method), an ozone analyzer (O341M–LCD/UV Photometry). All equipments were made by Environnement S.A.
RESULTS AND DISCUSSIONS
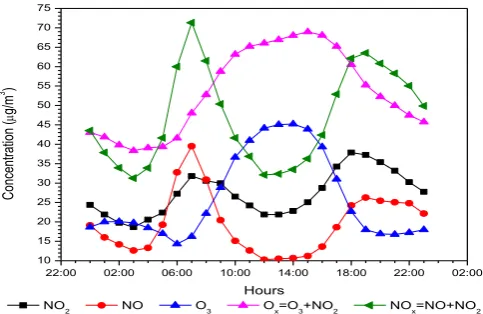
Hourly variation of O3, NO, NO2, and NOx concentrations The average per day variation observed for the NO, NO2,
NOx and O3 concentrations are exhibited in figure 1. The
daily cycle of ozone concentration reaches a peak during the middle day and presents smaller concentrations during the night. The ozone concentration slowly increases after the first rays of sun shining, getting to its maximum value during the daylight period, after which it starts to decrease slowly until the next morning.
The variation pattern of the average concentration of gases was well defined during the analyzed period, and the pronounced peak of the concentration of NO in the first hour of the morning was due to photolysis of the nocturnal NO2
accumulated after sunset (NO + O3→ NO2 + O2), both for
NO and O3 values are minimal at this time (Figure 01). After
sunset, a concentration of NO increases slowly. This occurred because of the variation of the emission of NO due to the change of temperature and humidity16. Other
mechanisms of heterogeneous reactions during day and night may be important, although few known, such as the influence of humidity, temperature and precipitation17. The
NO2 (Figure 1) clearly shows that not only the lowest
concentration values occur around midday, but also the lower variability in this time, which can be explained by Figure 02, where they have a mean daily value higher global solar radiation and NO photolysis, which reaches maximum values and lower zenith angle. This causes a greater
penetration of the solar rays (<400 nm), responsible for the photolysis of the NO2, since, due to the strong UV radiation,
has high photochemical activity, in addition, there is the later oxidation of NO2 by part of the hydroxyl radical (OH)
(NO2 + OH → HNO3), which is the main mechanism of
NOx loss18.
The levels of NO2 observed in the atmosphere showed a
general tendency in which they tend to decrease in the period of the day of greatest insolation and to grow at the end of the day (Figure 1). This fact suggests that the photochemical processes are the main mechanisms to remove NO2 from the atmosphere with formation of
by-products. The model that best explains this fact is the consumption of NO2 by direct photochemical reactions
generating ozone. The formed O3 reacts with water vapor and generates HO radicals, this radical is the main chemical species involved in the NO2 consumption, with the
production of HNO3, the reaction of formation of nitric acid
is significant in the region under study, mainly due to the conditions Favorable conditions of insolation during a large part of the year, the presence of oxidants in the atmosphere is determinant for the formation of NO2 in the atmosphere,
from the NO emitted by the combustion processes. The production of NO2 occurs mainly by the reaction of NO with
O3 19-20.
Figure 1. Average of measured values for a daily period of NO, NO2, NOx, O3 and Ox concentrations. The interval between
measurements equals 1 hour.
Figure 2. Average concentrations of O3 and UV irradiance for the studied period.
22:00 02:00 06:00 10:00 14:00 18:00 22:00 02:00 10 15 20 25 30 35 40 45 50 55 60 65 70 75 Co nce nt ra tio n ( g/ m 3 ) Hours
NO2 NO O3 Ox=O3+NO2 NOx=NO+NO2
0 100 200 300 400 500 600 700 800
0 2 4 6 8 10 12 14 16 18 20 22 24
Such a variation is due mainly to the photochemical formation and meteorological conditions. The effect of the increasing solar radiation that occurs between 08:00 and 14:00 / 15:00, along with the height of the mixture layer entails the reduction of NOx concentration and a raising in
the concentration of O3. The simultaneous measurement of
O3 and UV during the daylight period (from 07:00 to 19:00,
see Figure 2) shows that the concentration of O3 is strongly
correlated to the UV irradiance (W/m²). The daily cycles of O3 and UV flux are similar, with the maximum O3 occurring
at 14:00, i.e., approximately 1 or 2 hours after the maximum UV flux. The statistical analysis reveals that the correlation between O3 concentration and UV is significant with a
correlation coefficient (R) of 0.79.
While O3 and a large percentage of NO2 are secondary
contaminants, NO is a primary contaminant, formed through a complex set of chemical reactions. At 07:00, the sun light begins to induce a series of photochemical reactions. NO is converted in NO2 through a reaction with O3. During the
shining hours, NO2 has converted again into NO because of
photolysis, which induces the regeneration of O3.
Another factor influencing the atmospheric pollutant concentrations is the height of the mixture layer over the city. In a shiny day, pollutants are diluted when the mixture layer increases during the day and stays limited to the inside of NPBL during the night. Emitted pollutants, like NO, are kept underneath such an inversion, and it can cause an increase of the hourly average concentration of NOx
overnight.
Chemistry of O3, NO and NO2
The basic chemistry that leads to the production and destruction of ozone has been detailed elsewhere. 26
NO2 + h → NO + O (1)
O + O2 → O3 + M (2)
O3+ NO → NO2+ O2 (3)
where
M represents a molecule absorbing the excess of vibrational energy and thus stabilizing the O3 molecule
that has been formed, normally it is N2 or O2;
h represents the photon energy, with a 424 nm wavelength; and
O is an active monoatomic molecule of oxygen.
These equations form a cycle free of liquid chemistry, i.e., the global effect of reaction (2) is the opposite of reaction (1). Such reactions represent, therefore, a closed system for which the components NOx (NO and NO2) and Ox (O3 and
O2) are referred separately. Along the daytime,
concentrations of NO, NO2 and O3 remain typically
balanced during a period of a few minutes. Such a situation
is known as a photocatalytic state. The concentrations of NO, NO2 and O3 are related through the following equation:
where
t2 is the NO2 photolysis rate, and
k1 is the coefficient of reaction between NO and O3.
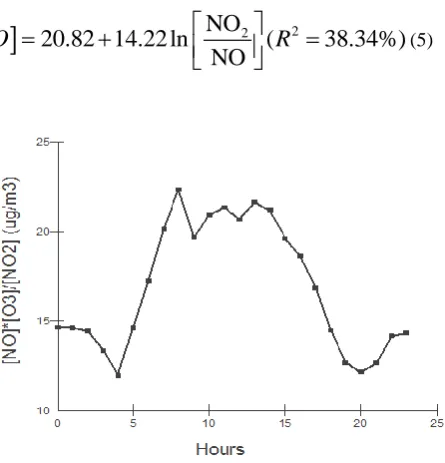
The variation of t2/k1 average value along the time was
obtained using the observed measurements of NO, NO2 and
O3 is exhibited in Figure 3. The average value of t2/k1 is
16.9, with a minimum of 11.9 and maximum of 22.4 g m-³.
The maximum value occurs typically at 08:00 hours.
The k1 coefficient varies as a function of temperature (T).
Sienfeld and Pandis,27 proposed the following equation for
k1:
(4)
As expected, the variation of k1 is similar to the variation
of the average air temperature.
Figure 4 presents the variation of daily concentration of O3 as a function of the ratio [NO2]/[NO], sampled hourly.
The level of O3 increases with the raise of [NO2]/[NO].
According to Figure 4, the concentration of O3 increases
rapidly for small values of [NO2]/[NO]. For levels that are
more elevated, the concentration of O3 gets close to reach a
photocatalytic state, when it remains relatively stable. In our study, we adjust these data to a polynomial function of ln([NO2]/[NO]) that can be used to predict the concentration
of O3 during the day:
(5)
Figure 3. Daily variation of t2/k1 (g m-3) average values
31
1430
1/ (
min)
3.23 10 exp
k
ppm
T
20.82 14.22 ln
NO
2(
238.34%)
NO
O
R
2
3 22NO O
t
Figure 4. Variation of O3 as a function of the [NO2]/[NO] ratio.
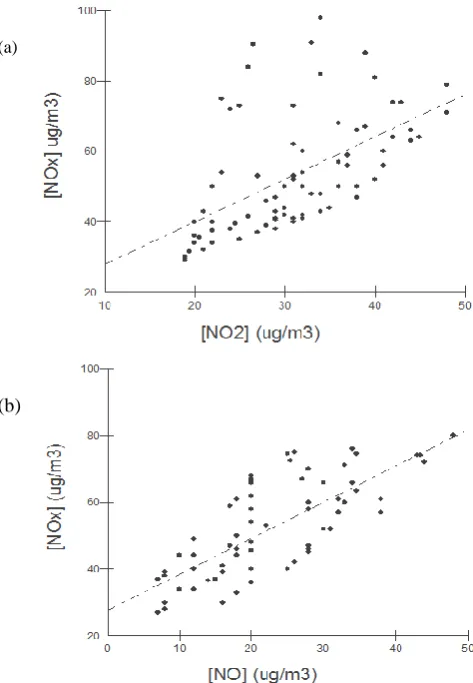
The comparison between the average concentrations of NO and O3 is exposed in Figure 5; the measurements have
been taken at one-hour intervals. Three periods have been used for purpose of comparison: the whole day: Y =71.25-15.93ln[NO]; R2=36.8 %. Daylight (from 06:00 to 18:00):
Y=107.98-25.10ln[NO]; R2=67.96 % and nighttime shift
(from 18:00 to 06:00):Y=75.40-18.20ln[NO]; R2=33.26 %.
(a)
(b)
(c)
Figure 5. Variation of average values of O3 plotted along with NO.
(a) for the entire day; (b) for the daytime; (c) for the nighttime.
The average concentration of O3 decreases when the
concentration of NO increases. Comparing the values of average concentrations of NO2, NOx and O3, the following
characteristics can be observed:
✓ The average concentration (1 hour) of O3
decreases along with the increase of NOx, while
the levels of NO and NO2 increase with NOx;
✓ The largest concentrations of NO2, NO and O3
observed during the day are 48, 64 and 58.8 g m-³, respectively;
✓ The largest concentrations of NO2, NO and O3
observed during the night are 49.50, 48 and 39
g m-³, respectively;
✓ The numbers presented on items b) and c) below confirm that the larger daily average concentrations (1 hour) of NO2 and O3 are higher
during the daylight period than those measured during the night time. However, the highest average (1 hour) concentrations of NO and NOx
observed during the full period considered for this study have occurred during the night time.
Diurnal variation of Ox
The difference between the diurnal and nocturnal Ox
behavior shall be expected if the photochemical processes have any influence on the Ox levels in polluted areas. Figure
6 shows the daily variation of the average concentration value of Ox taken at intervals of 1 hour. The concentration of
Ox, likewise the variation of O3 concentration, exhibits a
peak at noon and lower concentrations during the night. The concentration of Ox slowly increases after the sun rises,
attaining a maximum value during the day and, in the sequence, decreases until the next morning. This is due to the photochemical formation of O3. Figure 7 shows the daily
variation of NO2/Ox.
The differences on the partition of NO2 and O3 can be
Figure 6. Daily variation of Ox average values.
Figure 7. Daily variation of NO2/Ox average values.
Variation of NO2/Ox daily values with NOx
Figure 8 shows the adjusted expression of [NO2] / [OX] as a function of [NOx]: Y = 0.71 + 0.33 * ln [NOx]; with a correlation coefficient of R2 = 55.2%. The data show that, for lower values of
the relation [NO2] / [Ox] there are low NOx values, implying that, at these times, Ox concentrations are predominantly marked by high concentrations of O3. In addition, with increasing NOx
concentrations, a large part of the concentration is in the form of NO2. The high values of [NO2] / [OX] can also be explained by the
oxidation process of NO to NO2 with concentrations of NOx
marked mainly by NO2 concentration.
Correlation between concentrations of NO, NO2 with NOx Figure 9 exhibits both variation of NOx as a function of
NO and NO2 for the average data observed with the
sampling interval of 1 hour. The straight lines are, respectively: a) Y=18.54+1.14[NO2]; R2=28.44 %; b)
Y=28.93+1.07 [NO]; R2=70.176 %..
Figure 8. Daily variation of NO2/Ox average values as a function
of NOx level.
When our data were adjusted to a linear function, the obtained correlation was weak.
(a)
(b)
Figure 9. The average values of NOx plotted as a function of (a)
However, better results were obtained when the observed data are split into diurnal and nocturnal periods. In Figure 11 the observed data values for the diurnal period are exhibited and the respective relations obtained are: a)
Y=15.98+1.10[NO2]; R2=31 %], and b) Y=29.78+1.06[NO];
R2=79.1 %. In Figure 12, the measured data for the
nocturnal period are exhibited and the relations obtained are: a) Y=20.37+1.09[NO2]; R2=51.9 % and Y=27.73+1.08[NO];
R2=56.47. These results lead to the following conclusions:
during the daytime, the linear correlation between NOx and
NO2 is quite good, while for the nighttime the correlation
between concentrations of NOx and NO is very strong.
The variations of diurnal and nocturnal values of O3
concentrations as a function of NOx level are represented in
Figure 12. The total value of Ox raised with NOx, and the
data have been linearly adjusted. Due to the influence of photochemical reactions on the O3 formation, differences
between values and linearly adjusted equations of day and night have been found. It is noticeable that the total local Ox
has a contribution independent of NOx and another one that
is dependent. The first part is a regional contribution comparable to the regional level of O3, while the last term is
a local contribution effectively correlated to the level of primary pollution. It has been verified that the dependent local contribution of NOx to Ox during the night is 37%
lower than during the day.
(a)
(b)
Figure 10. The average values of NOx plotted as a function of (a)
NO2 and (b) NO for the daytime period.
(a)
(b)
Figure 11. The average values of NOx plotted as a function of (a) NO2 and (b) NO for the nighttime period.
Local and regional contributions to the oxidant
However, the approximately 75 g m-3 regional
contribution is almost equivalent during the day and night. The regional contribution to O3is consistent with the values
observed by. 5, 7 This result implies that the problem of air
quality in Campo Grande is not just a local question, especially the street pollution, but also a regional issue of Campo Grande County. The territorial aspect observed for the analysis of O3 pollution is consistent with the results
reported by. 5, 24
Figure 12. Variation of daily average NOx concentration plotted as
a function of Ox.
20 30 40 50 60 70 80 90 100 110 20
30 40 50 60 70 80 90 100 110 120 130 140 150
Data
y = 0,3242.x + 66,52
NO
x
(
g/
m
3)
Ox (g/m
3
)
CONCLUSION
The present results indicate that the diurnal cycle of ozone concentration has a peak around noon and smaller nocturnal concentrations. The ozone concentration slowly increases after the sun rising, reaching a maximum value during the daytime and, in the sequence, decreases until the next morning. This is due to the photochemical formation of O3.
The shape and amplitude of ozone cycles are strongly influenced by meteorological conditions (solar radiation) and by the prevailing levels of precursors (NOx). At the
studied region, the daily cycle of NO concentration stem from vehicle emissions and its conversion to NO2 has a huge
impact on the daily cycle of ozone levels. A linear correlation between NO2 and NOx has also been determined,
as well as between NO and NOx, while a polynomial
correlation between O3 and NO2/NO has been found. These
forms can be useful for the strategies of O3 provision and
efforts of air pollution control. The Ox level is influenced by
independent and dependent contributions of NO2. The first
one is due to the regional concentration of O3, and the last
one is correlated with the local level of primary pollution.
ACKNOWLEDGEMENTS
This work was supported by the Institute of Physics of the Federal University of Mato Grosso do Sul
REFERENCES
1Nevers, N. D. Air Pollution Control Engineering, 2nd ed.
McGraw-Hill Companies, Inc., New York, 2000, 571–573.
2Agudelo-Castañeda, D. M., Teixeira, E. C., Rolim, S. B. A.,
Pereira, F. N., & Wiegand, F.. Measurement of particle number and related pollutant concentrations in an urban area in South Brazil. Atm. Environ., 2013, 70, 254-262.
10.1016/j.atmosenv.2013.01.029
3Kurtenbach, R.; Kleffmann, J.; Niedojadlo, A.; Wiesen, P.,
Primary NO2 emissions and their impact on air quality in
traffic environments in Germany. Environ. Sci. Eur., 2012,
24(1), 1. DOI: 10.1186/2190-4715-24-21
4Notario, A. Bravo, I. Adame, J.A. Diaz–de–Mera, Y. Aranda, A.
Rodriguez, A. Rodriguez, D., Analysis of NO, NO2, NOx, O3 and oxidant (OX=O3+NO2) levels measured in a metropolitan area in the southwest of Iberian Peninsula. Atm. Res., 2012, 104, 217–226.
https://doi.org/10.1016/j.atmosenv.2015.01.027
5Mazzeo, N. A., Venegas, L. E. and Choren, H.. Analysis of NO,
NO2, O3 and NOx Concentrations Measured at a Green Area
of Buenos Aires City during Wintertime. Atm. Environ., 2005,
39, 3055–3068.
https://doi.org/10.1016/j.atmosenv.2005.01.029
6Ghazali, N. A., Ramli, N. A., Yahaya, A. S., Yusof, N. F.,
Sansuddin, N., Madhoun, W. A. A. Transformation of nitrogen dioxide into ozone and prediction of ozone concentrations using multiple linear regression techniques.
Environ. Monit. Assess. 2010, 165, 475–489. DOI
10.1007/s10661-009-0960-3
7Han, S., Bian, H., Feng, Y., Liu, A., Li, X., Zeng, F., Zhang, X.,
Analysis of the Relationship between O3, NO and NO2 in Tianjin, China. Aerosol Air Qual. Res., 2011, 11, 128–139.
doi: 10.4209/aaqr.2010.07.0055
8de Souza, A., Kovač-Andrić, E., Matasović, B., Marković, B.,
Assessment of Ozone Variations and Meteorological Influences in West Center of Brazil, from 2004 to 2010. Water, Air and Soil Pollut., 2016, 227, 313. DOI: 10.1007/s11270-016-3002-0
9de Souza, A., Aristone, F., Sabbah, I., Modeling the Surface
Ozone Concentration in Campo Grande (MS)-Brazil Using Neural Networks. Natural Sci., 2015, 7, 171-178. doi: 10.4236/ns.2015.74020.
10de Souza, A., Aristone, F., Goncalves, F., Modeling of Surface
and Weather Effects Ozone Concentration Using Neural Networks in West Center of Brazil. J. Climatol. Weather Forecasting,2015, 3, 1-4-4.
11de Souza, A.,Aristones, F., Pavão, H. G., Fernandes, W. A.,
Development of a Short-Term Ozone Prediction Tool in Campo Grande-MS-Brazil Area Based on Meteorological Variables. Open J. Air Pollut., 2014, 3, 42-51.
http://dx.doi.org/10.4236/ojap.2014.32005
12de Souza, A., Aristones, F., Silva, G., Becker, M., Fernandes W.
A., Temporal Variation of the Concentration of Carbon Monoxide in the Center West of Brazil. Atm. Climate Sci., 2014, 4, 563-568. DOI: 10.4236/acs.2014.44051
13de Souza, A., Pavão, H. G., Garcia, A. P., Modeling of ozone due
to weather conditions. Rev. Brasil. Climatol., 2013, 12, 7-21.
14Pires, J. C. M., de Souza, A., Pavão, H. G., Martins, F. G.,
Variation of surface ozone in Campo Grande, Brazil: meteorological effect analysis and prediction. Env. Sci. Pollut. Res. Int., 2014, 21, 10550-10559,. DOI: 10.1007/s11356-014-2977-6
15de Souza, A., Fernandes, W. A., Surface ozone measurements
and meteorological influences in the urban atmosphere of Campo Grande - Acta Sci. Technol. (Impresso), 2013, 36, 141-146. doi: 10.4025/actascitechnol.v36i1.18379.
16De Serve, C., Rondon, A., Oyola, P., Photochemical studies in
the savanna boundary layer during wet season. Atmos. Environ., 1996, 30, 1419 ̄1427. https://doi.org/10.1016/1352-2310(95)00445-9
17Lange, L. Aircraft-borne trace gas measurements during the
STREAM 98 campaign. 2000, 115 f. Tese (Doutorado), Utrecht.
18Funglestvedt, J. S.; Jonson, J. E.; Isaksen, I. S. A. Effects of
reduction in stratospheric ozone on tropospheric chemistry through changes in photolysis rates. Tellus, 1994, 46B, . 172 ̄192.
19Atkinson-Palombo, C. M., Miller, J. A., and Balling, Jr. R. C.
Quantifying the Ozone ‘‘Weekend Effect’’ at Various Locations in Phoenix, Arizona. Atmos. Environ., 2006, 40, 7644–7658. 10.1016/j.atmosenv.2006.05.023
20Finlayson-Pitts, B. J.; Pitts-Junior, J.N.; Chemistry of the upper
and lower atmosphere, Academic Press: California, 2000.
21Ehhalt, D. H.: Photooxidation of trace gases in the troposphere,
Phys. Chem. Chem. Phys., 1991, 5401–5408. DOI:
10.1039/A905097C.
22Jenkin, M. E. and Clemitshaw, K. C.: Ozone and other secondary
photochemical pollutants: chemical processes governing their formation in the planetary boundary layer, Atm. Environ. 2000, 34, 2499–2527. https://doi.org/10.1016/S1352-2310(99)00478-1
23Seinfeld, J.H. and Pandis, S.N.. Atmospheric Chemistry and
Physics: From Air Pollution to Climate Changes. Wiley, New York, 1998, p. 1326.
24Suqin Han, Hai Bian, Yinchang Feng, Aixia Liu, Xiangjin Li,
25Xin, J. Y., Wang, Y. S., Tang, G. Q., Wang, L. L., Sun, Y., Wang,
Y. H., Hu, B., Song, T., Ji, D. S., Wang, W. F.; Li., L. G., Liu, G. R., Variability and reduction of atmospheric pollutants in Beijing and its surrounding area during the Beijing 2008 Olympic Games. Chin. Sci. Bull.,2010, 55, 1937–1944. DOI: 10.1007/s11434-010-3216-2
Received: 21.05.2017.
![Figure 4. Variation of O3 as a function of the [NO2]/[NO] ratio.](https://thumb-us.123doks.com/thumbv2/123dok_us/7827746.2088611/4.595.53.274.68.221/figure-variation-o-function-no-ratio.webp)
![Figure 8 shows the adjusted expression of [NO2] / [OX] as a function of [NOx]: Y = 0.71 + 0.33 * ln [NOx]; with a correlation coefficient of R2 = 55.2%](https://thumb-us.123doks.com/thumbv2/123dok_us/7827746.2088611/5.595.313.533.340.746/figure-shows-adjusted-expression-function-nox-correlation-coefficient.webp)