S H O R T R E P O R T
Open Access
Reliable reference genes for expression
analysis of proliferating and adipogenically
differentiating human adipose stromal cells
Claudia Krautgasser
1†, Markus Mandl
1†, Florian M. Hatzmann
1, Petra Waldegger
1, Monika Mattesich
2and Werner Zwerschke
1** Correspondence:werner. [email protected]
†Claudia Krautgasser and Markus
Mandl have equal contribution
1Division of Cell Metabolism and
Differentiation Research, Institute for Biomedical Aging Research, University of Innsbruck, Rennweg 10, A-6020 Innsbruck, Austria Full list of author information is available at the end of the article
Abstract
Background:The proliferation and adipogenic differentiation of adipose stromal
cells (ASCs) are complex processes comprising major phenotypical alterations driven by up- and downregulation of hundreds of genes. Quantitative RT-PCR can be employed to measure relative changes in the expression of a gene of interest. This approach requires constitutively expressed reference genes for normalization to counteract inter-sample variations due to differences in RNA quality and quantity. Thus, a careful validation of quantitative RT-PCR reference genes is needed to accurately measure fluctuations in the expression of genes. Here, we evaluated candidate reference genes applicable for quantitative RT-PCR analysis of gene expression during proliferation and adipogenesis of human ASCs with the immunophenotype DLK1+/CD34+/CD90+/CD105+/CD45−/CD31−.
Methods:We evaluated the applicability of 10 candidate reference genes (GAPDH,
TBP,RPS18,EF1A,TFRC,GUSB,PSMD5,CCNA2,LMNAandMRPL19) using NormFinder, geNorm and BestKeeper software.
Results:The results indicate thatEF1AandMRPL19are the most reliable reference
genes for quantitative RT-PCR analysis of proliferating ASCs.PSMD5serves as the most reliable endogenous control in adipogenesis.CCNA2andLMNAwere among the least consistent genes.
Conclusions:Applying these findings for future gene expression analyses will help
elucidate ASC biology.
Keywords:Adipose stromal cells, Adipose stem cells, Adipogenesis, Proliferation,
Differentiation, Reference gene
Background
Adipose stromal cells (ASCs) are a major reservoir of adipocyte precursors in adipose tissues [1, 2]. Their heterogeneous population contains stem and progenitor cells, which are essential for adipose tissue development, regeneration and homeostasis [3]. Thus, ASCs are crucial for the maintenance of adipose tissue functions. They are also a viable source of material for cell-based therapies in regenerative medicine [4].
The large population of human ASCs with the immunophenotype DLK1+/CD34+/ CD90+/CD105+/CD45−/CD31− consists of adipose progenitor cells with high
proliferative and adipogenic potential [5, 6]. Proliferation is a highly dynamic process involving many changes in gene expression occurring in response to extracellular sig-nals and as a function of cell cycle progression regulated by specific cyclin-dependent kinase activities [7]. The differentiation of ASCs into adipocytes, also referred to as adi-pogenesis, gives rise to a new cell type [8]. A cascade of transcriptional regulators or-chestrates adipogenesis. The expression of the adipogenic transcription factor peroxisome proliferator-activated receptor γ2 (PPAR γ2), which is both required and sufficient to drive adipogenesis, is a key event in the induction of the adipogenic differ-entiation program [9,10]. The function of PPARγ2 is tightly linked to members of the CCAAT/enhancer-binding protein (C/EBP) family of transcription factors [11]. The functional interaction of these factors induces changes in the expression of a large number of genes, leading to distinct morphological and biochemical alterations and eventually to the generation of adipocytes [12]. To accurately analyze the changes in gene expression during both proliferation and adipogenic differentiation of ASCs, ap-propriate endogenous controls are needed.
Valid reference genes are crucial for reliable gene expression analyses using quantita-tive RT-PCR [13, 14]. They serve as internal controls, allowing normalization, which counteracts inter-sample variations due to differences in RNA quantity and quality [13,
15]. State-of-the-art quantitative RT-PCR is essential for the validation of appropriate reference genes [16,17].
A constitutive expression pattern qualifies a certain gene to act as internal control [15, 16, 18]. Commonly used reference genes include those coding for metabolic en-zymes, such as glyceraldehyde-3-phosphate dehydrogenase (GAPDH), or components of the cytoskeleton, such asβ-actin (ACTB) andβ-2-microglobulin (B2M) [16,17]. The 18S ribosomal RNA is also considered to be a reliable reference in quantitative RT-PCR experiments [19]. However, it is known that the expressions of genes coding for meta-bolic enzymes [20] and cytoskeleton components [21] are regulated and dependent on the physiological conditions or cellular state. In fact, no single gene exists which is con-stitutively expressed in all cell types under all experimental conditions [15,18].
Thus, a careful validation of reference genes for given applications is mandatory. There is still a need for appropriate endogenous controls for quantitative RT-PCR ana-lysis to cope with the strong fluctuations in gene expression during the complex pro-cesses of ASC proliferation and adipocyte differentiation. This study aimed to evaluate candidate reference genes reliable for quantitative RT-PCR analysis of proliferating and differentiating human ASCs to enable future elucidation of ASC biology.
Methods Study design
We aimed to identify appropriate quantitative RT-PCR reference genes for the analysis of gene expression in the course of proliferation and adipogenesis of human ASCs.
Isolation and cultivation of ASCs
Innsbruck. All patients gave their informed written consent. The study protocol was ap-proved by the Ethics Committee of the Medical University of Innsbruck and complies with the Helsinki Declaration. The characteristics of the donors are given in Additional file
1: Table S1. Isolation and cultivation of ASCs was performed as described previously [6]. ASCs were maintained in PM4 medium, which is DMEM/F-12 medium (1:1) with HEPES and l-glutamine (Gibco) containing 33μM biotin, 17μM pantothenate 20μg/ml cipro-floxacin, 2.5% FCS, 10 ng/ml EGF, 1 ng/ml bFGF and 500 ng/ml insulin. The ASCs were split at 70% confluence. Passage 3 ASCs were used for the whole study.
Adipogenic differentiation
Adipogenesis was induced as described previously [6]. ASCs were expanded until con-fluence in PM4 medium and serum-starved for another 48 h in serum-free ASC medium consisting of DMEM/F-12 medium (1:1) with HEPES and l-glutamine (Gibco) containing 33μM biotin, 17μM pantothenate and 20μg/ml ciprofloxacin. Adipogenesis was induced by the addition of differentiation medium, which was ASC medium con-taining 0.2μM insulin, 0.5 mM IBMX, 0.25μM dexamethasone, 2.5% FCS and 10μg/ml transferrin. After 3 days, the medium was changed, and the cells were cultivated until day 14 in differentiation medium without IBMX. Cell extracts for western blot and gene expression analysis were taken at defined time points before and after induction of adipogenic differentiation. Oil-Red-O staining was performed to visualize lipid drop-lets of differentiated adipocytes. Briefly, cells were fixed in a 4% paraformaldehyde–PBS mixture for 30 min, washed with PBS, stained with 0.5% Oil-Red-O in a 60:40 isopropa-nol:water mix for 1 h, and finally washed with H2O.
Proliferation monitoring
For the proliferation assays, 6-well plates were seeded with 60,000 cells/well. The cells were cultivated in PM4 medium containing 2.5% FCS (low mitogenic medium) and PM4 medium containing 10% FCS (high mitogenic medium) in the same experiment. Cell numbers were counted at defined time points using a Neubauer Chamber.
Flow cytometry analysis
Fluorescence-activated cell sorting (FACS) was used to characterize the immunophenotype of human ASCs. 1 × 10⁵cells per sample were simultaneously fixed and permeabilized using BD Cytofix/Cytoperm solution to prepare the cells for intracellular and surface staining. The cells were subjected to immunofluorescence staining using a panel of mouse monoclo-nal antibodies (BD Pharmingen): CD34-PE-Cy7 (#560710), CD105-PerCP-Cy5.5 (#560819), CD90-PE (#561970), CD45RA-FITC (#556626) and CD31-FITC (#555445). For DLK1 a pri-mary rat monoclonal anti-human DLK1/PREF1 antibody (Adipogen, AG-25A-0091) along with the anti-rat-APC antibody (BD Pharmingen, #551019) was used. The labeled cells were measured using a FACS Canto II (BD Biosciences) and the data were analyzed using Flow-ing Software (http://www.flowingsoftware.com).
RNA isolation and quantitative RT-PCR
immediately with 350μl RLT buffer per well. Genomic DNA (gDNA) was removed from the cell lysate by filtration through a gDNA Eliminator spin column (Qiagen). Subsequently, one volume 70% ethanol was added and the sample transferred onto the RNeasy MinElute binding column. Bound RNA was washed with RW1 buffer, RPE buf-fer and 80% ethanol. After elution, the yield and purity of the isolated RNA was deter-mined spectrophotometrically. RNA integrity was confirmed using agarose gel electrophoresis.
For reverse transcription of RNA (1.5μg per sample), we used the First Strand cDNA Synthesis Kit (Thermo Scientific, #K1622) according to the manufacturer’s guidelines. Subsequently, cDNA was diluted 1:15 and an aliquot of 5μl was used for quantitative RT-PCR analysis.
Gene expression was measured with a LightCycler 480 (Roche) instrument using SYBR green chemistry and confirmed using corresponding non-template controls. Gen-omic DNA contamination was excluded using appropriate mock reverse-transcriptase controls. Primer were designed using QuantPrime [22] ( http://quantprime.mpimp--golm.mpg.de/) and are given in Additional file1: Table S3. Primer specificity was veri-fied via melting curve analysis. The number of biological replicates (i.e., donors) per group was n= 3 (proliferation) and n= 4 (adipogenesis). All samples were measured in duplicate.
Western blot analysis
ASCs were harvested in SDS lysis buffer and sonicated as described previously [6]. The protein concentration of the samples was determined with the Combat-Able Protein Assay Preparation Reagent Set (Thermo Scientific, #23215) and the Pierce BCA Protein Assay Kit (Thermo Scientific, #23227). Samples (10μg total protein) were separated on 10% SDS-polyacrylamide gel, blotted onto a PVDF membrane and probed with poly-clonal anti-perilipin antibodies (Cell Signaling Technology, #9349). To ensure equal loading and blotting, membranes were probed with an anti-β-actin antibody (Sigma Al-drich, AC15). Goat anti-rabbit IgG-HRP (DAKO) and anti-mouse IgG-HRP (Promega) served as secondary antibodies. Signals were detected using a chemiluminescence de-tection system.
Software packages for quantitative RT-PCR analysis
Quantitative RT-PCR results were analyzed using three software packages, NormFinder, geNorm and BestKeeper, according to the developer’s instructions. The NormFinder al-gorithm was described by Andersen et al. [18] (software download: https://moma.dk/ normfinder-software). The principles of the geNorm program were described by Vande-sompele et al. [23] (software download:https://genorm.cmgg.be/). The BestKeeper soft-ware was described by Pfaffl et al. [24] (software download: http:// www.gene-quantification.de/bestkeeper.html). Candidate reference genes were ranked based on the relevant algorithm.
Statistics
Comparison of two groups was achieved using Student’st-test. p≤0.05 was considered statistically significant.
Results
Proliferation and adipogenic differentiation of human ASCs
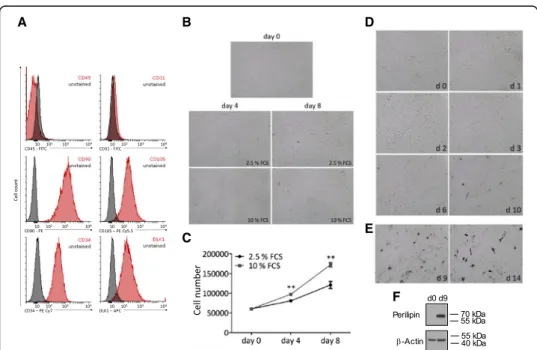
We evaluated candidate reference genes for quantitative RT-PCR-based gene expression studies of proliferating and differentiating human ASCs. First, we isolated ASCs from fresh abdominal sWAT samples obtained by incision from four female donors undergo-ing elective plastic abdominal surgery (Additional file 1: Table S1). The cells were stored in liquid nitrogen. To determine the purity of the ASC population, the cells were thawed and grown to passage 3. Afterwards the cells were permeabilized and subjected to multi-parameter detection FACS analysis using antibodies against established ASC marker proteins [6, 25]. The vast majority of the cells showed the characteristic ASC immunophenotype, DLK1+/CD34+/CD90+/CD105+/CD45−/CD31− (Fig. 1a), which is expected for permeabilized passage 3 ASCs [6,25].
The ASCs were then cultured in a low mitogenic medium (PM4 medium containing 2.5% FCS) and in a high mitogenic medium (PM4 medium containing 10% FCS).
A B D
C E
F
Proliferation was monitored by counting the ASC numbers on the indicated days (Fig.
1b and c). As expected, ASCs grown in high mitogenic medium showed a significantly higher proliferation rate compared to cells grown in low mitogenic medium.
For adipogenic differentiation, ASCs were grown to density arrest and starved in serum-free medium. Induction of adipogenesis by a hormone cocktail led to the char-acteristic morphological transformation of ASCs from a fibroblast-like morphology to rounded cells in the course of the first 72 h after induction (Fig.1d). This is a hallmark of adipogenesis [26]. Differentiation was confirmed by detection of intracellular fat droplets (Fig. 1e) and the adipocyte-specific protein perilipin (Fig.1f ). The full western blot analysis is shown in Additional file2: Figure S1.
Selection and expression levels of reference genes
For quantitative RT-PCR analysis, total RNA was isolated from proliferating ASCs (3 donors) and from ASCs 0, 1, 2, 3, 6 and 10 days after induction of adipogenesis (4 do-nors). The yield ranged from 2 to 10μg with a mean purity ratio (A260/A280) of 2.0.
We selected several candidate reference genes (Additional file1: Table S2) to find the most reliable ones for RNA expression analysis in proliferating and differentiating ASCs. Standard curves for reference genes were processed based on proliferating ASCs whereas standards for adipogenic marker genes were performed on ASCs three days after the induction of adipogenesis (Additional file 3: Figure S2 and Additional file 4: Figure S3).
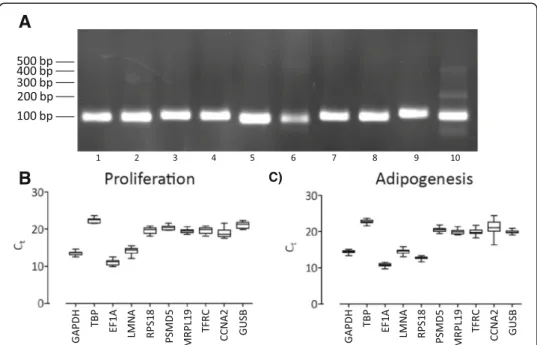
Quantitative RT-PCR for standards was performed using the classical 10-fold serial dilution method. The efficiencies (E) of reference and target gene primer sets had mean values of 101.9 +/−2.81% and 103.9 +/−3.80%, respectively (Additional file 4: Table S3). To confirm a specific PCR amplification, gel electrophoresis was performed. It showed only one PCR product at the predicted size (Fig. 2a). Additionally, melting curve analysis exhibited one clear peak for each primer pair (data not shown).
The tested reference genes showed various expression levels (Fig.2b and c). To evalu-ate if the increased SDs within these four groups refer to significant outliers we per-formed Grubbs’ test, which detects outliers in a given data set and defines their significance. No significant outlier was detected with the threshold at p≤0.05. There-fore, all samples were included for further analysis.
Evaluation of appropriate reference genes for ASC proliferation and differentiation
The candidate reference genes selected in this study encode proteins in different func-tional classes so the chance that genes might be co-regulated is low [18]. To select opti-mal reference genes for ASC proliferation and differentiation, three different mathematical approaches (GeNorm, NormFinder and BestKeeper) were used:
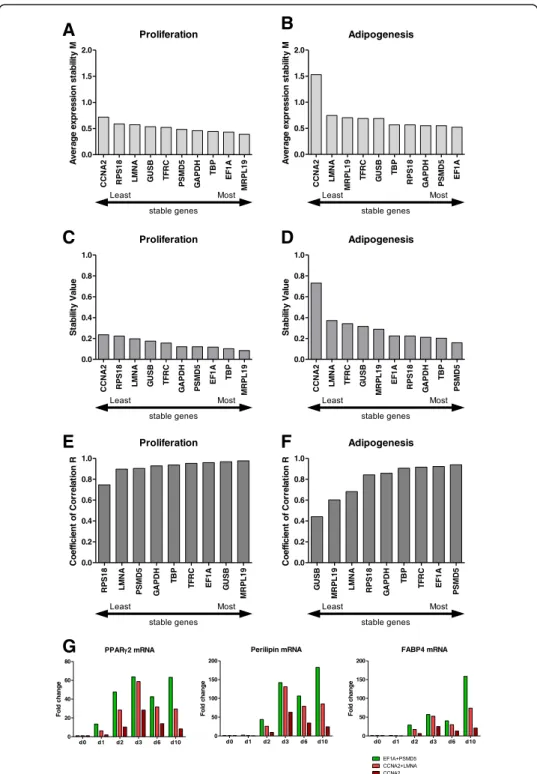
The NormFinder algorithm calculates the stability value of each gene. Based on this analysis, the use of two candidate genes with the lowest stability is recommended (threshold 0.15) [18]. As shown in Fig. 3c, candidate genes (MRPL19, TBP, EF1A,
PMSD5 and GAPDH) meet the criteria defined by the normalization factor cut off value 0.15 for proliferating ASCs. NormFinder analysis revealed MRPL19 and TBP to be the best combination of reference genes for proliferating ASCs (stability value 0.075). However, the stability values of candidate genes tested in differentiating ASCs failed to remain below the threshold of 0.15 (Fig. 3d). As mentioned above, these higher values might be due to the heterogeneity of differentiating cells. How-ever, the combination of PSMD5 andTBP changed the stability value to an accept-able number of 0.122.
BestKeeper analysis step-wisely excludes unsuitable candidate reference genes. After descriptive statistical analysis for each reference gene, candidates with a standard devi-ation above 1.0 are immediately excluded. Subsequently, pair-wise correldevi-ation analysis is performed to calculate the Pearson correlation co-efficient R for every reference gene. High R values are considered to indicate a stable gene expression pattern [24]. Analysis of CTvalues of all candidate genes in proliferating ASCs revealed a SD (stand-ard deviation) below 1.0 (data not shown). CCNA2was excluded from further calcula-tions due to its high SD (0.89). Further analysis showed a strong correlation for all candidate genes (0.977 < R < 0.741; Fig.3e). When we repeated BestKeeper analysis with the three most appropriate genes, MRPL19, GUSB and EF1A, the correlation even in-creased (0.985 < R < 0.987, Additional file 1: Table S4). After excluding CCNA2 (SD = 1.5), candidate reference genes in adipogenic ASCs showed a rather weak correlation (0.920 < R < 0.437, Fig. 3f ). However, examination of the three best candidates (PSMD5,
A
B
A
B
C
D
E
F
G
EF1A and TFRC) revealed a strong correlation between these genes (0.969 < R < 0.935, Additional file1: Table S4).
The impact of different reference genes on the expressions of genes of interest (GOIs) was evaluated in differentiating ASCs. Representative time-course experiments using the combinations EF1A+PSMD5,CCNA2+LMNA and only CCNA2as the reference gene(s) are shown in Fig. 3g. It is clear that the selection of the reference gene(s) has considerable influence on the measurement of GOI expression.
Discussion
Cell cycle progression and differentiation of ASCs into mature adipocytes are highly or-chestrated and associated with major changes in the gene expression pattern [7,8,11]. To measure transcriptional changes during these processes, reliable approaches are re-quired [28].
Quantitative RT-PCR is an established and highly sensitive technique to measure the expression of a gene of interest [29]. Absolute and relative quantitation of gene expres-sion are possible with this technique. The first approach requires a costly standard curve to determine the number of transcripts present in the sample, while the latter de-pends on appropriate reference genes for relative quantitation of gene expression [16,
17]. In this study, we combined the NormFinder, GeNorm and BestKeeper software packages [18,23,24] to define new reference genes for the comparison of gene expres-sion in proliferating and adipogenic differentiating ASCs. Our results demonstrate the feasibility of this combinatorial approach. Similar results were obtained with all three programs.
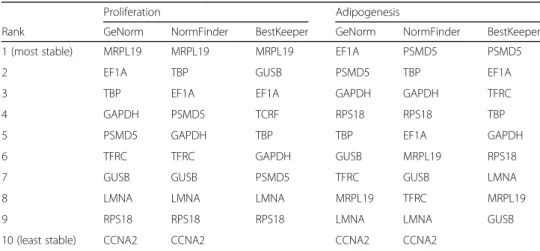
EF1Aand MRPL19were identified as the most stably expressed genes in the prolifer-ating ASCs. The three algorithms identified PSMD5as the most stably expressed gene in adipogenically differentiating ASCs. EF1A was ranked by GeNorm and BestKeeper to be among the most stable reference genes for adipogenesis (Table 1). Commonly used endogenous control genes such as GAPDHshowed an intermediate stability valu-ated during proliferation and adipogenic differentiation.
Our results underscore the context-dependent expression of reference genes and the requirement to find the most appropriate one(s) for given experimental conditions. Our findings are in agreement with those of other studies that identified EF1A and
Table 1Ranking of reference genes
Proliferation Adipogenesis
Rank GeNorm NormFinder BestKeeper GeNorm NormFinder BestKeeper
1 (most stable) MRPL19 MRPL19 MRPL19 EF1A PSMD5 PSMD5
2 EF1A TBP GUSB PSMD5 TBP EF1A
3 TBP EF1A EF1A GAPDH GAPDH TFRC
4 GAPDH PSMD5 TCRF RPS18 RPS18 TBP
5 PSMD5 GAPDH TBP TBP EF1A GAPDH
6 TFRC TFRC GAPDH GUSB MRPL19 RPS18
7 GUSB GUSB PSMD5 TFRC GUSB LMNA
8 LMNA LMNA LMNA MRPL19 TFRC MRPL19
9 RPS18 RPS18 RPS18 LMNA LMNA GUSB
TBPas useful endogenous controls to analyze gene expression in differentiating mesen-chymal stem cells [13, 28]. The experimental strategy of our study is a straightforward way to identify novel reference genes for quantitative RT-PCR analysis of proliferating and differentiating ASCs. This strategy has also been applied to mesenchymal stem cells of human [13] and rat origin [30].
Conclusions
Our study identifiedEF1A,MRPL19andPSMD5as new quantitative RT-PCR reference genes suitable for measuring changes in gene expression during proliferation and adi-pogenesis of human DLK1+/CD34+/CD90+/CD105+/CD45−/CD31− ASCs. The data suggest that EF1A and MRPL19 are the most reliable reference genes for quantitative RT-PCR analysis of proliferating ASCs with that immunophenotype andPSMD5serves as the best endogenous control for gene expression analysis in the course of adipogenic differentiation of these cells. Applying these findings in future experiments will help elucidate ASC biology.
Additional files
Additional file 1:Table S1.Donor characteristics. All donors were healthy formerly obese Caucasian women, who underwent routine abdominoplasty. None of the women suffered from diabetes, liver, renal or other severe metabolic diseases. None of the women had cancer. Clinical and anthropometric parameters are indicated.Table S2.Selected candidate reference genes.Table S3.Primer sequences.Table S4.Results of BestKeeper analysis. (DOCX 30 kb)
Additional file 2:Figure S1.Detection of perilipin via western blot analysis.A–SDS-PAGE was carried out as described in the Methods section to separate proteins in cellular lysates by molecular weight. A pre-stained molecular weight marker (M) was included (Thermo Scientific, #26616). After gel electrophoreses, the proteins were electro-blotted onto one polyvinyl-difluoride (PVDF) membrane. The transfer of pre-stained marker bands indicated a successful western blot procedure.B–Immobilized PVDF membrane-bound proteins were probed using a specific antibody against perilipin (Cell Signaling Technology, #9349) followed by incubation with an appropriate horseradish peroxidase-conjugated (HRP-conju-gated) secondary antibody (goat anti-rabbit IgG-HRP, DAKO). Signal development was achieved by applying the enhanced chemo-luminescence (ECL) substrate. The generated light signal was detected by exposure of the PVDF membrane to a X-ray film. Marker bands were manually transferred onto the X-X-ray film by adjusting the PVDF membrane and the X-X-ray film according to specific marks located in the film cassette. The corresponding X-ray film to the PVDF membrane shown in (A) is presented.C–To ensure equal loading, the same PVDF membrane was re-probed using a specific anti-β-actin antibody (Sigma Aldrich, AC15) followed by incubation with an HRP-conjugated secondary antibody (anti-mouse IgG-HRP). After applying the ECL substrate, the membrane was exposed to an X-ray film. The corresponding X-ray film to the PVDF membrane shown in (A) is presented. The molecular weight is given in kilo Daltons (kDa). (PDF 99 kb)
Additional file 3:Figure S2.Standard curves for reference genes. (PDF 446 kb)
Additional file 4:Figure S3.Standard curves for target genes. (PDF 81 kb)
Abbreviations
ASCs:Adipose stromal cells; C/EBP: CCAAT/enhancer-binding protein; CCNA2: Cyclin A2; DLK-1: Delta-like protein 1; EF1A: Elongation factor alpha; EGF: Epidermal growth factor; FCS: Fetal Calf Serum; FGF: Fibroblast growth factor; GAPDH: Glyceraldehyde-3-phosphate dehydrogenase; gDNA: Genomic DNA; GOI: Gene of interest;
GUSB: Glucuronidase beta; LMNA: Lamin A; MRPL19: Mitochondrial ribosomal protein 19; PPARγ2: Peroxisome proliferator-activated receptorγ2; PSMD5: Proteasome 26S subunit, non-ATPase 5; RPS18: Ribosomal protein S18; RT-PCR: Reverse transcription polymerase chain reaction; SD: Standard deviation; SEM: Standard error of the mean; SVF: Stromal vascular fraction; sWAT: Subcutaneous white adipose tissue; TBP: TATA-box binding protein; TFRC: Transferrin receptor
Acknowledgements Not applicable.
Funding
This study was supported by intramural funding from the University of Innsbruck.
Availability of data and materials
Authors’contributions
CK, MaM and WZ designed the experiments. CK, MaM, FH and PW performed the experiments. CK, PW, FH, MaM, MoM and WZ analyzed the data. MoM performed the surgeries and contributed adipose tissue biopsies. CK, MaM and WZ wrote the manuscript. All authors read and approved the final manuscript.
Ethics approval and consent to participate
Subcutaneous white adipose tissue (sWAT) samples were taken from women undergoing routine abdominoplasty at the Institute for Plastic and Reconstructive Surgery of the Medical University of Innsbruck. All patients gave their informed written consent. The study protocol was approved by the Ethics Committee (Medical University of Innsbruck) according to the Declaration of Helsinki.
Consent for publication All authors gave their consent.
Competing interests
The authors declare that they have no competing interests.
Publisher’s Note
Springer Nature remains neutral with regard to jurisdictional claims in published maps and institutional affiliations.
Author details
1Division of Cell Metabolism and Differentiation Research, Institute for Biomedical Aging Research, University of
Innsbruck, Rennweg 10, A-6020 Innsbruck, Austria.2Department of Plastic and Reconstructive Surgery, Innsbruck
Medical University, Anichstraße 35, A-6020 Innsbruck, Austria.
Received: 3 October 2018 Accepted: 11 February 2019
References
1. Rodeheffer MS, Birsoy K, Friedman JM. Identification of white adipocyte progenitor cells in vivo. Cell. 2008;135(2):240–9. 2. Tang W, Zeve D, Suh JM, Bosnakovski D, Kyba M, Hammer RE, Tallquist MD, Graff JM. White fat progenitor cells reside in
the adipose vasculature. Science. 2008;322(5901):583–6.
3. Berry DC, Jiang Y, Graff JM. Emerging roles of adipose progenitor cells in tissue development, homeostasis, expansion and thermogenesis. Trends Endocrinol Metab: TEM. 2016;27(8):574–85.
4. Lockhart RA, Aronowitz JA, Dos-Anjos Vilaboa S. Use of freshly isolated human adipose stromal cells for clinical applications. Aesthet Surg J. 2017;37(suppl_3):S4–8.
5. Zimmerlin L, Donnenberg VS, Pfeifer ME, Meyer EM, Peault B, Rubin JP, Donnenberg AD. Stromal vascular progenitors in adult human adipose tissue. Cytometry A. 2010;77(1):22–30.
6. Mitterberger MC, Lechner S, Mattesich M, Kaiser A, Probst D, Wenger N, Pierer G, Zwerschke W. DLK1(PREF1) is a negative regulator of adipogenesis in CD105(+)/CD90(+)/CD34(+)/CD31(−)/FABP4(−) adipose-derived stromal cells from subcutaneous abdominal fat pats of adult women. Stem Cell Res. 2012;9(1):35–48.
7. Bertoli C, Skotheim JM, de Bruin RA. Control of cell cycle transcription during G1 and S phases. Nat Rev Mol Cell Biol. 2013;14(8):518–28.
8. Cristancho AG, Lazar MA. Forming functional fat: a growing understanding of adipocyte differentiation. Nat Rev Mol Cell Biol. 2011;12(11):722–34.
9. Tontonoz P, Spiegelman BM. Fat and beyond: the diverse biology of PPARgamma. Annu Rev Biochem. 2008;77:289–312. 10. Li D, Zhang F, Zhang X, Xue C, Namwanje M, Fan L, Reilly MP, Hu F, Qiang L. Distinct functions of PPARgamma isoforms
in regulating adipocyte plasticity. Biochem Biophys Res Commun. 2016;481(1–2):132–8. 11. Farmer SR. Transcriptional control of adipocyte formation. Cell Metab. 2006;4(4):263–73.
12. Siersbaek R, Mandrup S. Transcriptional networks controlling adipocyte differentiation. Cold Spring Harb Symp Quant Biol. 2011;76:247–55.
13. Gentile AM, Lhamyani S, Coin-Araguez L, Oliva-Olivera W, Zayed H, Vega-Rioja A, Monteseirin J, Romero-Zerbo SY, Tinahones FJ, Bermudez-Silva FJ, et al. RPL13A and EEF1A1 are suitable reference genes for qPCR during adipocyte differentiation of vascular stromal cells from patients with different BMI and HOMA-IR. PLoS One. 2016;11(6):e0157002. 14. Bustin SA, Benes V, Garson JA, Hellemans J, Huggett J, Kubista M, Mueller R, Nolan T, Pfaffl MW, Shipley GL, et al. The
MIQE guidelines: minimum information for publication of quantitative real-time PCR experiments. Clin Chem. 2009;55(4): 611–22.
15. Amable PR, Teixeira MV, Carias RB, Granjeiro JM, Borojevic R. Identification of appropriate reference genes for human mesenchymal cells during expansion and differentiation. PLoS One. 2013;8(9):e73792.
16. Dundas J, Ling M. Reference genes for measuring mRNA expression. Theory in biosciences = Theorie in den Biowissenschaften. 2012;131(4):215–23.
17. Ferguson BS, Nam H, Hopkins RG, Morrison RF. Impact of reference gene selection for target gene normalization on experimental outcome using real-time qRT-PCR in adipocytes. PLoS One. 2010;5(12):e15208.
18. Andersen CL, Jensen JL, Orntoft TF. Normalization of real-time quantitative reverse transcription-PCR data: a model-based variance estimation approach to identify genes suited for normalization, applied to bladder and colon cancer data sets. Cancer Res. 2004;64(15):5245–50.
19. Julian GS, de Oliveira RW, Perry JC, Tufik S, Chagas JR. Validation of housekeeping genes in the brains of rats submitted to chronic intermittent hypoxia, a sleep apnea model. PloS one. 2014;9(10):e109902.
21. Tondeleir D, Vandamme D, Vandekerckhove J, Ampe C, Lambrechts A. Actin isoform expression patterns during mammalian development and in pathology: insights from mouse models. Cell Motil Cytoskeleton. 2009;66(10):798–815. 22. Arvidsson S, Kwasniewski M, Riano-Pachon DM, Mueller-Roeber B. QuantPrime--a flexible tool for reliable
high-throughput primer design for quantitative PCR. BMC bioinformatics. 2008;9:465.
23. Vandesompele J, De Preter K, Pattyn F, Poppe B, Van Roy N, De Paepe A, Speleman F. Accurate normalization of real-time quantitative RT-PCR data by geometric averaging of multiple internal control genes. Genome Biol. 2002;3(7): RESEARCH0034.
24. Pfaffl MW, Tichopad A, Prgomet C, Neuvians TP. Determination of stable housekeeping genes, differentially regulated target genes and sample integrity: BestKeeper--excel-based tool using pair-wise correlations. Biotechnol Lett. 2004;26(6): 509–15.
25. Zwierzina ME, Ejaz A, Bitsche M, Blumer MJ, Mitterberger MC, Mattesich M, Amann A, Kaiser A, Pechriggl EJ, Horl S, et al. Characterization of DLK1(PREF1)+/CD34+ cells in vascular stroma of human white adipose tissue. Stem Cell Res. 2015; 15(2):403–18.
26. Ejaz A, Mitterberger MC, Lu Z, Mattesich M, Zwierzina ME, Horl S, Kaiser A, Viertler HP, Rostek U, Meryk A, et al. Weight loss upregulates the small GTPase DIRAS3 in human white adipose progenitor cells, which negatively regulates Adipogenesis and activates autophagy via Akt-mTOR inhibition. EBioMedicine. 2016;6:149–61.
27. Hellemans J, Mortier G, De Paepe A, Speleman F, Vandesompele J. qBase relative quantification framework and software for management and automated analysis of real-time quantitative PCR data. Genome Biol. 2007;8(2):R19.
28. Fink T, Lund P, Pilgaard L, Rasmussen JG, Duroux M, Zachar V. Instability of standard PCR reference genes in adipose-derived stem cells during propagation, differentiation and hypoxic exposure. BMC Mol Biol. 2008;9:98.
29. Wong ML, Medrano JF. Real-time PCR for mRNA quantitation. BioTechniques. 2005;39(1):75–85.