Kurpiers et al.EPJ Quantum Technology (2017) 4:8 DOI 10.1140/epjqt/s40507-017-0059-7
R E S E A R C H
Open Access
Characterizing the attenuation of coaxial
and rectangular microwave-frequency
waveguides at cryogenic temperatures
Philipp Kurpiers
*, Theodore Walter, Paul Magnard, Yves Salathe and Andreas Wallraff
*Correspondence:
[email protected] Department of Physics, ETH Zürich, Zürich, CH-8093, Switzerland
Abstract
Low-loss waveguides are required for quantum communication at distances beyond the chip-scale for any low-temperature solid-state implementation of quantum information processors. We measure and analyze the attenuation constant of commercially available microwave-frequency waveguides down to millikelvin temperatures and single photon levels. More specifically, we characterize the frequency-dependent loss of a range of coaxial and rectangular microwave waveguides down to 0.005 dB/m using a resonant-cavity technique. We study the loss tangent and relative permittivity of commonly used dielectric waveguide materials by measurements of the internal quality factors and their comparison with established loss models. The results of our characterization are relevant for accurately predicting the signal levels at the input of cryogenic devices, for reducing the loss in any detection chain, and for estimating the heat load induced by signal dissipation in cryogenic systems.
1 Introduction
Interconverting the quantum information stored in stationary qubits to photons and faith-fully transmitting them are two basic requirements of any physical implementation of quantum computation []. Coherent interaction of solid-state and atomic quantum de-vices with microwave photons has been experimentally demonstrated for quantum dot systems [–], individual electron spin qubits [], ensembles of electronic spins [], su-perconducting circuits [–] and Rydberg atoms [–].
In the field of circuit quantum electrodynamics, experiments show the ability to use single itinerant microwave photons [, ] or joint measurements [] to generate entan-glement between distant superconducting qubits []. In these probabilistic entanentan-glement schemes the entanglement generation rate is inversely proportional to the signal loss be-tween the two sites. Furthermore, entanglement can be generated deterministically by transmitting single microwave photons with symmetric temporal shape [] which can be emitted [, ] and reabsorbed with high fidelity []. However, the fidelity of the en-tangled state is dependent on the signal loss for most protocols. Therefore, the ability to transmit microwave photons with low loss, which we address in this manuscript, is es-sential for the realization of quantum computation with solid-state and atomic quantum systems.
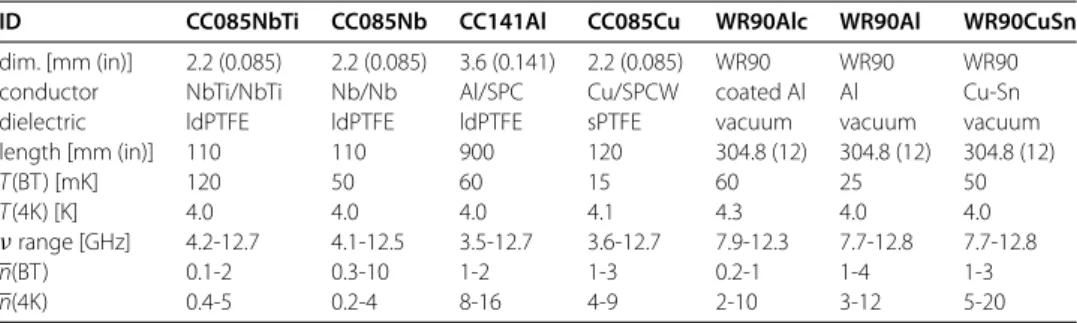
Table 1 Summary of waveguide and measurement parameters
ID CC085NbTi CC085Nb CC141Al CC085Cu WR90Alc WR90Al WR90CuSn
dim. [mm (in)] 2.2 (0.085) 2.2 (0.085) 3.6 (0.141) 2.2 (0.085) WR90 WR90 WR90 conductor NbTi/NbTi Nb/Nb Al/SPC Cu/SPCW coated Al Al Cu-Sn dielectric ldPTFE ldPTFE ldPTFE sPTFE vacuum vacuum vacuum length [mm (in)] 110 110 900 120 304.8 (12) 304.8 (12) 304.8 (12)
T(BT) [mK] 120 50 60 15 60 25 50
T(4K) [K] 4.0 4.0 4.0 4.1 4.3 4.0 4.0
νrange [GHz] 4.2-12.7 4.1-12.5 3.5-12.7 3.6-12.7 7.9-12.3 7.7-12.8 7.7-12.8
n(BT) 0.1-2 0.3-10 1-2 1-3 0.2-1 1-4 1-3
n(4K) 0.4-5 0.2-4 8-16 4-9 2-10 3-12 5-20
The indicated dimension (dim.) specifies the outer diameter of the coaxial cables and the EIA type of the rectangular waveguides. The conductor and dielectric materials are specified as well as the length of the resonant section employed for the measurements. The temperatureTmeasured at the waveguide is indicated. The average photon number on resonance is shown for the investigated frequency (ν) range.
In addition, studying the reduction of loss of superconducting waveguides has the poten-tial to contribute to improving the fidelity of qubit state measurements [] by minimizing the loss of the signal between the read-out circuit and the first amplifier []. Knowing the loss of microwave waveguides also enables more accurate estimates of the signal levels at the input of cryogenic devices and could be used to better evaluate the heat load induced by signal dissipation.
Previous studies of the attenuation constant were performed for different types of su-perconducting coaxial cables down to K by impedance matched measurements [–]. In those works, the attenuation constant is typically evaluated from measurements of the transmission spectrum of the waveguide, which is subsequently corrected for the attenua-tion in the interconnecting cables from room temperature to the cold stage in a reference measurement. In these studies lengths of the low-loss superconducting waveguides be-tween m and m were used for the measurements to be dominated by the device under test.
In this paper, we study the loss of coaxial cables and rectangular waveguides us-ing a resonant-cavity technique from which we extract attenuation constants down to . dB/m accurately between room and cryogenic temperatures at the tens of mil-likelvin level. By utilizing higher-order modes of these resonators we measure the fre-quency dependence of the attenuation for a frefre-quency range between . and . GHz at cryogenic temperatures only limited by the bandwidth of our detection chain. By com-paring our data to loss models capturing this frequency range we extract the loss tangent and relative permittivity of the dielectric and an effective parameter characterizing the conductor loss.
manu-Kurpiers et al.EPJ Quantum Technology (2017) 4:8 Page 3 of 15
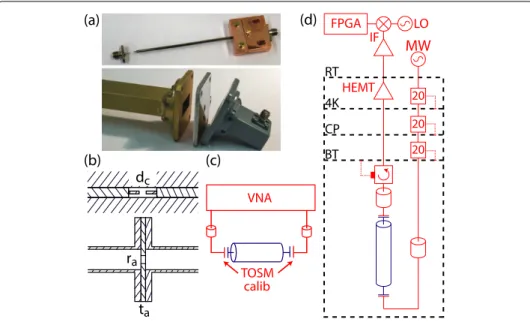
Figure 1 Overview of the experimental setup.Photographs(a)and schematics(b)of a capacitively coupled coaxial cable and an aperture coupled rectangular waveguide.(c)Schematic of the room
temperature setup using a vector network analyzer (VNA). A through-open-short-match (TOSM) calibration is used to account for loss and phase offsets in the interconnecting cables.(d)Schematic of the FPGA-based microwave setup [35] used for measurements at cryogenic temperatures.
factured by Micro-Coax, Inc. []. We investigate rectangular waveguides of type WR by Electronic Industries Alliance (EIA) standard with inner dimensions ofs= . mm, s= . mm (s= . in,s= . in) with a recommended frequency band of . to . GHz. Three different conductor materials are characterized: aluminum with chromate conversion coating per MIL-C-E, aluminum without further surface treatment and oxygen-free, high conductivity (OFHC) copper with tin (Sn wt%> .%) plating of thickness -μm on the inner surface. All three rectangular waveguides are manufactured by Penn Engineering Components, Inc. [].
2 Experimental setup
We construct resonators from coaxial cables and rectangular waveguides as shown in the photographs and schematics of Figure (a) and (b). For the coaxial cables we use sub-miniature version A (SMA) panel mount connectors and remove the outer conductor and dielectric material of the coaxial cable at both ends to realize a capacitive coupling between the center conductor of the cable and the connector. We choose a coupling capacitance to obtain largely undercoupled resonators (see Section and Appendix for details).
temperature of K, as specified by the manufacturer. After room temperature amplifica-tion and demodulaamplifica-tion, the signal is digitized and the amplitude is averaged using a field programmable gate array (FPGA) with a custom firmware.
The waveguides are characterized at a nominal temperature of K (K) using the pulse tube cooler of a cryogen-free dilution refrigerator system in which also the millikelvin tem-perature (BT) measurements are performed. We thermally anchor the waveguides to the base plate of the cryostat using OFHC copper braids and clamps. The actual waveguide temperatures are extracted in a measurement of the resistance of a calibrated ruthenium oxide (RuO) sensor mounted at the center of the coaxial cables or at the end of the rect-angular waveguides and are listed in Table .
For the measurements at base temperature BT (∼ mK) it proved essential to carefully anchor all superconducting waveguide elements at multiple points to assure best possible thermalization. The measured temperatures listed in Table are found to be significantly higher than the BT specified above. We attribute the incomplete thermalization of the superconducting waveguides to the small thermal conductivity of the employed materials below their critical temperatureTc[]. We note that when using only a minimal set of anchoring points, we observed even higher temperatures.
3 Measurements of the attenuation constant
3.1 Illustration of the measurement technique
To illustrate the resonant-cavity technique for extracting the attenuation constant of a waveguide we discuss a calibrated S-parameter measurement at RT for the coaxial line CCAl (Table ). The measured transmission spectrum|S(ν)|exemplifies the peri-odic structure of higher-order modes for mode numbersnbetween and (Figure ). We extract the resonance frequencyνnand the external and internal quality factor,Qeand Qi, for each modenby fitting the complex transmission coefficient of a weakly coupled parallel RLC circuit (see Appendix ) to the data in a finite bandwidth around eachνn (Fig-ure ). We observe a decreasing insertion loss on resonanceIL(νn) = –log|S(νn)|dB (dashed line in Figure (a)) with increasing frequency due to the increase of the effective capacitive coupling strength. We choseIL(νn) > dB to ensure the largely undercoupled regime (QeQi) over the entire frequency range. In this regime,Qiis well approximated by the loaded quality factorQlaccording to /Qi= /Ql– /Qe≈/Ql. In our experiments we assure thatQe> Qifor all frequencies and temperatures.
Under this condition it is sufficient to extractQlfor each modenfrom
S(ν)=
Smaxn
+ (ν/νn– )Ql
+C+Cν ()
neglecting the specific value of the insertion loss (Smax
n is a free scaling factor).C, C account for a constant offset and a linear frequency dependence in the background [] most relevant for measurements of low quality factors (<) resonances.
3.2 Analysis of coaxial lines
Kurpiers et al.EPJ Quantum Technology (2017) 4:8 Page 5 of 15
Figure 2 Exemplary waveguide resonator transmission spectra at room temperature. (a)Transmission coefficient|S21|2versus frequencyνfor CC141Al at RT. The dashed line indicates the frequency-dependent
insertion loss on resonanceIL(νn).|S21|2of(b)the first 6 measured modes and(c)6 modes around 8 GHz as
indicated by the dashed boxes in (a).
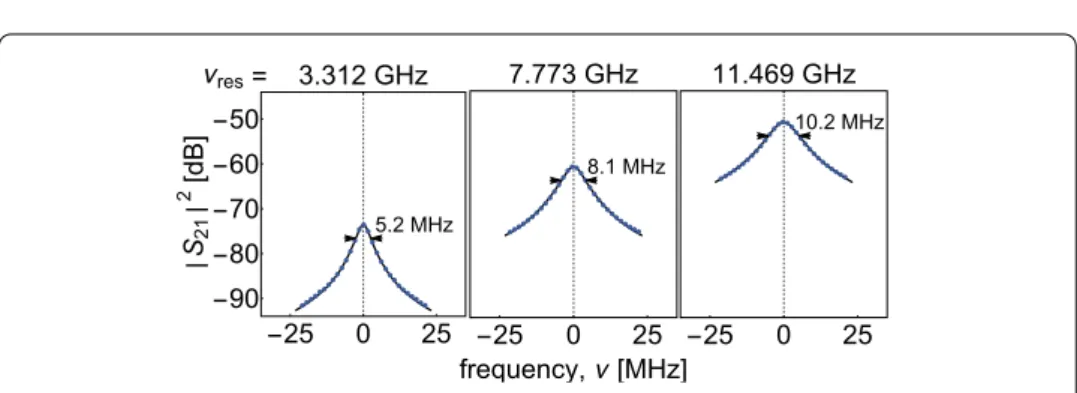
Figure 3 Illustration of analysis procedure for representative modes.Absolute value squared of the measured transmission|S21|2(dots) versus frequencyνat the indicated resonances for CC141Al (RT) and
modes numbersn={26, 61, 90}. The arrows indicate the full width at half maximum from which we extracted Qi.νresis the center frequency of the resonance. The line is the absolute value squared of the simultaneous fit
of the real and imaginary part of theS21scattering parameter (see Appendix 2 for details).
fundamental frequencyνof a low-loss transmission line resonator is given by
ν= c √
r
l ()
with the length of the resonatorl, the relative permittivity of the dielectricrand the speed of light in vacuumc. The internal quality factorQi[]
Qi= nπ
is inversely proportional toα
α=αc+αd= gc√r
μc Rs(ν) +
π√r
c ν tanδ. ()
αcan be written as a sum of conductor lossαcand dielectric lossαdwith the vacuum permeabilityμ, a frequency dependent surface resistanceRs(ν), a geometric constantgc and the frequency independent loss tangent of the dielectric materialtanδ. For a coaxial linegcis (/a+ /b)/ln(b/a) with the radius of the center conductoraand the inner radius of the outer conductorb. To characterize the conductor loss of coaxial cables combining different materials for the center and outer conductors we introduce an effective surface resistanceRs(see Appendix ). Inserting Eq. () into Eq. () leads to
Qi(νn) =
gc π μ
Rs(νn)
νn +tanδ
, ()
which is independent ofr. Therefore,ris extracted from the fundamental frequency of the resonatorνandRs(ν) andtanδfrom measurements ofQi(ν).
The surface resistance of a normal conductorRnc
s (ν) is proportional to
√
ν and to the direct current (dc) conductivity /√σ []. The theory of the high-frequency dissipation in superconductors [–] shows a quadratic dependence ofRsc
s(ν).
The measured external quality factors at RT (Figure (b) and Figure (b)) are in good agreement with the ones expected for a capacitively coupled transmission line []
Qe(νn) = Cll πC
cRl
νn
+RlCllπ
νn, ()
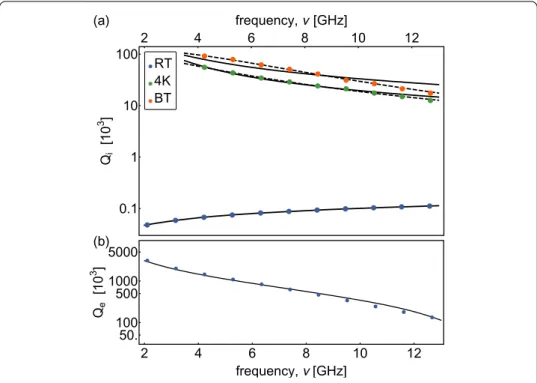
with the capacitance per unit lengthCl, the real part of the load impedanceRland the coupling capacitanceCcused as fit parameters. An interpolation of theQemeasurements is used in the K and BT measurements to estimate the average number of photons stored in the waveguide on resonance at each moden(Table ).
The frequency dependence of the measured quality factors for CCAl presented in Figure (a) shows the expected√νdependence considering an effective conductivity of the outer and center conductor following the skin effect model of normal conductor. This suggests thatαcis mainly limited by the normal conducting SPC center conductor. The dielectric loss limit ofQiis determined to be approximately ×at BT, see Table .
Following the same measurement procedure, we extract the quality factor of low-loss superconducting cables (e.g. see Figure for CCNbTi). The measured internal qual-ity factors of CCNbTi at the K and BT, ranging from ×to ×, decrease approximately∝ν (solid line) with a small deviation at higher frequencies. We obtain a better fit assuming a power law dependence ofRsc
Kurpiers et al.EPJ Quantum Technology (2017) 4:8 Page 7 of 15
Figure 4 Frequency and temperature dependence of quality factors of aluminum coaxial line CC141Al. (a)Measured internal (Qi) and(b)external quality factors (Qe) of coaxial line CC141Al versus
frequencyνextracted from the spectra measured at RT (blue dots), at 4K (green dots) and BT (orange dots). The black lines are fits to the loss model discussed in the text.
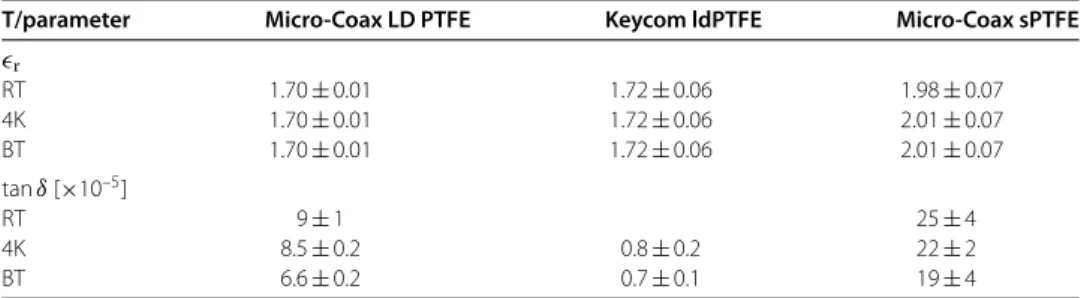
Table 2 Summary of the extracted relative permittivitiesrand loss tangents tanδof the
tested dielectric materials
T/parameter Micro-Coax LD PTFE Keycom ldPTFE Micro-Coax sPTFE
r
RT 1.70±0.01 1.72±0.06 1.98±0.07
4K 1.70±0.01 1.72±0.06 2.01±0.07
BT 1.70±0.01 1.72±0.06 2.01±0.07
tanδ[×10–5]
RT 9±1 25±4
4K 8.5±0.2 0.8±0.2 22±2
BT 6.6±0.2 0.7±0.1 19±4
The methods used for the extraction of these parameters are discussed in the text.
conductor coaxial cable (CCSS) at RT, approximately K (LN) and . K (LHe) de-scribed in Appendix .
We extract the relative permittivitiesrfrom Eq. () and the loss tangenttanδfrom fitting Eq. () to the measuredQi(ν) for each coaxial cable (Table ). The values for the Micro-Coax ldPTFE are determined from CCAl measurements, for the Micro-Micro-Coax sPTFE from CCCu and for the Keycom ldPTFE from CCNbTi and CCNb measure-ments. We extracttanδ of the Keycom ldPTFE from the fit assumingRsc
Figure 5 Frequency and temperature dependence of quality factors of niobium-titanium coaxial line CC085NbTi. (a)Measured (Qi) internal and(b)external quality factors (Qe) of coaxial line CC085NbTi versus
frequencyνextracted from the spectra at RT (blue dots), at 4K (green dots) and BT (orange dots). The solid (dashed) black lines are fits to the loss model which assumesRsc
s(ν)∝ν2(Rscs(ν)∝νp).
Keycom differ by a factor of∼.ris found to be∼. for ldPTFE and∼ for sPTFE and is nearly temperature independent.
3.3 Analysis of rectangular waveguides
We performed similar measurements with three different rectangular waveguides of type WR (see Table ). We use an aperture coupling approach by installing two aluminum plates (thicknessta= mm) at both ends with a circular aperture (radiusra= . mm for WRAlc andra= . mm for WRAl and WRCuSn) in the center (Figure ) result-ing in inductively coupled rectangular D cavities []. The couplresult-ing strength depends on raandtaof the aperture plates. We perform finite element simulation to estimate the cou-pling (for details see Appendix ) and determine the attenuation constant of the rectangu-lar waveguides by a measurement of its internal quality factor. For rectangurectangu-lar waveguide cavities the frequencies of the transverse electric modes TEkare given by
νk= c
s
+k
l ()
with length of the longer transverse dimension of the rectangular waveguidesand the length of the cavityl. The frequency dependent internal quality factor is []
QTEk(νk)
=s
slπ μνk Rs(νk)
cs
(l–s) + s(s+l)νk
Kurpiers et al.EPJ Quantum Technology (2017) 4:8 Page 9 of 15
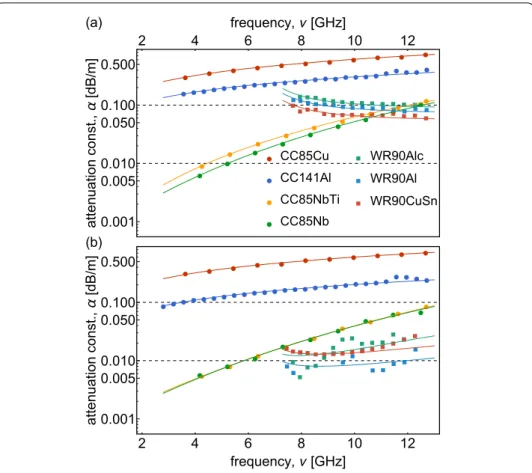
Figure 6 Comparison of measured attenuation constants.Attenuation constantα(dots) extracted from measurements at frequencyνfor CC085Cu, CC141Al, CC085NbTi, CC085Nb, WR90Alc, WR90Al and WR90CuSn.(a)shows the measurement results at approximately 4 K and(b)the measurement results at BT. The attenuation constantαis plotted in dB/m in a log-plot to cover the full range of measured losses. The solid lines are calculated from the fits toQimeasurements using the same model as for the data.
with the length of the shorter transverse dimension of the rectangular waveguides. In-verting Eq. () we extract the surface resistanceRs(νk) from a measurement ofQTEk(νk)
which we use to calculate the attenuation constant of the TE mode of a rectangular waveguide
αTE(ν) =
Rs(ν) ssμc
sc+ sν
ννs –c
. ()
Using this model we extract the attenuation constant of the rectangular waveguides, ranging from . dB/m to . dB/m at K and . dB/m to . dB/m at BT, and determine the frequency dependence of the internal quality factor. For the rectangular waveguides in the normal state at K we find good agreement to the theoretical model by considering the normal state surface resistanceRnc
s (ν)∝
√
ν. At BT in the supercon-ducting state a surface resistance Rsc
4 Conclusions
We have presented measurements of the attenuation constant of commonly used, com-mercially available low-loss coaxial cables and rectangular waveguides down to millikelvin temperatures in a frequency range between . and . GHz. We have performed mea-surements of attenuations constants down to . dB/m using a resonant-cavity tech-nique at cryogenic temperatures. In this method, we employ weak couplings to the waveg-uides resulting in resonant standing waves and measure their quality factors. We have extracted the loss tangent and relative permittivity of different dielectric materials by com-paring our measurement results to existing loss models. The frequency dependence of the internal quality factors of the normal conducting waveguides are well described by the loss model, while the tested CCNbTi and CCNb show small deviations from the predic-tions for the high-frequency dissipation in superconductors [, ]. We have also studied the power dependence of the attenuation constant which we find to be independent of the input power in a range from – to – dBm (see Appendix ).
Our results indicate that transmitting signals on a single photon level is feasible within laboratory distances, e.g. % of the signal can be transmitted over distances of m using commercial rectangular waveguides or m using coaxial cables. Furthermore, we find no significant dependence of the attenuation constants on the ambient residual magnetic fields in measurements performed with and without cryoperm magnetic shielding (see Appendix ).
Comparing our results to recent measurements of high quality D cavities [] with quality factors up to ×indicate that improving the surface treatment of rectangular waveguides may lead to a even lower attenuation constant of rectangular waveguides down to∼–dB/m. Furthermore, our measurements show that the loss tangenttanδstrongly dependents on the PTFE composite wheretan δ∼×–of PTFE have been reported at cryogenic temperatures [, ] about a factor of lower than those measured here. This suggests that the loss of superconducting coaxial cables may also be further reduced.
Appendix 1: Characterization of the input/output coupling
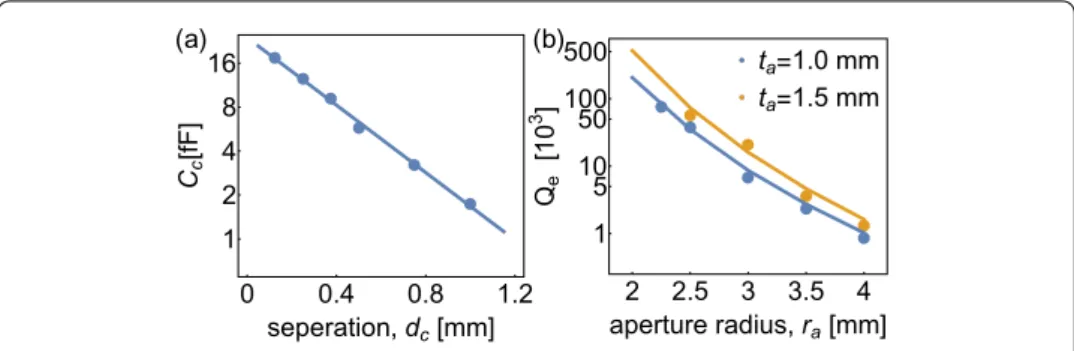
We extract the coupling capacitanceCcbetween the input coupler and the center con-ductor of the coaxial line CCCu from a fit of the measured transmission spectrum to an ABCD transmission matrix model. We findCcto decrease exponentially with the separationdc, see Figure and solid line in Figure (a).
We determine the external quality factorQeof an aperture coupled D cavity with res-onance frequencyν= . GHz in dependence on the coupling wall thicknesstaand the radius of the circular aperturera(Figure ). We find good agreement between the mea-suredQeand the one extracted from finite-element simulations [], Figure (b).
By changing the geometry of the described couplers, the coupling of both coaxial cables and rectangular waveguides can be tuned by orders of magnitude which is sufficient to fulfill the conditionQeQito extractQiprecisely.
Appendix 2: Weakly coupled parallel RLC circuit
Kurpiers et al.EPJ Quantum Technology (2017) 4:8 Page 11 of 15
Figure 7 Extraction of coupling strengths for coaxial and waveguide resonators. (a)Coupling capacitanceCc(dots) obtained from an ABCD transmission matrix model fit to the measured spectrum versus
the distancedcbetween the center conductors of CC085Cu. The solid line is an exponential fit to the data.
(b)MeasuredQeof theTE101mode of a 3D cavity aperture coupled to a rectangular waveguide. The solid
line is obtained from a finite element simulation.
complex transmission coefficient
S(ν) =
+Qe/Qi+ iQe(ν/νn– ) +X
eiφ ()
of a weakly coupled parallel RLC circuit []. HereXis a complex constant which accounts for impedance mismatches in the SMA panel mount connectors andeiφis a rotation of
the data relative to the measurement plane [, ].
Appendix 3: Attenuation constant of low-loss coaxial cables
We state the derivation of the attenuation constant of a low-loss transmission line based on Ref. []. The equivalent circuit parameters (self-inductance per unit lengthLl, capac-itance per unit lengthCl, series resistance per unit lengthRland shunt conductance per unit lengthGl) can be derived from the electric and magnetic field of the transmission line
Ll=
μ
πlnb/a,
Cl= π r
lnb/a,
Rl= π
Ra s a +
Rb s b
,
Gl=
π ωr tanδ
lnb/a .
()
The complex propagation constant
γ =α+iβ=(Rl+iωLl)(Gl+iωCl) ()
can be approximated for small conductorRlωLland dielectric lossGlωClby
γ ≈iωLlCl
– i
Rl Z
+GlZ
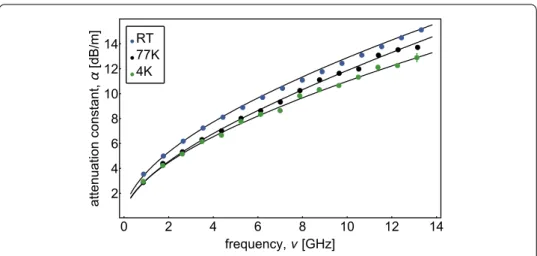
Figure 8 Frequency and temperature dependence of attenuation constant of stainless steel coaxial line CC085SS.Measured attenuation constantα(dots) versus frequencyνfor a CC085SS at RT,
approximately 77 K (LN2), 4 K (LHe). The black lines are calculated from fits to the measuredQiusing the
model of Eq. (5) as described in the main text.
with the characteristic impedance of the lineZ=
√
Ll/Cl, so that
β=ωLlCl=
ω√r
c , ()
α=
Rl Z
+GlZ
= √
r clnb/a
Ra s a +
Rb s b
+π ν √
r c tanδ
= Rs √
r clnb/a
a+
b
+π ν √
r
c tanδ. ()
In the last step we introduced an effective surface resistanceRs=Ras=Rbs to characterize the conductor loss. This is necessary, since we cannot distinguish the contributions of the different materials of the center and outer conductors to the total conductor loss in our data.
Appendix 4: Attenuation constant of CC085SS
We evaluate the loss of a . mm (. in) diameter stainless steel outer and center con-ductor coaxial cable (CCSS) typically used in cryogenic applications where loss is of little concern, i.e. in input drive lines. At RT, approximately K (LN) and . K (LHe), the cable manufactured by Micro-Coax, Inc. [] shows the expected frequency depen-dent attenuation∝√νof a normal conductor decreasing with temperature (Figure ). For example, we extract attenuation constants at GHz of . dBm/m (RT), . dBm/m (LN) and . dBm/m (LHe).
Appendix 5: Power dependence of the attenuation constant
Kurpiers et al.EPJ Quantum Technology (2017) 4:8 Page 13 of 15
Figure 9 Power dependence of the attenuation constant of niobium-titanium coaxial line CC085NbTi. Attenuation constantα(dots) versus input power at the waveguidePinmeasured for frequencies between
4.2 GHz and 12.7 GHz. The top axis indicates the average number of photons on resonancen.
Figure 10 Attenuation constants extracted with and without magnetic shielding.Comparison of the attenuation constants measured at 4K and BT with and without cryoperm magnetic shielding for CC085NbTi. The solid lines are extracted from fits to the measured quality factors according to the model of Eq. (5).
resonance inside the resonator of to . and an average resonator voltageV / of approximately –to –V (Figure ). Our voltage range is comparable to that of Ref. [] in which a clear power dependence for SiOand SiNxdielectric materials is observed and explained by the loss due to the coupling of microscopic two level systems (TLS) to the electromagnetic field within the resonator []
δTLS(Pr) =
δTLS
√
+Pr/Pc
()
Appendix 6: Dependence on ambient magnetic field
We compare the extracted attenuation constants of CCNbTi cables within (length mm) and without (length mm) a cryoperm magnetic shield and find no signifi-cant effect at K and BT (Figure ). Since we expect the internal loss to be the sum of the individual loss contributions we argue that the measured attenuation constants are not limited by an ambient magnetic field which is believed to be dominated by the isolators installed at the BT stage of the used dilution refrigerator system.
Competing interests
The authors declare that they have no competing interests.
Authors’ contributions
The design of the experiment was developed by PK and AW. The experiments were performed by PK, TW and PM. The data was analyzed and interpreted by PK, TW and YS. The FPGA firmware was implemented and its operation overseen by YS. The manuscript was written by PK and AW. All authors commented on the manuscript. The project was led by AW. All authors have read and approved the final manuscript.
Acknowledgements
The authors thank Tobias Frey, Silvia Ruffieux and Maud Barthélemy for their contributions to the measurements, Oscar Akerlund for his support with the numerical integration, Christopher Eichler for discussing the manuscript and Keycom Corporation for providing superconducting coaxial cables. This work is supported by the European Research Council (ERC) through the “Superconducting Quantum Networks” (SuperQuNet) project, by National Centre of Competence in Research “Quantum Science and Technology” (NCCR QSIT), a research instrument of the Swiss National Science Foundation (SNSF), by the Office of the Director of National Intelligence (ODNI), Intelligence Advanced Research Projects Activity (IARPA), via the U.S. Army Research Office grant W911NF-16-1-0071 and by ETH Zurich. The views and conclusions contained herein are those of the authors and should not be interpreted as necessarily representing the official policies or endorsements, either expressed or implied, of the ODNI, IARPA, or the U.S. Government. The U.S. Government is authorized to reproduce and distribute reprints for Governmental purposes notwithstanding any copyright annotation thereon.
Endnotes
a Per the standard specification for silver-coated soft or annealed copper wire (ASTM B-298). b Per the standard specification for silver-coated, copper-clad steel wire (ASTM B-501).
Publisher’s Note
Springer Nature remains neutral with regard to jurisdictional claims in published maps and institutional affiliations.
Received: 2 March 2017 Accepted: 4 April 2017 References
1. DiVincenzo DP. Fortschr Phys. 2000;48:771.
2. Petta JR, Johnson AC, Taylor JM, Laird EA, Yacoby A, Lukin MD, Marcus CM, Hanson MP, Gossard AC. Science. 2005;309:2180.
3. Frey T, Leek PJ, Beck M, Blais A, Ihn T, Ensslin K, Wallraff A. Phys Rev Lett. 2012;108:046807.
4. Maune BM, Borselli MG, Huang B, Ladd TD, Deelman PW, Holabird KS, Kiselev AA, Alvarado-Rodriguez I, Ross RS, Schmitz AE, Sokolich M, Watson CA, Gyure MF, Hunter AT. Nature. 2012;481:344.
5. Delbecq MR, Schmitt V, Parmentier FD, Roch N, Viennot JJ, Fève G, Huard B, Mora C, Cottet A, Kontos T. Phys Rev Lett. 2011;107:256804.
6. Pla JJ, Tan KY, Dehollain JP, Lim WH, Morton JJL, Jamieson DN, Dzurak AS, Morello A. Nature. 2012;489:541. 7. Kubo Y, Ong FR, Bertet P, Vion D, Jacques V, Zheng D, Dréau A, Roch J-F, Auffeves A, Jelezko F, Wrachtrup J, Barthe MF,
Bergonzo P, Esteve D. Phys Rev Lett. 2010;105:140502.
8. Chiorescu I, Bertet P, Semba K, Nakamura Y, Harmans CJPM, Mooij JE. Nature. 2004;431:159.
9. Wallraff A, Schuster DI, Blais A, Frunzio L, Huang R-S, Majer J, Kumar S, Girvin SM, Schoelkopf RJ. Nature. 2004;431:162. 10. Devoret M, Schoelkopf RJ. Science. 2013;339:1169.
11. Hagley E, Maitra X, Nogues G, Wunderlich C, Brune M, Raimond JM, Haroche S. Phys Rev Lett. 1997;79:1. 12. Raimond JM, Brune M, Haroche S. Rev Mod Phys. 2001;73:565.
13. Haroche S, Raimond J-M. Exploring the quantum: atoms, cavities, and photons. New York: Oxford University Press; 2006.
14. Hogan SD, Agner JA, Merkt F, Thiele T, Filipp S, Wallraff A. Phys Rev Lett. 2012;108:063004. 15. Eichler C, Bozyigit D, Lang C, Steffen L, Fink J, Wallraff A. Phys Rev Lett. 2011;106:220503. 16. Eichler C, Lang C, Fink JM, Govenius J, Filipp S, Wallraff A. Phys Rev Lett. 2012;109:240501.
17. Roch N, Schwartz ME, Motzoi F, Macklin C, Vijay R, Eddins AW, Korotkov AN, Whaley KB, Sarovar M, Siddiqi I. Phys Rev Lett. 2014;112:170501.
18. Narla A, Shankar S, Hatridge M, Leghtas Z, Sliwa KM, Zalys-Geller E, Mundhada SO, Pfaff W, Frunzio L, Schoelkopf RJ, Devoret MH. Phys Rev X. 2016;6:031036.
Kurpiers et al.EPJ Quantum Technology (2017) 4:8 Page 15 of 15
20. Pechal M, Huthmacher L, Eichler C, Zeytino ˘glu S, Abdumalikov A Jr., Berger S, Wallraff A, Filipp S. Phys Rev X. 2014;4:041010.
21. Zeytinoglu S, Pechal M, Berger S, Abdumalikov AA Jr., Wallraff A, Filipp S. Phys Rev A. 2015;91:043846.
22. Wenner J, Yin Y, Chen Y, Barends R, Chiaro B, Jeffrey E, Kelly J, Megrant A, Mutus J, Neill C, O’Malley P, Roushan P, Sank D, Vainsencher A, White T, Korotkov AN, Cleland A, Martinis JM. Phys Rev Lett. 2014;112:210501.
23. Macklin C, O’Brien K, Hover D, Schwartz ME, Bolkhovsky V, Zhang X, Oliver WD, Siddiqi I. Science. 2015;350:307. http://www.sciencemag.org/content/350/6258/307.full.pdf.
24. McCaa WD, Nahman NS. J Appl Phys. 1969;40:2098.
25. Ekstrom MP, McCaa WD, Nahman NS. IEEE Trans Nucl Sci. 1971;18:18. 26. Chiba N, Kashiwayanagi Y, Mikoshiba K. Proc IEEE. 1973;61:124.
27. Giordano S, Hahn H, Halama H, Luhman T, Bauer W. IEEE Trans Magn. 1975;11:437. 28. Mazuer J. Cryogenics. 1978;18:39.
29. Peterson GE, Stawicki RP. J Am Ceram Soc. 1989;72:704.
30. Kushino A, Kasai S, Kohjiro S, Shiki S, Ohkubo M. J Low Temp Phys. 2008;151:650. 31. Kushino A, Teranishi Y, Kasai S. J Supercond Nov Magn. 2013;26:2085. 32. Keycom characteristic technologies. 2016. Accessed: 2016-05-18.
33. Cable manufacturers, cable assemblies - micro-coax, inc. 2016. Accessed: 2016-05-18 34. Penn engineering components: waveguide specialists. 2016. Accessed: 2016-05-18
35. Lang C. Quantum microwave radiation and its interference characterized by correlation function measurements in circuit quantum electrodynamics [Ph.D. thesis]. Zurich: ETH; 2014.
36. Pobell F. Matter and methods at low temperatures. 3rd ed. Berlin: Springer; 2006. 37. Petersan PJ, Anlage SM. J Appl Phys. 1998;84:3392.
38. Pozar DM. Microwave engineering. Hoboken: Wiley; 2012.
39. Tinkham M. Introduction to superconductivity. 2nd ed. Mineola: Dover; 2004. 40. Mattis DC, Bardeen J. Phys Rev. 1958;111:412.
41. Kose V. Superconducting quantum electronics. Berlin: Springer; 1989.
42. Gao J. The physics of superconducting microwave resonators [Ph.D. thesis]. California Institute of Technology; 2008. 43. Göppl M, Fragner A, Baur M, Bianchetti R, Filipp S, Fink JM, Leek PJ, Puebla G, Steffen L, Wallraff A. J Appl Phys.
2008;104:113904.
44. Collin R. Field theory of guided waves. New York: IEEE Press; 1991.
45. Reagor M, Paik H, Catelani G, Sun L, Axline C, Holland E, Pop IM, Masluk NA, Brecht T, Frunzio L, Devoret MH, Glazman LI, Schoelkopf RJ. Appl Phys Lett. 2013;102:192604.
46. Geyer RG, Krupka J. IEEE Trans Instrum Meas. 1995;44:329.
47. Jacob MV, Mazierska J, Leong K, Krupka J. IEEE Trans Microw Theory Tech. 2002;50:474. 48. COMSOL4.3. Comsol multiphysics®v. 4.3, 2012.
49. Leong K, Mazierska J. IEEE Trans Microw Theory Tech. 2002;50:2115.
50. Probst S, Song FB, Bushev PA, Ustinov AV, Weides M. Rev Sci Instrum. 2015;86:024706.
51. Martinis JM, Cooper KB, McDermott R, Steffen M, Ansmann M, Osborn KD, Cicak K, Oh S, Pappas DP, Simmonds RW, Yu CC. Phys Rev Lett. 2005;95:210503.
52. Goetz J, Deppe F, Haeberlein M, Wulschner F, Zollitsch CW, Meier S, Fischer M, Eder P, Xie E, Fedorov KG, Menzel EP, Marx A, Gross R. J Appl Phys. 2016;119:015304. doi:10.1063/1.4939299.
53. Von Schickfus M, Hunklinger S. Phys Lett A. 1977;64:144.