Abstract—In this paper, a lab-scale aerated vessel equipped with a surface aeration impeller was developed to examine standard aeration efficiency (SAE) and mixing time. The SAE and mixing specifications were investigated via variations in the operating parameters, such as rotor speed, impeller immersion depth and water height. Surface aeration was performed using a Rushton disk turbine. Results showed that variation of impeller immersion depth has a greater effect on SAE compare to changes in water level. Moreover, SAE increases with rotor speed up to about 150 to 200 rpm and then decrease. In addition, mixing time is reduced with increase in rotor speed. According to the Response surface methodology (RSM) statistical optimization, optimum values of 169 rpm, 25 mm and 30 cm were found for rotor speed, impeller immersion depth and water height respectively in the range of this study to achieve the maximum value of SAE.
Index Terms—Mixing time, optimization, response surface methodology, standard aeration efficiency, surface aeration.
I. INTRODUCTION
At the beginning of the 20th century, activated sludge systems were developed into an economically viable secondary treatment method. In activated sludge systems, aeration is employed. The primary function of aeration process is to provide oxygen for the aerobic micro-organisms which convert the biodegradable fraction of the waste into simpler organic or inorganic compounds [1], [2]. As excess treatment obligations are imposed, considerations for energy demand and conservations also increases through wastewater treatment plants (WWTPs). Furthermore, it has been estimated that the aeration process consumes more than half of the whole power requirements in WWTPs [3]. Therefore, increase of the gas-liquid oxygen transfer is considerably favorable for convenient energy utilization in wastewater treatment processes [4], [5].
To date, various types of aerators, such as: spray nozzles, cascade aerators, bubble or diffused aerators and surface aerators are used in practice. However, surface aerators are more popular due to their ease of operation and comparative efficiency [3], [6]. Surface aerators are extensively used for the treatment of wastewater by biological oxidation.
Meanwhile, in many cases, especially in wastewater
Manuscript received August 9, 2014; revised October 11, 2014. A. Mohammadpour, M. A. Akhvan-Behabadi, and M. Ebrahimzadeh are with the School of Mechanical Engineering, University of Tehran, Tehran, Iran (e-mail: [email protected], [email protected], [email protected]).
M. Nosrati is with the Chemical Engineering Department, Biotechnology Group, Tarbiat Modares University, Tehran, Iran (corresponding author; e-mail: [email protected]).
A. R. MajdiNasab is with the Chemical Engineering Department, Tarbiat Modares University, Tehran, Iran (e-mail: [email protected]).
treatment by aerated lagoons or those processes deal with nitrogen removal, the fluid mixing must be improved; while power consumption and oxygenation are moderately controlled. In these cases achieving high aeration or oxygen mass transfer ( ) is not the last target, but the minimization of power consumption is very important [7], [8].
The efficiency of surface aeration systems is evaluated in terms of their oxygen transfer rate and power consumption. Hence, the selection of a particular surface aeration system relies on its energy consumption coupled with the efficiency of its oxygen transfer rate [9], [10]. Therewith, it is necessary to study and analyze the relative performance of these aerators.
There are several factors that influence the mixing, oxygen transfer and energy consumption. Some of these parameters are rotational speed, size and shape of the impeller, immersion depth of the impeller, the geometry of the tank and water height, as well as physical, chemical and biological characteristics of water [11]. In this study, some of the above mentioned parameters have been investigated and optimized. To the knowledge of the authors, there is limited information available in the literature regarding the statistical optimization of hydrodynamics and mass transfer in surface aerated processing systems. Statistical experimental design, including RSM is able to optimize all of the pertinent parameters, omitting restrictions of a single-factor optimization process. Thereby, this method provides visual interpretation of the functional relations between the response and experimental variables. RSM assists in evaluating the main factors in the construction of models to investigate the interaction among variables and in selecting the optimum values of favorable responses and variables [12]. In the recent years, RSM has been applied to analyze, optimize and evaluate interactive effects of independent factors in numerous chemical, biochemical and bioenvironmental processes [13], [14].
In order to achieve an efficient performance in WWTPs, aeration with low energy consumption, sufficient mixing conditions and favorable oxygen transfer rate are highly required. Therefore, the main objective of this study is to optimize rotor speed, impeller immersion depth and water height values by maximizing SAE using RSM.
II. MATERIALS AND METHODS A. Reactor Configuration and Start-up
The main components of the surface aerator are the tank and the impeller. The experiments were carried out in a square tank equipped with one Rushton disk turbine (six flat blade in symmetrical). Tank and impeller were constructed in glass and stainless steel, respectively. The experimental
Evaluation and Optimization of Efficiency and Mixing
Time in a Surface Aeration Tank
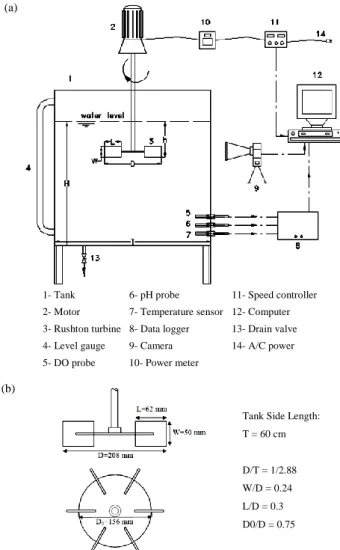
set-up used in this investigation with geometrical specifications of the Rushton disk turbine is shown schematically in Fig. 1. The medium employed in the experiments was tap water at 20-22°C. In each experiment, water height, rotor speed and impeller immersion depth were adjusted at the desired values and then the experiments were conducted. The power, temperature, pH and dissolved oxygen (DO) values were measured and recorded during the tests, continuously.
(a)
11- Speed controller 6- pH probe
1- Tank
12- Computer 7- Temperature sensor
2- Motor
13- Drain valve 8- Data logger
3- Rushton turbine
14- A/C power 9- Camera
4- Level gauge
10- Power meter 5- DO probe
(b)
Tank Side Length:
T = 60 cm
D/T = 1/2.88
W/D = 0.24
L/D = 0.3
D0/D = 0.75
Fig. 1. Schematic and geometrical specifications of: (a) Experimental set-up (b) Rushton disk turbine.
B. Mixing Time Measurement
The mixing time was measured using the pH-response technique [15], [16]. The mixing time is defined as the time that the system requires to mix to a prescribed final state of mixture represented by the degree of homogeneity. The homogeneity is defined as:
( ) ( ⁄ ) (1)
where ( and are the initial and the final pH values).
A pulse input of tracer (sodium hydroxide solution-2 M NaOH) was injected into the tank by a syringe in less than 1 second. The tracer was injected at the top of the tank 2 cm under the liquid surface and opposite side of the pH electrode. The pH electrode was placed 5 cm from the tank bottom. The pH values were recorded continuously during the tests. Each
mixing time experiment was repeated at least 3 times and their averages have been reported. Because the density of tracer solution and liquid was similar, the tracer solution followed the liquid flow streams and there were no errors due to tracer buoyancy.
C. Power Consumption
The impeller shaft was driven by a 0.25 kW electric motor. The motor was connected to an inverter (that had an output signal in mA) and then to a computer in order to adjust and record the impeller’s rotational speed. In the present research, the value of power was measured by an electrical measurement method using the accurate wattmeter.
In the electrical motors there are always some power losses (in bearings, seals and the motor itself) which should be subtracted from the total power input to obtain the shaft delivery power [17]. The power available at the shaft or net delivered power to fluid (P) was computed from Eq. (2):
(2)
where and are respectively input power of the motor in the absence of fluid and with fluid.
D. Determination of Oxygen Mass Transfer Coefficient and Efficiency
According to two-film theory, the rate of oxygen transfer and the volumetric oxygen transfer coefficient at T(°C) are given by Eq. (3) and (4):
⁄ ( )
(3) [ ( ) ( )] (4) where is the dissolved oxygen (DO) concentration in fluid at time t, is DO concentration in fluid at time “0” and is saturation concentration of oxygen. was measured by allowing aeration to proceed until a constant value had been reached. The value of can be corrected for a temperature other than the standard temperature of 20°C as
, by using the Vant-Hoff Arrhenius equation:
( ) (5)
where θ (the temperature coefficient) is equal to 1.024 for pure water.
Based on the obtained volumetric oxygen transfer coefficient, standard oxygen transfer rate (SOTR) is calculated using Eq. (6):
(6)
where V is the volume of water in the tank with aerator turned off and is saturation concentration of oxygen at 20°C
and 1 atm.
SAE or rate of oxygen transfer per unit power input is an important factor to compare the operation and efficiency of different kind of aerators. SAE is computed from Eq. (7):
considered as power.
The DO values were recorded continuously during the tests. All procedures of determining the mass transfer coefficient and efficiency were performed according to ASCE/EWRI 2-06 standard [18].
E. Experimental Design
The experimental design was carried out using Design-Expert 7.0 Software; Windows-compatible software prepares desirable design of experiments (DOE) for the recognition of essential factors that have a vital influence on the process and that use of RSM to distinguish optimal operational conditions.
Empirical models expressing the experimental results were extended using data collected from the designed experiments and were produced using the least-squares method. A three variable distance-based experimental design, including one numerical factor (rotor speed) and two categorical factors (water height and immersion depth) was performed to optimize the parameters and involved a total number of 44 experimental runs. Factor rotor speed was examined in the range between 50-300 rpm. Further, factors water height and immersion depth were defined at 4 and 6 categorical levels, respectively. The experimental range and the levels of the variables are shown in Table I.
Using these data, sufficient information can be produced in a fit second-order polynomial called "quadratic”. Standard statistical software can calculate the actual fitness of the model. Using experimental design based on RSM, the optimum aeration condition having desirable oxygen transfer efficiency can be obtained with minimum number of experiments without requirement to study all possible combinations experimentally.
TABLEI:EXPERIMENTAL RANGE AND LEVELS OF INDEPENDENT TEST VARIABLES
Categorical factors Number of levels
1 2 3 4 5 6
Impeller immersion
depth (mm) 12.5 25 37.5 50 70 90 Water height (cm) 15 20 30 35
Numerical factor Range of variation Rotor speed )rpm( 50-300
III. RESULTS AND DISCUSSION A. Statistical Analysis
Rotor speed, water height and immersion depth for a three- factor Distance-Based Design were varied to obtain the optimal values. Data collected from the stirred tank reactor were statistically analyzed to determine the considerable effects as well as the interactions. These models are remarkable at the p-value less than 0.05 at 95% confidence level.
In order to analyze the results through the Design Expert Software, quadratic model fitting the experimental results were performed for SAE and mixing time. R2 and adjusted R2 (R2adj) were found to be 0.97 and 0.90 for SAE and 0.97 and 0.90 for mixing time; expressing that predicted and actual values for all responses were in agreement.
B. Effect of Impeller Immersion Depth And Water Height on SAE
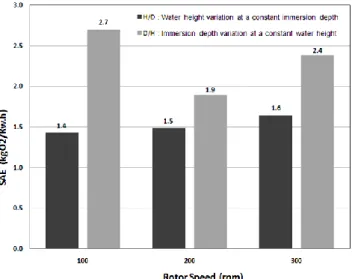
Fig. 2 illustrates the average variation values of SAE with water height and immersion depth in three rotor speeds (100, 200 and 300 rpm).
Fig. 2. Average variation values of SAE through three rotor speeds.
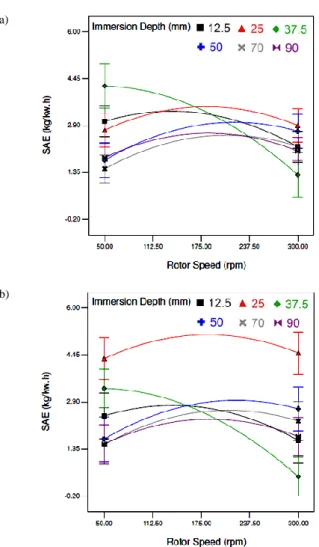
It is seen that variation in SAE due to changes of impeller immersion depth at a fixed water height level is greater than changes of water height at a constant impeller immersion depth. This is due to the direct correlation between power consumption and immersion depth of impeller, while at a fixed immersion depth level, water height variations caused less changes in power consumption and oxygen transfer rate. The variation of SAE with rotor speed in different immersion depth levels at an average level of water height and water height of 30 cm is illustrated in Fig. 3 (a) and (b). It is obvious that in most immersion depth levels, SAE increases with rotor speed up to about 150 to 200 rpm (based on immersion depth) and then decreases. In general, increase in rotor speed at the constant water height and constant immersion depth, increases both oxygen transfer rate and power consumption. In rotor speeds up to about 150 to 200 rpm, oxygen transfer rate grows rapidly with the rotor speed increase causing SAE augmentation. However, at the rotor speeds over 200 rpm, oxygen transfer rate is not increased by the rotor speed due to high turbulence and excess water splashing. In addition energy consumption increases, thus SAE declines gradually over 200 rpm.
(a)
(b)
Fig. 3. SAE variation with rotor speed at different impeller immersion depth: (a) At the average water height level; (b) At the water height level of 30 cm.
There are three distinguishable zones in Fig. 4 that can be described as follows. Zone H=15-20cm: SOTR does not make significant changes, therefore SAE remains relatively constant. Zone H=20-30cm: Due to increase in retention time and contact time of air bubbles with water, SOTR and SAE increase. Zone H=30-35cm: the amount of air entering the water due to the high volume of water is insufficient, resulting in SOTR and SAE decrease.
C. Effect of Different Immersion Depth and Rotor Speed Levels on Mixing Time
Mixing time variation with rotor speed at different immersion depth levels is shown in Fig. 5. It is visible that at all immersion depth levels, the mixing time is significantly reduced with increase in rotor speed. This reduction is even more visible up to the rotor speeds about 240 rpm at all immersion depth levels. However, for rotor speeds over 240 rpm increase in mixing time is observed at some immersion depth levels. This event mostly occurred at low immersion depth levels (i.e. less than 37.5 mm) coupling with high rotor speed values resulting in extra water splashing which was discussed in the previous section. As a result, water splashing causes rotor to consume most of the power to spatter the water instead of mixing the fluid .
D. Determination of Optimum Conditions
Depending on the objective of the process, the favorable location in the design environment could be a maximum, a minimum or a region where the response is stable over a
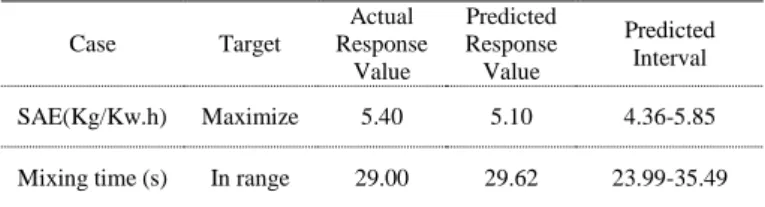
range of possible values for certain factors. With multiplex responses, segments where requirements simultaneously meet the critical specifications are necessary to be found. In order to optimize the surface aeration process, oxygen transfer rate and power consumption should be considered. Thereby, it is economically important that SAE be maximized in surface aeration processes in WWTPs. In order to attain effective surface aeration coupling with sufficient mixing condition, other responses (i.e. mixing time) were kept in range. This selection of optimum conditions was due to the fact that in surface aeration processes, SAE is significantly effective on energy consumption and the final effluent quality in WWTPs, so it should be primarily optimized. Thus, one experimental condition was used for the validation of statistical design. According to the RSM statistical optimization, optimum values for rotor speed, impeller immersion depth and water height were found 169rpm, 25 mm and 30 cm, respectively in the range of this study to achieve the maximum value of SAE. The results of analyses showed that the experimental values were in good agreement with the predicted values according to Table II.
Fig. 4. SAE variation with different water height levels for two rotor speeds of 50 and 300 rpm at the impeller immersion depth of 25 mm.
Fig. 5. Mixing time variation with rotor speed at different immersion depth.
desirability value of 1.00.
TABLEII:OPTIMIZED PROCESS CONDITIONS† AND THEIR RESULTS
Case Target
Actual Response
Value
Predicted Response Value
Predicted Interval
SAE(Kg/Kw.h) Maximize 5.40 5.10 4.36-5.85
Mixing time (s) In range 29.00 29.62 23.99-35.49
† Rotor speed = 169 rpm, Impeller immersion depth = 25.00 mm, Water height = 30.00 cm
IV. CONCLUSION
For the pilot scale surface aeration tank equipped with a Rushton disk turbine, the effects of rotor speed, water height and impeller immersion depth on the SAE and mixing time were investigated. Results showed that changes of impeller immersion depth at a constant water height level had a greater effect on SAE compared to the changes in water level at constant impeller immersion depth. For rotor speeds up to 200 rpm, SAE increased with rotor speed and then decreased. In addition, mixing time was significantly reduced as rotor speed increased. The RSM was found to be a suitable tool for modeling, optimization and prediction of SAE and mixing time in surface aeration tanks. According to the RSM statistical optimization, optimum values for rotor speed, impeller immersion depth and water height were found 169rpm, 25 mm and 30 cm.
ACKNOWLEDGMENT
The authors acknowledge Research & Development department of Mahab Ghodss Consulting Engineering Company for their supports and helpful resources. Also, authors are grateful to Stat-Ease, Minneapolis, MN, USA, for the provision of the Design-Expert package.
REFERENCES
[1] J. A. Mueller, W. C. Boyle, and J. H. Pöpel, Aeration: Principles and
Practice, CRC Press LLC, Florida, 2002.
[2] S. Krause, P. Cornel, and M. Wagner, “Comparison of different oxygen transfer testing procedures in full-scale membrane bioreactors,” Water
Sci. Technol., vol. 47, pp.169-176, 2003.
[3] A. Rao, B. Kumar, and A. Patel, “Oxygen transfer in circular surface aeration tanks,” Environ. Technol., vol. 30, pp. 747-753, 2009. [4] Z. Zhang, J. Zhu, and K. J. Park, “Effect of aeration length and
intensity on solids decomposition in swine manure for odour control,”
Biosyst. Eng., vol. 89, pp. 445-456, 2004.
[5] Z. Zhang and J. Zhu, “Effectiveness of short-term aeration in treating swine finishing manure to reduce odour generation potential,” Agric.
Ecosyst. Environ., vol.105, pp. 115-125, 2005.
[6] Metcalf and Eddy, Wastewater Engineering: Treatment, Disposal and
Reuse, Fourth ed., McGraw Hill, New York, 2003.
[7] S. S. Patil, N. A. Deshmukh, and J. B. Joshi, “Mass transfer characteristics of surface aerators and gas-inducing impellers,” Ind.
Eng. Chem. Res., vol. 43, pp. 2765-2774, 2004.
[8] B. S. Lim, B. C. Choi, S. W. Yu, and C. G. Lee, “Effect of operational parameters on aeration on / off time in an intermittent aeration membrane bioreactor,” Desalination., vol. 202, pp. 77-82, 2007. [9] R. Zamouche, M. Bencheikh-Lehocine, and A. H. Meniai, “Oxygen
transfer and energy savings in a pilot-scale batch reactor for domestic wastewater treatment,”Desalination., vol. 206. pp. 414-423, 2007. [10] F. K. Banaei, A. A. L. Zinatizadeh, M. Mesgar, and Z. Salari,
“Dynamic performance analysis and simulation of a full scale activated sludge system treating an industrial wastewater using artificial neural network,” Int. J. Eng., vol. 26, pp. 465-472, 2013.
[11] J. M. L. Corre, Y. Aldorwish, S. Kim, and M. Ishii, “Two-Phase flow pattern identification using a fuzzy methodology,” in Proc. the International Conference on Information Intelligence and Systems
(ICIIS-99), pp. 155-161, 1999.
[12] J. Zhou, X. Yu, C. Ding, Z. Wang, Q. Zhou, H. Pao, and W. Cai, “Optimization of phenol degradation by Candida tropicalis Z04 using Plackett-Burman design and response surface methodology,” J.
Environ. Sci., vol. 23, pp. 22-30, 2011.
[13] A. A. L. Zinatizadeh, A. R. Mohamed, A. Z. Abdullah, M. D. Mashitah, and G. D. Najafpour, “Process modeling and analysis of palm oil mill effluent treatment in an up-flow anaerobic sludge fixed film bioreactor using response surface methodology (RSM),” Water Res., vol. 40, pp. 3193-3208, 2006.
[14] F. Ghorbani, H. Younesi, S. M. Ghasempour, A. A. Zinatizadeh, M. Amini, and A. Daneshi, “Application of response surface methodology for optimization of cadmium biosorption in an aqueous solution by Saccharomyces cervisiae,” Chem. Eng. J., vol. 145, pp. 267-275, 2008. [15] D. Hadjiev, N. D. Sabiri, and A. Zanati, “Mixing time in bioreactors under aerated conditions,” Biochem. Eng. J., vol. 27, pp. 323-330, 2006.
[16] P. Bonvillani, M. P. Ferrari, E. M. Ducrós, and J. A. Orejas, “Theoretical and experimental study of the effects of scale-up on mixing time for a stirred-tank bioreactor,” Braz. J. Chem. Eng., vol. 23, pp.1-7, 2006.
[17] M. Taghavi, R. Zadghaffari, J. S. Moghaddas, and Y. Moghaddas, “Experimental and CFD investigation of power consumption in a dual rushton turbine stirred tank,” Chem. Eng. Res. Des., vol. 89, pp. 280-290, 2011.
[18] ASCE (American Society of Civil Engineers) Standard, Measurement
of oxygen transfer in clean water, ASCE/EWRI 2-06, 2006.
Amir Mohammadpour was born at Booshehr, Iran on
June 3, 1982. He has got his bachelor degree in mechanical engineering in 2004 from Persian Gulf University, Booshehr. In 2007 he got his master degree in mechanical engineering from Tehran University, Iran. Now, he is a PhD candidate in Tehran University in mechanical engineering department. His main research areas are experimental two-phase and multiphase flow and he published the results of his research in several national and international conferences and journals in this area.
Mohammad Ali Akhavan-Behabadi is a professor
and the head of School of Mechanical Engineering, College of Engineering, University of Tehran, Tehran, Iran. He received his Ph.D. from the Indian Institute of Technology at Roorkee in 1993. He has co-authored more than 150 journal and conference publications. His research interests include experimental two-phase and single phase convective heat transfer. He is currently working on augmentation of heat transfer by different passive techniques in two phase flow and also nanofluid single phase and two phase flow.
Mohsen Nosrati was born at Tehran, Iran on
November 20, 1970. He got his PhD degree in 2004 from the Department of Biochemical Engineering and Biotechnology, IITD (Indian Institute of Technology, Delhi). Now, he is a faculty member in T.M.U. in chemical engineering department from 2004. His main research areas are biochemical engineering, biological wastewater treatment, and bio-thermodynamics. He published more than 30 scientific papers in international journals. Also, he participated many times in national and international conferences.
Masoud Ebrahimzadeh was born 1988 in Ardabil, Iran. He was graduated
and got his B.Sc. degree from Mohaghegh Ardabili University, Iran in Fluid Mechanics Engineering in 2011. He got his master degree in energy conversion engineering from Tehran University, Iran in 2014. His special field of interest is two phase flow.
Alireza Majdinasab was born 1990 in Tehran, Iran. He was graduated and