REMARKS ON THE EVOLUTION OF AGRICULTURAL LAND
DISTRIBUTION IN REGION SOUTH-WEST – OLTENIA (2000-2013)
Miluț Marius, Călina Aurel, Buzatu Claudiu
University of Craiova, Faculty of Agronomy [email protected]
Keywords: Land Fund, south-west Oltenia region, category of use
ABSTRACT
The paper presents the evolution of the surfaces by category of use in the southwest region of Romania. It presented a comparative categories of agricultural land, presenting the existing situation in 2000, 2005, 2010, 2013. Processing of data taken from the National Statistical Institute, there is a trend of decreasing area of agricultural land and within its arable land, vineyards and orchards. This requires future action to counteract the contraction of agricultural areas, especially for vineyards and orchards, where the decrease of cultivated areas is more pronounced.
INTRODUCTION
As categories of use in Romania, according to land use that compose the land fund are distinguished a total of 10 general categories of uses agricultural and non-agricultural of land, which are divided in turn into a total of 65 subcategories agricultural and non-agricultural of use (Călina A., 2010).
The surface of use categories can increase or decrease, these developments are closely related to needs of society and market demands (Miluț M., 2015).
MATERIAL AND METHOD
The data used to perform the paper were taken from the National Institute of Statistics - Statistical Territorial 2013. It is an analysis of the evolution of agricultural land in the region South-West Oltenia, comparing existing surfaces every five years and in the year 2013.
At regional level, the data indicate a decrease in the agricultural area, from 1820083 ha (in 2000) to 1797633 ha in 2013 (Table 1).
Table 1
Agricultural land fund by use in South-West Oltenia region (ha)
Year Total surface
Agricultural area
Arable Pastures Hayfields Vineyards Orchards
2000 2921169 1820083 1247535 379674 86156 51061 55657 2005 2921169 1806606 1255049 377572 88002 39625 46358 2010 2921169 1799230 1251229 379026 87511 39424 42040 2013 2921169 1797633 1244971 377167 96824 38261 40410
If we refer to arable land, it has an oscillating evolution, with a maximum of 1255049 ha in 2005 and a minimum of 1244971 ha in 2013 (Figure 1).
Figure 1. Variation of arable land surfaces in South West region Oltenia
Figure 2. Variation of hayfields surfaces in South West region Oltenia
If we refer to the areas under vineyard and orchard, there is a decrease of their surfaces at the level of South-West Oltenia (Figure 3 and 4).
Figure 3. Variation of vineyards surfaces in South West region Oltenia 1247535
1255049
1251229
1244971
2000 2005 2010 2013
Arable land (ha)
86156
88002
87511
96824
80000 82000 84000 86000 88000 90000 92000 94000 96000 98000
2000 2005 2010 2013
Hayfields (Ha)
51061
39625 39424 38261
2000 2005 2010 2013
Figure 4. Variation of orchards surfaces in South West region Oltenia
Analyzing the existent situation in each county component of the region reveals:
1. Dolj County:
From the dates related in table 2, agricultural area decreased from about 589000 ha in 2000 to 585000 ha for other years taken into account.
Table 2
Agricultural land fund by use in Dolj County (ha)
Year Total surface
Agricultural area
Arable Pastures Hayfields Vineyards Orchards
2000 741401 588944 489004 69390 2993 18810 8747
2005 741401 585699 488677 68435 2952 17538 8097
2010 741401 585469 488820 68506 2952 17334 7857
2013 741401 585451 488805 68503 2952 17334 7857
This decrease is reflected in each category, with the exception hayfields, where the area has remained almost equal to the initial one. The drastic decrease was recorded to vineyards - from 18810 ha in 2000 to 17334 in 2013 and orchards, from 8747 to 7857. Although in absolute numbers decrease is not so high, but as a percentage is significant.
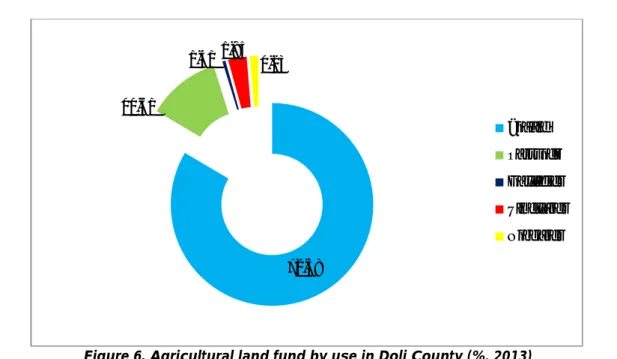
Figures 5 and 6 shows the proportion of each category of agricultural land use in the Dolj County in 2000 respectively 2013.
0 10000 20000 30000 40000 50000 60000
2000 2005 2010 2013
55657
46358
42040 40410
Orchards (ha)
83.03% 11.78%
0.51%3.19%1.49%
Figure 6. Agricultural land fund by use in Dolj County (%, 2013)
2. Gorj County
In the Gorj County, there is a sharp decline in the agricultural area, with approximately 10,000 ha (Table 3).
Table 3
Agricultural land fund by use in Gorj County (ha)
Year Total surface
Agricultural area
Arable Pastures Hayfields Vineyards Orchards
2000 560174 250271 103410 85124 40559 8236 12942
2005 560174 243740 99149 88654 42542 4434 8961
2010 560174 240258 98353 88494 41504 4193 7714
2013 560174 239696 97827 88382 41669 4164 7654
By category of use there is still an increase in areas under pastures and hayfields 3000, respectively 1000 hectares, while the area of arable land decreased from 103 thousand hectares to 98 thousand hectares. The drastically decrease is observed in the category of vineyards where practically the surface is halved (figure 7) and orchards from 12942 ha in 2000 to only 7654 ha in 2013 (figure 8).
Figure 7. Variation of vineyards surfaces in Gorj County 83.49%
11.70%
0.50%2.96% 1.34%
Arable Pastures Hayfields Vineyards Orchards
Vineyards (ha) 0
5000 10000
2000 2005
2010 2013 8236
Figure 8. Variation of orchards surfaces in Gorj County
3. Mehedinti County
The numbers showing a maintaining of agricultural area in Mehedinti County. However, there was a slight increase in arable land, pasture and hayfields, which is reflected in decrease of vineyards and orchards areas (Table 4).
Table 4
Agricultural land fund by use in Mehedinti County (ha)
Year Total surface
Agricultural area
Arable Pastures Hayfields Vineyards Orchards
2000 493289 294534 186444 78910 10775 10124 8281
2005 493289 294082 188692 80740 10687 5997 7966
2010 493289 293381 188141 80661 10988 6502 7089
2013 493289 293381 188141 81297 11388 5563 6992
4. Olt County
Table 5 shows the distribution situation by category of use of agricultural areas in Olt County. It may notice a decrease in the agricultural area of approximately 6000 ha compared to 2000.
Table 5
Agricultural land fund by use in OltCounty (ha)
Year Total surface
Agricultural area
Arable Pastures Hayfields Vineyards Orchards
2000 549828 440016 385190 34819 776 9643 9588
2005 549828 437165 390569 31022 637 7630 7307
2010 549828 434442 388079 31784 529 7634 6416
2013 549828 433903 388603 32339 528 7484 4949
Compared to 2000, arable land increased by about 3,000 ha in 2013 (figure 8). A fairly accentuated decrease was recorded in the areas occupied by pastures, vineyards and orchards especially (from 9588 ha to 4949 ha) - figure 9.
12942
8961
7714 7654
0 2000 4000 6000 8000 10000 12000 14000
2000 2005 2010 2013
Figure 8. Variation of arable land surfaces in Olt County
Figure 9. Variation of orchards surfaces in Olt County
5. Vâlcea County
Table 6 shows the situation by category of use of agricultural areas for Valcea County.
Table 6
Agricultural land fund by use in ValceaCounty (ha)
Year Total surface
Agricultural area
Arable Pastures Hayfields Vineyards Orchards
2000 576477 246318 83487 111431 31053 4248 16099
2005 576477 245920 87962 108721 31184 4026 14027
2010 576477 245680 87836 109581 31538 3761 12964
2013 576477 245202 81595 106646 40287 3716 12958
The agricultural area has decreased by only 1000 hectares compared to 2000. A spectacular decrease of approximately 5000 ha was registered in the pastures (figure 10).
382000 383000 384000 385000 386000 387000 388000 389000 390000 391000
2000 2005 2010 2013
Arable land (ha)
0 1000 2000 3000 4000 5000 6000 7000 8000 9000 10000
2000 2005 2010 2013
9588
7307
6416
4949
Figure 10. Variation of pasturers surfaces in Valcea County
And arable land decreased by approximately 2000 ha, but the largest as a percentage decrease they had orchards (about 25% - from 16099-12958). In contrast, the hayfield surface category was increased from 31053 ha in 2000 to 40 287 ha in 2013.
CONCLUSIONS
There is a decrease of agricultural area both for the whole South-West Oltenia region, and for each of its component county.
The arable surface remained about the same in the region, but was found a decrease in Gorj county and an increase in Olt County.
Decrease of agricultural surface is largely due disappearance of areas under vineyards and orchards, especially in the counties of Gorj, Mehedinti and Valcea.
This requires future action to counteract the contraction of agricultural areas, especially for vineyards and orchards, where the decrease of cultivated areas is more pronounced.
BIBLIOGRAPHY
1.Călina A. and colab.,2010 – Topografie generală şi inginerească, Editura Sitech, Craiova, ISBN 973-657-945-X;
2. Călina A., Călina Jenica, Croitoru A., Research on the identification and promotion of agroturistic potential of territory between Jiu and Olt river, Annals of the University of Craiova - Agriculture, Montanology, Cadastre Series. Vol XLIII/2, Ed. Universitaria, Craiova, pages 54-59, 2013.
2.Călina Jenica, Călina A., Miluț M., Băbucă N.-Surveying data processing for extension, land registration and construction improvement, Annals of the University of Craiova - Agriculture, Montanology, Cadastre Series, pag. 47- 57, Vol. XLIV/2 2014;
3. Miluț Marius, Călina Jenica, Croitoru Alin - The evolution of surfaces in Romania, by category of use during 2000-2012, Annals of the University of Craiova, Series Agriculture, Montanology, Cadastre, Vol. XLV/2, Pag. 114-119 ISSN 1841-83172066-950X(e), 2015
4.X XX -Territorial Statistics – 2013 5.http://www.insse.ro/
104000 105000 106000 107000 108000 109000 110000 111000 112000
2000 2005 2010 2013
111431
108721
109581