Research Article
Bacteriological profile and antibiogram of blood culture isolates done
by automated culture and sensitivity method in a neonatal intensive
care unit in a tertiary care hospital in Odisha, India
Kausik Kumar Sarangi
1, Dipti Pattnaik
1, Surya Narayan Mishra
1*,
Manas Kumar Nayak
2, Jagadananda Jena
1INTRODUCTION
Neonatal septicaemia refers to a clinical syndrome characterised by systemic signs and symptoms due to generalised bacterial infections with a positive blood culture in the first four weeks of life.1 Bacterial infections
are the commonest cause of morbidity and mortality during the neonatal period. Fulminate and fatal course of infection may result from complications such as shock, disseminated intravascular coagulation (DIC) and multisystem organ failure, mandating early diagnosis of
ABSTRACT
Background: Sepsis is one of the commonest cause of neonatal mortality. The aetiology of neonatal sepsis has variations according to the various customs and practices in the perinatal and neonatal period and geographical area. This study was designed to analyse the magnitude and aetiological characteristics of neonatal sepsis & also the antibiotic sensitivity pattern of the isolates.
Methods: This prospective study was conducted in the Department of Microbiology including 250 neonates with suspected neonatal sepsis admitted to Dept. of Paediatrics & NICU, of Kalinga Institute of Medical Sciences (KIMS), Bhubaneswar, during the period from Nov. 2012 - April 2014. Two ml of venous blood was taken from each neonate & cultured by automated BacT/Alert & VITEK2 method for rapid isolation & sensitivity test. A structured proforma was used to collect the information for the baseline characteristics like age, gender, birth weight, gestational age, mode of delivery of the neonate and age of onset of illness.
Results: Amongst the total samples processed, 82(32.8%) became culture positive among which gram positive bacteria were the most predominant (65.8%). Out of all the gram positive pathogens, CoNS were the most common isolates (88.5%). Among the total culture positive pathogenic isolates (n=82), S. haemolyticus was the predominant bacteria 28 (34.1%) followed by S. epidermidis 12 (14.6%) and Esch coli. 8 (9.8%). Staph. aureus was isolated from 6 (7.3%) cases whereas candida spp. were isolated from only 8 cases (9.6%).
Conclusions: Present study revealed that both gram positive and gram negative bacteria were responsible for blood stream infections and most of the strains were multidrug resistant. Among gram positive bacterial pathogens, most common were Coagulase Negative Staphylococcus (CoNS) (88.5%) followed by Staphylococcus aureus (7.3%).
Keywords: Automated culture, Neonatal sepsis, CoNS
1Department ofMicrobiology, Kalinga Institute of Medical Sciences, Bhubaneswar, Odisha, India 2
Department ofPaediatrics, Kalinga Institute of Medical Sciences, Bhubaneswar, Odisha, India
Received: 15 September 2015
Accepted: 05 October 2015
*Correspondence:
Dr. Surya Narayan Mishra, E-mail: [email protected]
Copyright: © the author(s), publisher and licensee Medip Academy. This is an open-access article distributed under the terms of the Creative Commons Attribution Non-Commercial License, which permits unrestricted non-commercial use, distribution, and reproduction in any medium, provided the original work is properly cited.
this life threatening condition for a timely treatment and a favourable outcome.2
Aims and objectives
To find out the bacteriological profile and antibiogram of blood culture isolates from neonatal septicaemic cases done by automated culture & sensitivity method in a Neonatal Intensive Care Unit (NICU) of Kalinga Institute of Medical Sciences (KIMS), Bhubaneswar, Odisha, India.
METHODS
A prospective study covering 250 suspected neonatal septicaemic cases was carried out in the Department of Microbiology in association with Dept. of Paediatrics & NICU, of Kalinga Institute of Medical Sciences, Bhubaneswar, during the period from Nov. 2012 - April 2014.
Two ml of venous blood samples for culture were collected following standard aseptic precautions in specific automated aerobic blood culture bottle [FAN (Fastidious Antibiotic Neutralization bottle (yellow cap) - BioMerieux #259794]. If empirical antibiotics were already started, the collection was timed before the next
dose of antibiotic was due or about half an hour before the predicted peak of temperature.
The samples thus collected were transferred immediately to the Microbiology section of Central Laboratory, KIMS and were cultured by automated BacT/Alert & VITEK2 method for rapid isolation & sensitivity test. The results thus obtained were analysed to find the significance of various parameters.
The blood culture bottles positive for bacterial growth changed its colour from blue green to yellow & positive bottles are determined by one of three software algorithms and are indicated as a yellow sensor and high reflectance units. Negative bottles result from darker sensors and low reflectance units.
RESULTS
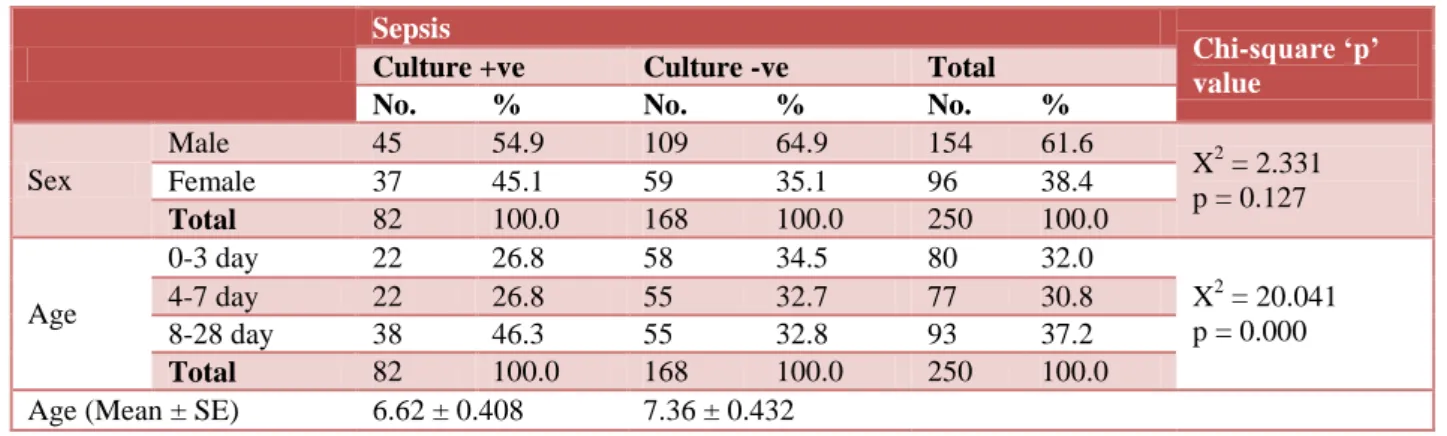
Out of 250 clinically suspected septicaemic cases of neonates, 154 (61.6%) were males and 96 (38.4%) were females. Among the males culture positivity was 45 (54.9%) & for females it was 37 (45.1%). Neonates of the age group 8-28 days showed maximum culture positivity 38 (46.3%). Total culture positivity in the study in all the age group was 82 (32.8%) (Table 1).
Table 1:Association between physical parameters and sepsis. Sepsis
Chi-square ‘p’ value
Culture +ve Culture -ve Total No. % No. % No. %
Sex
Male 45 54.9 109 64.9 154 61.6
X2 = 2.331 p = 0.127
Female 37 45.1 59 35.1 96 38.4
Total 82 100.0 168 100.0 250 100.0
Age
0-3 day 22 26.8 58 34.5 80 32.0
X2 = 20.041 p = 0.000
4-7 day 22 26.8 55 32.7 77 30.8
8-28 day 38 46.3 55 32.8 93 37.2
Total 82 100.0 168 100.0 250 100.0
Age (Mean ± SE) 6.62 ± 0.408 7.36 ± 0.432
Out of all the culture positive septicaemic cases, maximum percentage of positivity were seen in VLBW group. (60%) followed by LBW neonates (47.6%). Maximum bacterial growth was seen in pre term babies (56%) as compared to the term babies (19.5%). PROM was also found to be the important risk factor for culture positivity (47.8%) than the absence of PROM (31.2%). Home delivery was seen as an important risk factor for sepsis (46.6%) than the hospital delivery both at KIMS or in other institutions (29.5% & 33.8% respectively). History of caesarean section was seen in 34.9% of culture positive septicaemic cases as compared to the normal delivery (28.2%). Significant p value was observed in relation to birth weight, gestational age and PROM.
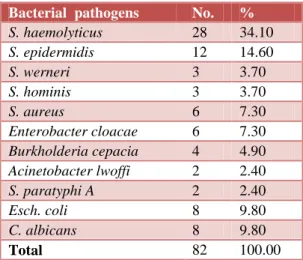
Out of total 82 pathogenic isolates recorded by automated system, S. hemolyticus was the predominant bacteria 28 (34.1%) followed by S. epidermidis 12 (14.6%) and Esch. coli. 8 (9.8%). S. aureus was isolated from 6 (7.3%) cases whereas Candida albicans was also isolated from 8 (9.8%) cases (Table 3).
Table 2:Association of clinically suspected cases by risk factor.
Sepsis
Chi-square ‘p’ value
Culture +ve Culture -ve Total No. % No. % No. %
Birth weight
Very LBW 3 60.00 2 40.00 5 2.00
X2 = 16.811 p = 0.000
LBW 41 48.20 44 51.80 85 34.00
Normal 38 23.80 122 76.20 160 64.00
Total 82 32.80 168 67.20 250 100.00
Gestation
Term 31 19.50 128 80.50 159 63.60
X2 = 35.072 p = 0.000
Preterm 51 56.00 40 44.00 91 36.40
Total 82 32.80 168 67.20 250 100.00
PROM
Absent 71 31.30 156 68.70 227 90.80
X2 = 2.595 p = 0.107
Present 11 47.80 12 52.20 23 9.20
Total 82 32.80 168 67.20 250 100.00
Place of delivery
Other Institution 44 33.80 86 66.20 130 52.00
X2 = 1.884 p = 0.039
KIMS 31 29.50 74 70.50 105 42.00
Home delivery 7 46.70 8 53.30 15 6.00
Total 82 32.80 168 67.20 250 100.00
Mode of delivery
CS 60 34.90 112 65.10 172 68.80
X2 = 1.086 p = 0.297
ND 22 28.20 56 71.80 78 31.20
Total 82 32.80 168 67.20 250 100.00
Table 3:Distribution of pathogenic isolates by automated System (n= 82).
Bacterial pathogens No. %
S. haemolyticus 28 34.10
S. epidermidis 12 14.60
S. werneri 3 3.70
S. hominis 3 3.70
S. aureus 6 7.30
Enterobacter cloacae 6 7.30
Burkholderia cepacia 4 4.90
Acinetobacter lwoffi 2 2.40
S. paratyphi A 2 2.40
Esch. coli 8 9.80
C. albicans 8 9.80
Total 82 100.00
Table 4:Organism type vs. onset of septicaemia.
Organism type
Onset of septicaemia
EOS LOS Total No. No. No.
Gram positive 7 (31.8) 45 (75%) 52 (63.1%)
Gram negative 13 (59%) 9 (15%) 222 (6.3%)
Fungi 2 (9%) 6 (10%) 8 (9.6%)
Total 22 (n=22) 60 (n=60) 82 (n=82)
Chi-square
‘p’ value X2 = 16.411; p = 0.000
Among all the gram positive isolates, CoNS were the predominant pathogen 46 (88.5%) as compared to the other pathogens 6 (11.5%) in this study (Figure 1).
Figure 1:CoNS among Gram positive cases.
All the Gram positive pathogenic isolates were sensitive to linezolid, tigecycline and vancomycin. Co-trimoxazole was sensitive in 78.8% isolates followed by ceftriaxone (76.9%), azithromycin (76.9%), cefepime (65.4%) erythromycin (55.8%) clindamycin (51.9%) levofloxacin (42.3%), amikacin (42.3%), cefadroxil (30.8%) and gentamicin (25%). Maximum resistance was seen against benzylpenicilin (86.6%) and ampicilin (71.2%) (Table 5).
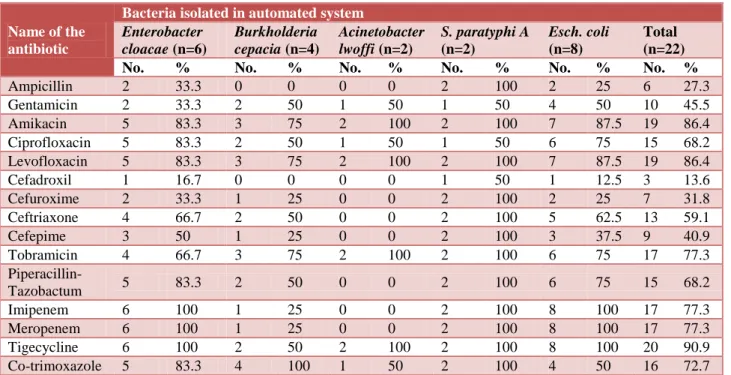
Among the Gram negative isolates maximum antibiotic sensitivity was observed for tigecycline (90.9%), levofloxacin (86.4%) & amikacin (86.4%) followed by imipenem (77.3%), meropenem (77.3%), tobramycin (77.3%), ciprofloxacin (68.2%), piperacilin-tazobactum (68.2%), ceftriaxone (54.5%) and cefepime (40.9%). Resistance was maximum for cefadroxil (86.4%), ampicilin (72.7%) and cefuroxime (68.2%) (Table 6).
CoNS 88.5%
Other than CoNS 11.5%
CoNS
Table 5:Antibiotic sensitivity patterns among gram positive isolates (No & % showing sensitivity).
Name of the antibiotic
Bacteria isolated in automated system
S. haemolyticus
(n=28)
S. epidermidis
(n=12)
S. werneri
(n=3)
S. hominis
(n=3)
S. aureus
(n=6)
Total (n=52) No. % No. % No. % No. % No. % No. %
Linezolid 28 100 12 100 3 100 3 100 6 100 52 100
Tigecycline 28 100 12 100 3 100 3 100 6 100 52 100
Cefadroxil 7 25 5 41.7 1 33.3 1 33.3 2 33.3 16 30.8
Benzyl penicillin 4 14.3 2 16.7 0 0 0 0 1 16.7 7 13.5
Clindamycin 14 50 7 58.3 1 33.3 2 66.7 3 50 27 51.9
Ciprofloxacin 9 32.1 5 41.7 2 66.7 1 33.3 2 33.3 19 36.5
Oxacillin 14 50 5 41.7 2 66.7 2 66.7 4 66.7 27 51.9
Gentamicin 5 17.9 5 41.7 1 33.3 1 33.3 1 16.7 13 25
Ampicillin 6 21.4 3 25 0 0 0 0 3 50 12 23.1
Co-trimoxazole 22 78.6 9 75 3 100 2 66.7 5 83.3 41 78.8
Cefuroxime 10 35.7 2 16.7 1 33.3 2 66.7 3 50 18 34.6
Ceftriaxone 20 71.4 9 75 3 100 3 100 5 83.3 40 76.9
Cefepime 18 64.3 8 66.7 2 66.7 3 100 3 50 34 65.4
Amikacin 10 35.7 5 41.7 2 66.7 2 66.7 3 50 22 42.3
Azithromicin 21 75 9 75 3 100 2 66.7 5 83.3 40 76.9
Erythromycin 16 57.1 7 58.3 2 66.7 0 0 4 66.7 29 55.8
Vancomycin 28 100 12 100 3 100 3 100 6 100 52 100
Table 6:Antibiotic sensitivity patterns among gram negative isolates (No & % showing sensitivity).
Name of the antibiotic
Bacteria isolated in automated system
Enterobacter cloacae (n=6)
Burkholderia cepacia (n=4)
Acinetobacter lwoffi (n=2)
S. paratyphi A
(n=2)
Esch. coli
(n=8)
Total (n=22) No. % No. % No. % No. % No. % No. %
Ampicillin 2 33.3 0 0 0 0 2 100 2 25 6 27.3
Gentamicin 2 33.3 2 50 1 50 1 50 4 50 10 45.5
Amikacin 5 83.3 3 75 2 100 2 100 7 87.5 19 86.4
Ciprofloxacin 5 83.3 2 50 1 50 1 50 6 75 15 68.2
Levofloxacin 5 83.3 3 75 2 100 2 100 7 87.5 19 86.4
Cefadroxil 1 16.7 0 0 0 0 1 50 1 12.5 3 13.6
Cefuroxime 2 33.3 1 25 0 0 2 100 2 25 7 31.8
Ceftriaxone 4 66.7 2 50 0 0 2 100 5 62.5 13 59.1
Cefepime 3 50 1 25 0 0 2 100 3 37.5 9 40.9
Tobramicin 4 66.7 3 75 2 100 2 100 6 75 17 77.3
Piperacillin-Tazobactum 5 83.3 2 50 0 0 2 100 6 75 15 68.2
Imipenem 6 100 1 25 0 0 2 100 8 100 17 77.3
Meropenem 6 100 1 25 0 0 2 100 8 100 17 77.3
Tigecycline 6 100 2 50 2 100 2 100 8 100 20 90.9
Co-trimoxazole 5 83.3 4 100 1 50 2 100 4 50 16 72.7
DISCUSSION
The present study included 250 clinically suspected neonates suffering from sepsis and admitted to the NICU of Paediatrics Department, KIMS. Distribution of cases based on onset of septicaemia & type of organism have been analysed. Further, antibiotic sensitivity pattern of the bacterial pathogens have been thoroughly analysed.
Shah et al.,4 showed, the association of LBW neonates & sepsis as 50%.
The number of VLBW neonates in our study is 5 (2%) out of which culture positivity was 60% which is closely related to the study conducted by Jia-Horng Jiang et al.5 where culture positivity of VLBW neonates was 54.4%.
In our study 51 (56%) neonates showed blood culture positivity in association with pre-term delivery. This finding is at par with the study conducted by M. N. Shah et al.4 where 51.04% bacteriologically positive cases were associated with pre-term delivery.
In the present study out of 250 clinically suspected neonates, 82 were bacteriologically confirmed cases among which Staphylococcus haemolyticus was the
predominant isolate 28 (34.1%) followed by
Staphylococcus epidermidis 12 (14.6%), S. werneri 3 (3.7%), S. hominis 3 (3.7%), & S. aureus 6 (7.3%). Other pathogens isolated were Enterobacter cloacae 6 (7.3%),
Burkholderia cepacia 4 (4.9%), Acinetobacter lwoffi 2 (2.4%), Salmonella paratyhi A 2 (2.4%), Esch coli 8 (9.8%) & Candida albicans 8 (9.8%). It shows that gram positive bacterial pathogens were the commonest isolates 52 (63.4%) followed by Gram negative bacterial pathogens 26.8% & fungi 9.8%. This finding is similar to the outcome of the study conducted by Hilal Ozkan et al.6 where it was shown that Gram positive isolates were 68.2% followed by Gram negative isolates (16.5%) & fungi (15.8%).
Regarding onset of sepsis it has been shown in our study that Gram positive bacterial pathogens were more commonly associated with late onset sepsis which accounts to (72.5%) & Gram negative pathogens were associated with early onset sepsis (59%) which is close to the findings of the study conducted by F. Motara et al.7 where late onset sepsis was most common & CoNS was the predominant gram positive pathogen (67.6%) & Gram negative isolates as predominant pathogens in early onset sepsis. In another study conducted by Jia-Horng Jiang et al.8 CoNS were also associated commonly with late onset sepsis.
In our study all the Gram positive pathogenic isolates were sensitive to linezolid, tigecycline and vancomycin. Co-trimoxazole was sensitive in 78.8% isolates followed by ceftriaxone (77%), azithromycin (76.9%), cefepime (60%), erythromycin (59.6%) & clindamycin (53.9%). This finding is closely associated with the study conducted by Shahsanam Gheibi et al.9 where maximum sensitivity was found to vancomycin (90%) & ciprofloxacin (78.5%). Study conducted by Katiyar R et al.10 showed maximum resistance to penicillin (7.41%) & ampicillin (18.52%) which is close to the findings of our study. Similar to our study maximum sensitivity to linezolid (100%), vancomycin (95%), cefotaxime (73%), ceftriaxone (68%) & amikacin (68%) was also observed in the study conducted by Maimoona Mustafa et al.11
For Gram negative pathogenic isolates, our study showed maximum sensitivity to amikacin (86.4%) followed by imipenem (77.3%), meropenem (77.3%), tobramycin (77.3%), ciprofloxacin (68.2%), piperacilin-tazobactum (68.2%), ceftriaxone (59.1%) and cefepime (40.9%) & resistance to cefadroxil (86.4%), ampicilin (72.7%), cefuroxime (68.2%) & gentamicin (54.5%) which was at par with the study conducted by Maimoona Mustafa et al. In another study conducted by A. K. Mane et al.12 maximum sensitivity was also found to imipenem (100%), ciprofloxacin (66.6%) & levofloxacin (66.6%). & maximum resistance was found against ampicillin (81.5%) & gentamicin (85.2%).
ACKNOWLEDGEMENTS
The authors are very much thankful to all the staffs of Department of Microbiology and Paediatrics as well as to the management of Kalinga Institute of Medical Sciences, Bhubaneswar, Odisha, India for their constant support and encouragement in completing the project.
Funding: No funding sources Conflict of interest: None declared
Ethical approval: The study was approved by the institutional ethics committee
REFERENCES
1. Averey GB. Sepsis neonatorum. In: Gordon B.
Averey, Mhairi G. MacDonald, Martha D. Mullet, eds. Text Book of Neonatology Pathophysiology & Management of the Newborn. 6th ed. Philadelphia: Lippincott Williams and Wilkins; 2005: 1196-1207. 2. Sriram R. Correlation of blood culture results with
the sepsis score and the sepsis screen in the diagnosis of neonatal septicaemia. Int J Biol Med Res. 2011;2(1):360-8.
3. Manjushree H. Bhalchandra, Harish Ghogare,
Anupama Wyawahare, Vijay M. Mulay, Vishwesh P. Bansal, Mangala P. Bansal. Clinical and microbiological profile of neonatal sepsis at tertiary care hospital, Aurangabad, Maharastra. Natl J Med Sci. 2012;1(2):32-9.
4. Shah MN, Desai PB. Clinical and bacteriological profiles of blood culture positive sepsis in newborns. Int J Pharm Life Sci. 2011;2(9):1041-5. 5. Jiang JH, Chiu NC, Huang FY, Kao HA, Hsu CH,
Hung HY, et al. Neonatal sepsis in the neonatal intensive care unit: characteristics of early versus
late onset. J Microbiol Immunol Infect.
2004;37:301-6.
6. Ozkan H, Cetinkaya M, Koksal N, Celebi S,
Hacımustafaoglu M. Culture-proven neonatal sepsis in preterm infants in a neonatal intensive care unit over a 7 year period, CoNS as a predominant pathogen. Paediatr Int. 2014;56:60-6.
8. Jiang JH, Chiu NC, Huang FY, Kao HA, Hsu CH, Hung HY, et al. Neonatal sepsis in the neonatal intensive care unit: characteristics of early versus
late onset. J Microbiol Immunol Infect.
2004;37:301-6.
9. Gheibi S, Fakoor Z, Karamyyar M, Khashabi J, Ilkhanizadeh B, Asghari-Sana F, et al. Coagulase negative staphylococcus; the most common cause of neonatal septicemia in Urmia, Iran. Iran J Paediatr. 2008;18(3):237-43.
10. Katiyar R, Bose S. Bacteriological profile of neonatal septicaemia in Pravara Rural Hospital. Pravara Med Rev. 2012;4(2):4-6.
11. Mustafa M, Ahmed SL. Bacteriological profile and antibiotic susceptibility patterns in neonatal septicaemia in view of emerging drug resistance. J Med Allied Sci. 2014;4(1):2-8.
12. Mane AK, Nagdeo NV, Thombare VR. Study of
neonatal septicemia in a tertiary care hospital in rural Nagpur. J Recent Adv Appl Sci. 2010;25:19-24.
Cite this article as: Sarangi KK, Pattnaik D, Mishra SN, Nayak MK, Jena J.Bacteriological profile and antibiogram of blood culture isolates done by