www.jyoungpharm.org | www.phcog.net
An UFLC-DAD Method for the Quantification of Menaquinone-4
in Spiked Rabbit Plasma
Karthika Anoop1, Gullapalli Kowmudi1, Mukkamala Sailaja1, Krishna Veni Nagappan1,*, Nagarajan Janaki Sankarachari Krishnan1,
Ramalingam Peraman2
1Department of Pharmaceutical Analysis JSS College of Pharmacy, Ooty [A Constituent College – JSS Academy of Higher Education & Research], Rocklands, Ooty, Tamil Nadu, INDIA.
2Department of Medical Chemistry, Raghavendra Institute of Pharmaceutical Education and Research, Chiyyedu, Anantapur, Andhra Pradesh, INDIA.
ABSTRACT
Objective: The present study is aimed to develop and validate an Ultra-Fast Liquid Chromatography-Diode Array Detector (UFLC-DAD) method for the quantification of vitamin K2 as Menaquinone-4 (MK-4) in rabbit plasma.
Method: Standard solutions and spiked plasma samples of MK-4 and In-ternal Standard (IS) were prepared from primary stock solutions of 1mg/ ml concentration in ethanol each. Protein precipitation was carried out for the MK-4 and IS extraction from plasma spiked samples. Chromatographic separation was employed using Isopropyl Alcohol and Acetonitrile (50:50 v/v) as mobile phase and a C-18 column with 1ml/min flow rate and a run time of 10 mins. Detection was carried out in the range 190-600 nm with 269 nm set as a reference wavelength. Result: The retention times of MK-4 and IS were at 5.5 ± 0.5 mins and 8 ± 0.5 mins respectively. Calibra-tion curve for MK-4 was found to be linear in the range of 0.374 to 6 µg/ ml with an R2 value of 0.9934. The % RSD for accuracy was <15%, inter
and intraday precisions were <10%. The samples were found to be stable throughout the study. Conclusion: This method can be applied to the esti-mation of MK-4 in rabbit plasma using UFLC-DAD.
Key words: Bioanalytical method, Ultra-Fast Liquid Chromatography (UFLC-DAD), Menaquinone-4, Rabbit plasma, Validation.
Correspondence
Dr. Krishna Veni Nagappan, Department of Pharmaceutical Analysis JSS Col-lege of Pharmacy, Ooty [A Constituent ColCol-lege – JSS Academy of Higher Edu-cation & Research], Rocklands, Ooty, Tamil Nadu, INDIA.
Phone: +91-423-2443393/231 Email: [email protected] DOI: 10.5530/jyp.2019.11.32
This is an open access article distributed under the terms of the Creative Commons Attribution-NonCommercial-ShareAlike 4.0 License, which allows others to remix, tweak, and build upon the work non-commercially, as long as the author is credited and the new creations are licensed under the identical terms.
INTRODUCTION
There is expanding enthusiasm for the potential medical advantages of vitamin K past its part in coagulation. A few examinations have an-nounced capacities for vitamin K past its established part, including the change of bone health,1 also, the diminishment of vascular calcification
and cardiovascular risk.2,3 Besides, a few studies2-4 have proposed that
menaquinones, otherwise called vitamin K2, could be more potent in these capacities than Phylloquinone, otherwise called vitamin K1. Menaquinones, generally found in nature, have side chains of fluctuating length in the vicinity of four and thirteen isoprene units, the vast major-ity of which are unsaturated.5 MK-4 is extraordinary among the
mena-quinones in that microscopic organisms do not orchestrate it. Instead, MK-4 is alkylated from menadione (Vitamin K3), a manufactured type of vitamin K that is available in animal feeds or is the result of tissue-specific transformation tissue-specifically from dietary phylloquinone, with menadione as the hypothesized intermediate.6,7 There is additionally a
theory that more extended chain menaquinones, for example, MK-7, can be changed over to MK-4 as well.8 The most bounteous menaquinones
in the human eating regimen are the short chain MK-4, originates from animal products and the long-chain MK-7, MK-8, MK-9 and MK-10. All types of vitamin K have one open capacity. They are all filled in as a cofactor for the post-translational enzyme gamma-glutamyl carbox-ylase, which is set up by the basic naphthoquinone ring structure.9 This
catalyst changes over particular protein-bound glutamate deposits into gamma-carboxyglutamate, by and large, known as Gla. Presently, seven-teen individuals from the Gla protein family are known, incorporating seven proteins associated with blood coagulation (All combined in the liver), Osteocalcin (OC; bone), Matrix Gla Protein (MGP; for the most
part ligament and vessel wall), growth arrest-specific protein 6, Gla-rich proteins, periostin and periostin-like factor.10 Aside from the
thicken-ing elements OC (Bone arrangement) and MGP (Inhibitor of delicate tissue calcification), the physiological significance of these proteins is not yet completely understood.10 Amidst all the above benign effects of
menaquinone-4, the necessity to develop a simple, accurate and reliable method for analysis of menaquinone-4 in biological samples is essential and also is the aim of our study.
MATERIALS AND METHODS
Chemicals and reagents
Reference standards
Vitamin K2 (Menaquinone-4) was purchased from Sigma Aldrich, (Bangalore) India and Vitamin K1 (IS) was purchased from SUPELCO, (Bellefonte) in the USA. The structures of these compounds are shown in Figures 1 and 2 respectively.
Solvents
HPLC Grade Solvent Acetonitrile was purchased from Merck, (Mum-bai, India). Isopropyl alcohol AR grade was purchased from Qualigens fine chemicals (Mumbai, India). Milli-Q-water for HPLC analysis and extraction was obtained using a milli-Q-purification system (Millipore, Bedford, USA).
Biological matrix
Chromatographic conditions
Separation was performed using a Shimadzu gradient UFLC system (Shimadzu, Japan) equipped with a diode array detector. The separation was carried out on a reverse phase column SHIMPAC C18 (250 mm x 4.6 mm i.d, 5µm). The column was operated at 23°C (Ambient temperature). The mobile phase was Isopropyl alcohol/Acetonitrile (50:50 v/v) with a flow rate of 1 ml/min. Detection was carried out in the range 190-600 nm at 269 nm set as a reference wavelength. The injection volume of prepared samples were 20 µl. Lab solutions data station processed the chromatograms. The total runtime per injection was 10 mins. Solutions used were protected from light and maintained at -20°C before analysis.
Preparation of primary stock and working solutions
A 1mg/ml primary stocks of menaquinone-4 and vitamin K1 (Internal standard) in ethanol were prepared using certified standards. Working solutions with concentrations 100, 10 and 1µg/ml were prepared by ap-propriately diluting 1mg/ml stock with ethanol.
Preparation of calibration standards
Calibration standards were prepared by serially diluting working so-lutions to achieve final concentrations of 0.374 - 6µg/ml. All internal standard spiked samples were prepared such that the final concentration of internal standard is 5µg/ml.
Preparation of quality control samples
Quality control samples were prepared in concentrations of 4.2µg/ml (HQC), 1.73µg/ml (MQC) and 0.85µg/ml (LQC).
Preparation of plasma samples
Standards were prepared using plasma from the control group of healthy rabbits. Aliquots of plasma were spiked with known amounts of MK-4 and K1 standard stock solutions ranging from 14.96 – 240 µg/ml to ob-tain working standards ranging from 0.374 – 6 µg/ml. A suitable dilution of the stock solution of IS was made and spiked to blank plasma to obtain a final concentration of 5 µg/ml. The spiked plasma samples were stored at -20°C until further analysis. Quality control samples were prepared by spiking the blank plasma samples to obtain 0.85 µg/ml (LQC), 1.73 µg/ ml (MQC) and 4.2 µg/ml (HQC). Menaquinone-4 depleted plasma was prepared by exposing plasma to UV light over 2 hrs.
Sample extraction
Protein precipitation technique was employed for sample extraction. For determination, we used 1.8 ml plasma (Control, calibrator); Sample of 50 µl volume was mixed; 50 µl of internal standard (VitaminK1) and acetonitrile (100 µl as precipitating agent) were added. The mixture was vortexed for 3 mins and then centrifuged at 5000 rpm for 15 mins. The supernatant was collected for vortexing followed by centrifugation at 5000 rpm for 15 mins. The resulting supernatant was subjected for fur-ther analysis in UFLC by taking aliquots of 20µl per injection.
We measured plasma samples from albino rabbits. All plasma samples were obtained in tubes with a clot activator (Vacuette, Germany) and the tubes were protected from light, centrifuged 15 mins at 5000 rpm and immediately stored at -80°C. The samples were stored for a maximum of three months before the analysis.
Method validation
Method validation procedures were performed concerning US FDA bio-analytical method validation guideline to evaluate the method suitability for the quantitative determination of menaquinone-4 in rabbit plasma.
Figure 1: Structure of Menaquinone-4.
Figure 2: Structure of Vitamin K1 (Internal standard).
Statistical analysis
Statistical analysis was conducted and data reported as mean ± S.D using MS Excel 2013 (Microsoft Corporation, USA).
RESULTS
Method validation
The real goal of the validation process is to challenge the method and to determine the limits of allowed variability for the conditions needed to run the method. The components of validation methods and procedure adopted for the method validation were presented earlier. This section deals with the discussions of the results obtained.
Linearity
It was observed that the optimized methods were linear within a spe-cific concentration range for MK-4. The calibration curve was plotted between response factor and concentrations of the standard solution (Figure 3).
The linearity for menaquinone-4 was performed for the spiked plasma at the following concentrations of 0.374, 0.85, 1.73, 3, 4.2, 5.4 and 6µg/ml. The R2 value was found to be 0.9937.
The calibration curves were constructed on six different days throughout one week to determine the variability of the slopes and intercepts. The results indicated that no significant inter-day variability of slopes and intercepts over the optimized concentration range. (Table 1)
Accuracy and precision
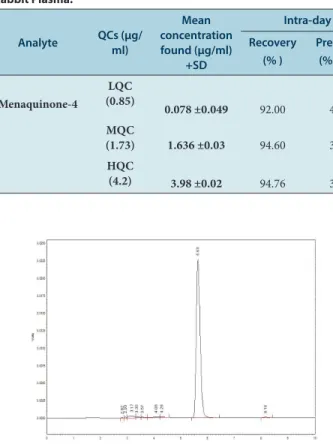
menaqui-Table 3: Precision Studies of Menaquinone-4 (µg/ml) (n=6) in Spiked Rabbit Plasma.
Analyte QCs (µg/ml)
Mean concentration found (µg/ml)
+SD
Intra-day Recovery
(% )
Precision (% RSD)
Menaquinone-4
LQC
(0.85) 0.078 ±0.049 92.00 4.82
MQC
(1.73) 1.636 ±0.03 94.60 3.21
HQC
(4.2) 3.98 ±0.02 94.76 3.04
Table 2: Recovery Studies of Menaquinone-4 from Spiked Rabbit Plasma (n=6).
Concentration (g/
mL) Mean (µg/mL) Menaquinone-4
± SD RSD (%) Recovery (%)
0.85 (LQC) 0.773±0.005 0.65 90.96
1.73 (MQC) 1.63±0.028 1.73 94.24
4.2 (HQC) 3.96±0.018 0.47 94.38
Table 1: Linearity Data of Menaquinone-4 in Spiked Rabbit Plasma by the Proposed UFLC Method.
S.
No Analyte Conc. (µg/ml)
(menaquinone-4) Mean area Observed
Mean Internal Standard area observed (Conc
2µg/ml)
Response Factor
1 0.374 15994 115601 0.1383
2 0.850 25851 113341 0.2338
3 1.73 66975 118533 0.5651
4 3 134328 115935 1.1587
5 4.2 185810 118533 1.5707
6 5.4 243220 114040 2.1364
7 6 319849 121551 2.5316
*n=5.
Figure 3: Calibration Curve of Concentration Range of 0.374 to 6 µg/ml in Spiked Rabbit Plasma.
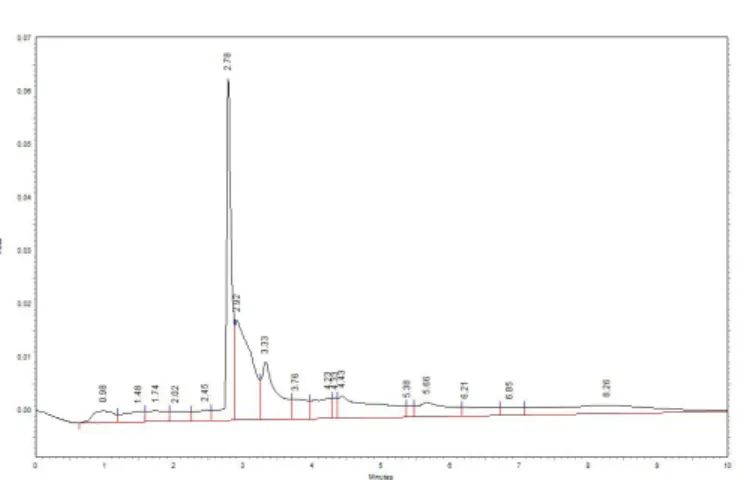
Figure 4: Chromatogram of Standard Menaquinone-4.
Figure 5: Chromatogram of Internal Standard (Vitamin K1).
none-4 in plasma ranged from 90.9 to 94.3% and in aqueous solution ranged from 90.6 to 94.4%. It is, therefore, derived that the developed methods are accurate and reliable. The data is given in Table 2.
The optimized methods for the estimation of the drugs were found to be precise. This was evident from the coefficient of variation values, the observed % CV for the developed method is between 3-5 % indicating the developed method to be precise. The results are presented in Table 3.
The six blank plasma samples were analyzed and the chromatograms were recorded. Endogenous interferences were not detected at the reten-tion time of selected drugs and internal standard. No addireten-tional peaks were observed in the sample chromatograms.
These peaks, however, did not interfere with the drugs and internal stan-dard peaks. These observations show that the developed assay method is specific and selective and the chromatograms are shown in Figures 4, 5, 6, 7 and 8.
The Retention time of menaquinone-4is 5.5 ± 0.5 mins and Internal Standard Retention time was 8 ± 0.5 mins, therefore there was no inter-ference between internal standard peak and drug peak.
ranged from 90.6 to 94.4%. It is, therefore, derived that the developed methods are accurate and reliable. The data is given in Table 2.
The optimized methods for the estimation of the drugs were found to be precise. This was evident from the coefficient of variation values, the observed % CV for the developed method is between 3-5 % indicating the developed method to be precise. The results are presented in Table 3.
The six blank plasma samples were analyzed and the chromatograms were recorded. Endogenous interferences were not detected at the reten-tion time of selected drugs and internal standard. No addireten-tional peaks were observed in the sample chromatograms.
These peaks, however, did not interfere with the drugs and internal stan-dard peaks. These observations show that the developed assay method is specific and selective and the chromatograms are shown in Figures 4, 5, 6, 7 and 8.
The Retention time of menaquinone-4is 5.5 ± 0.5 mins and Internal Standard Retention time was 8 ± 0.5 mins, therefore there was no inter-ference between internal standard peak and drug peak.
Stability
Table 4: Stability of Menaquinone-4 in Rabbit Plasma during Storage and Sample Handling.
Type of stability Menaquinone-4
S. No LQC (0.85µg/mL) MQC (1.73µg/mL) HQC (4.2µg/mL)
Freeze and thaw
1. 0.79 1.688 3.822
2. 0.801 1.692 3.796
3. 0.786 1.672 3.881
Mean 0.80675 1.6955 3.92475
S.D (±) 0.009601 0.010379 0.058045
C.V 1.190104 0.612166 1.478939
Bench -Top
1. 0.783 1.673 3.771
2. 0.768 1.652 3.713
3. 0.779 1.669 3.801
Mean 0.776667 1.664667 3.761667
S.D (±) 0.006342 0.009104 0.036527
C.V 0.816579 0.546916 0.971033
Short Term Stability
1. 0.797 1.669 3.782
2. 0.768 1.653 3.801
3. 0.78 1.621 3.659
Mean 0.781667 1.647667 3.747333
S.D (±) 0.011898 0.019956 0.062941
C.V 1.522095 1.211137 1.679618
Figure 6: Chromatogram of Menaquinone-4 and IS Standard. Figure 5: Chromatogram of Internal Standard (Vitamin K1).
Limit of detection and limit of quantification
The Limit of Detection (LOD) values for menaquinone-4 was found to be 0.187 µg/ml and the Limit of Quantification (LOQ) value was 0.85 µg/ml. This observation in Table 5 showed that the developed methods have adequate sensitivity. These values, however, may be affected by the separation conditions (e.g., column, reagents, instrumentation and data systems), necessary changes (e.g., pumping systems and detectors) and use of non-HPLC grade solvents and may result in changes in signal to noise ratios.
Stability
symmetric peaks and peaks without optimal resolution suitable for quantification in plasma.
Data on the dietary admission of menaquinones is constrained because of the absence of diet tables that rundown menaquinone-4 fixation in ordinary nourishment. The quantitative analyses of menaquinone-4 till date were done using HPLC-Fluorescence,11-16 HPLC-PDA,17-19
HPLC-MS18,20 and HPLC-MS/MS17,21-24 techniques. Fluorescence detection for
menaquinone-4 was carried in human serum,11,14,15 food,12
nutraceu-ticals13 and human plasma16 for which a post-column reduction with
zinc or zinc added to mobile phase has been used. There is no specified pathway mentioned for post-column derivatization and a comparison of fluorescence detection with other HPLC detections. Retention times of more than 10 mins were observed using HPLC-PDA detection.17,19,22,24
Mass detection was carried out for samples like human milk,17 plant
ex-tracts,18 feces,20 human serum,20,22 cell line,21 human plasma,22 human
os-teoblasts23 and animal milk24 with menaquinone retention times of 9.818
to 30.6919 mins, which is considered as a disadvantage concerned with
the hyphenation. In conclusion, the developed method for the estima-tion of menaquinone-4 in rabbit plasma is rapid, sensitive, precise, selec-tive and linear and is, therefore, can be employed for a bioequivalence study to evaluate its applicability further.
CONCLUSION
A precise, validated bioanalytical method for the pharmacokinetic evalu-ation of Menaquinone-4 was developed and validated. Menaquinone-4 was eluted at 5.5 mins, which is an advantage as no other HPLC method has separated this compound below a retention time of 10 mins. This method also consumes less solvent when compared to other HPLC methods as menaquinones-4 is usually separated using nonpolar sol-vents.
Till date, there were no pharmacokinetic studies of menaquinones-4 in
rabbits were reported. This method can be applied for the
pharmacoki-netic study of menaquinones-4 in rabbits and can be further extended to human trials.
CONFLICT OF INTEREST
The authors declare no conflict of interest.
ABBREVIATIONS
R2: Coefficient of regression; RSD: Relative standard deviation; SD:
Stan-dard deviation; MK-4: Menaquinone-4; MK-7: Menaquinone-7; MK-8:
Menaquinone-8; MK-9: Menaquinone-9; MK-10: Menaquinone-10; IS:
Internal standard; Gla: gamma-carboxy glutamate; OC: Osteocalcin;
MGP: Matrix Gla Protein; QCs: Quality control samples; HQC: High
Ruggedness and robustness
The ruggedness and robustnessof the methods were studied by changing the experimental conditions. No significant changes in the chromato-graphic parameters were observed when changing the experimental con-ditions (Operators, the source of reagents and column of similar type) and optimized conditions (pH, mobile phase ratio and flow rate).
System suitability
TheSystem suitability parameters such as column efficiency (Theoretical plates), resolution factor of the optimized methods were found satisfac-tory and the output is shown in Table 5.
In conclusion, the developed method for the estimation of menaqui-none-4 in rabbit plasma was rapid, sensitive, precise, selective, linear and is, therefore, can be employed for a bioequivalence study to evaluate its applicability further.
DISCUSSION
A simple, cost-effective, accurate and fast HPLC method is vital for the routine measurement of menaquinone-4 in plasma and to further study their pharmacokinetics in animal models. This is to correlate their phar-macological effects to plasma levels and pharmacokinetic behavior. In this article, we demonstrate a novel and simple UFLC-DAD method for the quantification of menaquinone-4 in plasma of albino rabbits. To the best of our knowledge, so far, this is the first validated method that of-fers a simple and fast quantification for menaquinone-4 in rabbit plasma. Optimizing chromatographic conditions was performed using different stationary phases, varying isopropyl alcohol, methanol and acetonitrile compositions and different flow rates. These methods failed to produce
Figure 7: Chromatogram of Blank Rabbit Plasma. Figure 8: Chromatogram of Menaquinone-4 and IS Spiked in Rabbit Plasma.
Table 5: System Suitability Parameters.
Parameters Menaquinone-4
Linearity and Range 0.374-6 µg/mL
Regression Equation 0.4221x - 0.1091
Correlation Coefficient 0.993
Theoretical Plates 7226 /m
Asymmetric factor 1.2
Tailing factor 1.2
Limit of Detection (LOD) 0.187 µg/mL
Limit of Quantification (LOQ) 0.85 µg/mL
quality control; MQC: Middle quality control; LQC: Low quality control;
UV: Ultra violet.
REFERENCES
1. Cockayne S, Adamson J, Lanham-New S, Shearer MJ, Gilbody S, Torgerson DJ. Vitamin K and the prevention of fractures: systematic review and meta-analysis of randomized controlled trials. Arch Intern Med. 2006;166(12):1256-61.
2. Beulens JW, Bots ML, Atsma F, Bartelink ML, Prokop M, Geleijnse JM, et al. High dietary menaquinone intake is associated with reduced coronary calcifica-tion. Atherosclerosis. 2009;203(2):489-93.
3. Geleijnse JM, Vermeer C, Grobbee DE, Schurgers LJ, Knapen MH, DerMeer IMV, et al. Dietary intake of menaquinone is associated with a reduced risk of coronary heart disease: The Rotterdam Study. J Nutr. 2004;134(1):3100-5.
4. Spronk HM, Soute BA, Schurgers LJ, Thijssen HH, DeMey JG, Vermeer C. Tis-sue specific utilization of menaquinone-4 results in the prevention of arterial calcification in warfarin-treated rats. J Vasc Res. 2003;40(6):531-7.
5. Collins MD, Jones D. Distribution of isoprenoid quinone structural types in bac-teria and their taxonomic implication. Microbiological Reviews. 1981;45(2):316-54.
6. Booth SL, Suttie JW. Dietary intake and adequacy of vitamin K. J Nutr. 1998;128(5):785-8.
7. Thijssen HH, Vervoort LM, Schurgers LJ, Shearer M. Menadione is a metabolite of oral vitamin K. Br J Nutr. 2006;95(2):260-6.
8. Schurgers LJ, Teunissen KJ, Hamulyak K, Knapen MH, Vik H, Vermeer C. Vita-min K-containing dietary supplements: comparison of synthetic vitaVita-min K1 and natto-derived menaquinone-7. Blood. 2007;109(8):3279-83.
9. Rishavy MA, Berkner KL. Vitamin K oxygenation, glutamate carboxylation and processivity: defining the three critical facets of catalysis by the vitamin K-de-pendent carboxylase. Adv Nutr. 2012;3(2):135-48.
10. McCann JC, Ames BN. Vitamin K, an example of triage theory: Is micronutrient inadequacy linked to diseases of aging?. Am J Clin Nutr. 2009;90(4):889-907.
11. Toshiro S, Leon JS, Kazuhiro U. Comparision of menaquinone-4 and menaqui-none-7 bioavailability in healthy women. Nutr J. 2012;11(93):1-4.
12. Koivo-Tikkanen TJ, Ollilainen V, Piironen VI. Determination of Phylloquinone and Menaquinones in Animal Products with fluorescence Detection after Post col-umn Reduction with Metallic Zinc. J Agric Food Chem. 2000;48(12):6325-31.
13. Karuppiah SP, Anver BK. Vitamin K2-4 and K2-7 Estimation in Nutraceutical Solid Dosage forms by Post column Derivatization with fluorescence Detection. In-dian J Pharm Sci. 2016;78(4):479-85.
14. Milka M, Dieter L, Philipp W, Matthias W, Olof B, Johannes O. A Validated HPLC Method for the Determination of Vitamin K in Human Serum-First Application in a Pharmacological Study. The Open Clinical Chemistry Journal. 2011;4:17-27.
15. Kalapkova E, Cepova J, Dunovska K, Prusa R. Determination of vitamins K1, MK-4 and MK-7 in human serum of postmenopausal women by HPLC with fluorescence detection. J Clin Lab Anal. 2018;32(5):e22381.
16. Amemiya T, Mizuno S, Hayashi Y, Yuasa H, Watanabe J. Absorption of Vitamin K2 by Dogs after Oral Administration of a Soft Gelatin Capsule Formulation Con-taining a New Emulsion-type Vehicle. J Pharm Pharmacol. 1999;51(12):1375-80.
17. Gentili A, Caretti F, Bellante S, Ventura S, Canepari S, Curini R. Comprehensive Profiling of Carotenoids and Fat-Soluble Vitamins in Milk from Different Animal Species by LC-DAD-MS/MS Hyphenation. J Agric Food Chem. 2013;61(8):1628-39.
18. Vinas P, Bravo-Bravo M, Lopez-Garcia I, Hernandez-Cordoba M. Dispersive liq-uid–liquid microextraction for the determination of vitamins D and K in foods by liquid chromatography with diode-array and atmospheric pressure chemical ionization-mass spectrometry detection. Talanta. 2013;115:806-13.
19. Borivoj K, Jitka P, David P, Vojtech A. Simultaneous determination of water and fat soluble vitamins in pharmaceutical preparations by HPLC-DAD. Anal Chim Acta. 2004;520(1):57-67.
20. Karl JP, Fu X, Dolnikowski GG, Saltzman E, Booth SL. Quantification of phyl-loquinone and menaquinones in feces, serum and, food by high performance liquid chromatography-mass spectrometry. J Chromatogr B Analyt Technol Biomed Life Sci. 2014;963:128-33.
21. Suhara Y, Wada A, Tachibana Y, Watanabe M, Nakamuta K, Nakagawa K, et al. Structure-activity relationships in the conversion of vitamin K analogues into menaquinone-4. Substrates essential to the synthesis of menaquinone-4 in cul-tured human cell lines. Bioorg Med Chem. 2010;18(9):3116-24.
22. Gentili A, Cafolla A, Gasperi T, Bellante S, Caretti F, Curini R, et al. Rapid, high performance method for the determination of vitamin K1, menaquine-4 and vitamin K1 2,3-epoxide in human serum and plasma using liquid chromatog-raphy-hybrid quadrupole linear ion trap mass spectrometry. J Chromatogr A. 2014;1338:102-10.
23. Yoshihisa S, Kiyomi K, Kyoichi T, Kazuko H, Yasuko K. Simultaneous Determi-nation of Menaquinone-4 and Its Metabolite in Human Osteoblasts by HPLC-APCI-MS/MS. Anal Sci. 1997;13(1):67-73.
24. Alessandra G, Alfredo M, Pierpaolo T, Mari EB, Roberta C, Perez-Fernandez V. Liquid chromatography–tandem mass spectrometry method for the determina-tion of vitamin K homologues in human milk after overnight cold saponificadetermina-tion. J Food Compost Anal. 2016;47:21-30.
Article History: Submission Date : 04-12-2018; Revised Date : 21-02-2019; Acceptance Date : 01-03-2019.