I. List of Abbreviations 8 II. List of Tables 9 III. List of Figures 12
1. Abstract 13
2. Introduction 15
3. Characteristics of Nitro-PAH 18
3.1 Structural Formulas and Physical Properties 18
3.2 Sources and Formation 20
3.3 Biological Effects of Nitro-PAH 22
3.4 Industrial Relevance 25
4. Apparatus and Chemicals 28
5. Analysis of Nitro-PAH by High Performance Liquid 32 Chromatography
5.1 Principal Methods and Considerations 32
5.2 Application of Two On-Line Reduction Methods for 41
5.2.1.1 5.2.1.2 5.2.1.3 5.2.2 5.2.2.1 5.2.2.2 5.2.2.3 5.2.2.4 5.2.2.5 5.2.2.6 5.2.2.7 5.2.2.8
Chemical Considerations 41
Implementation Experiments - Results and 43
Discussion
Conclusions 48
Platinum-Rhodium Method 4 9
Packing of the Catalyst Column 4 9
Effects of Catalytic Column Temperature 50
Conditions used for the Nitro-PAH Procedure in 54
this work
Determination of Variability between Injections 55
Determination of Stability of Peak Height Ratios 57
Analysis of Chromatograms 58
Determination of Detection Limits 59
Conclusions 62
6. 6.1 6.2 6.3 6.4 6.5Development of a Method to Test the Identity
of Sample and Standard Compounds during HPLC
Fluorescence Analysis
General Considerations
Experimental Methods
Results
Application Using a Field Sample from a Carbon
Plant -- Identification of 1-Nitropyrene
High Performance Liquid Chromatography
7.1 General Considerations Regarding the Chemical 70
Composition of Organic Extracts from Airborne
Samples
7.2 Description of the Fractionation System Used 71
7.3 Modification Experiments - Results and Discussion 72
7.4 Conclusions 75
8. Determination of Losses During and After 77
Fractionation
8.1 Experimental Methods 77
8.2 Results and Discussion 78
8.3 Determination of Losses by a Short Concentration 7 8
to Dryness for Solvent Exchange Purposes
8.3.1 Experimental Methods 7 9
8.3.2 Results and Discussion 80
9. Filter Selection for Sampling of Nitro-PAH 81
Adsorbed to Airborne Particulate Matter
9.1 General Considerations 81
9.2 Sampling of PAH with Different Filter Systems 83
Nitro-PAH Vapors
10.1 XAD-2 Resin 89
10.1.1 General Considerations 89
10.1.2 Implementation Experiments - 91
- Results and Discussion10.1.3 Conclusions 94
10.2 Polyurethane Foam Plugs 95
10.2.1 General Considerations 95
10.2.2 Precleaning of Polyurethane Foam Plugs 97
10.2.3 Selected Procedure for Polyurethane Foam Plug 99
Extraction
10.2.4 Storage of Polyurethane Foam Plugs 100
10.2.5 Determination and Calculation of the Extraction 101
Efficiency of Polyurethane Foam Plugs
10.2.5.1 Experimental Methods 101
10.2.5.2 Calculation of Recoveries 103
10.2.5.3 Results and Discussion 104
10.2.5.4 Conclusions 108
10.2.6 Recovery and Determination of Contamination of 109
Methylene Chloride in Rotary Evaporator for
Recycling Purposes
Sampling with the Selected Collector Design
12.1 Introduction 117
12.2 Experimental Methods 118
12.2.1 Standards - Preparation and Use 118
12.2.2 Sampling Train and Experimental Conditions 119
12.2.3 Prefiltration of Air Entering the Sampling Train 122
12.3 Results and Discussion 123
12.3.1 Evaluation of Sample Fractionation Chromatograms 123
12.3.2 Recoveries of Nitro-PAH 127
12.3.3 Temperature Effects 131
12.3.4 Effects of Potential Contamination by Ambient Air 132
12.3.5 Effects of Different Flow Rates 135
12.3.6 Effects of Different Total Air Volume 136
12.3.7 Problems During Analysis 136
12.3.8 Breakthrough during Sampling 137
12.4 Conclusions 138
13. Evaluation of Possibilities to Simplify the 139
Sampling of Volatile Nitro-PAH by Application of
an Empirical Equation
13.1 Introduction 139
13.2 Description and Discussion of Approach 145
13.3 Results and Discussion 149
15. Recommendations for Future Work 159
16. Acknowledgements 161
17. References 164
18. Appendix; Proposal for Sampling of Nitro-PAH in 175
Nitro-PAH : Nitrated polynuclear aromatic hydrocarbon(s)
Table Title Chapter
1 Physical characteristics of the nitro-PAH studied 3.1
2 Nitro-PAH formation on substrate during sampling 3.2
3 Concentrations of 1-nitropyrene in ambient air 3.2
4 Mutagenicity of nitro-PAH 3.3
5 HPLC-fluorescence analysis of PAH and amino-PAH 5.1
Tj^: Retention time during HPLC analysis;
Amino-PAH were analyzed using as mobile phase:
Acetonitrile-water 65:35, 0.2 % ammonia, (23, 79, 24)
6 Consistency of peak heights in a set of injections 5.2.2.4
7 Example of calculation of expected peak heights 5.2.2.6
8 Detection limits of nitro-PAH (injection volume 5.2.2.7
0.01 ml, in methanol, temperature of catalyst
column 135 °C)
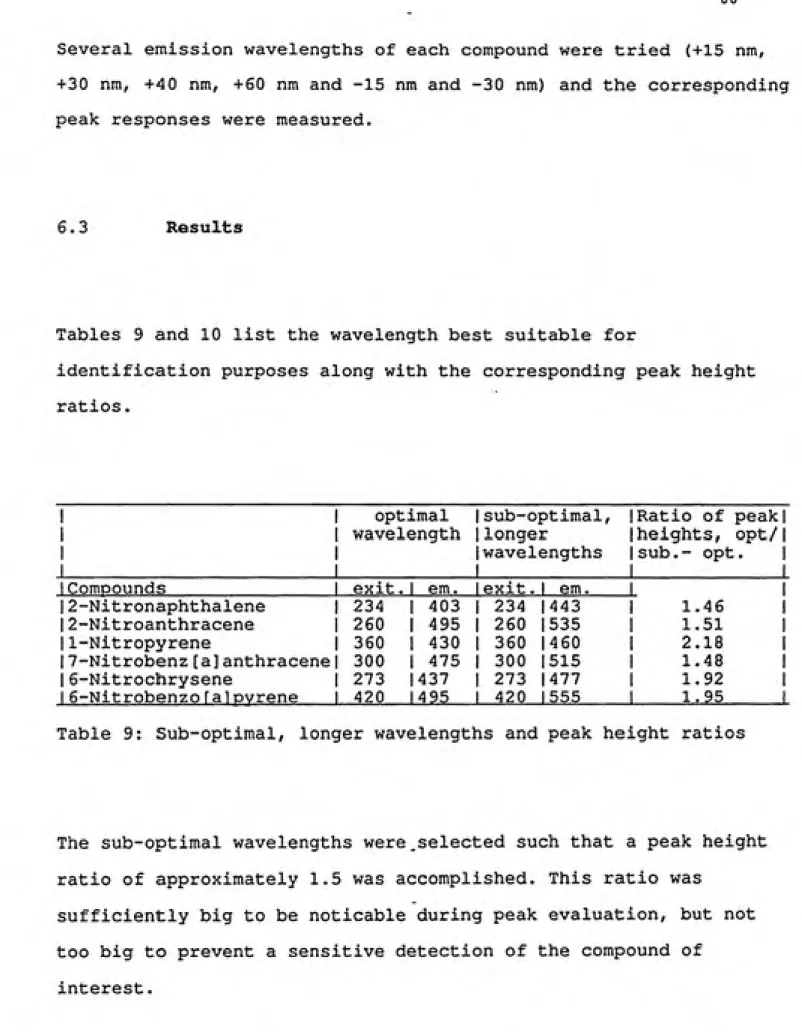
9 Sub-optimal, longer wavelenths and peak height 6.3
ratios
10 Sub-optimal, shorter wavelengths and peak height 6.3
ratios
11 Peak height ratios of compounds in a carbon plant 6.4
air filter sample
Table Title Chapter
13 First fractionation program used, 7.3
flow rate 2 ml/min.
14 Final fractionation program used, 7.3
flow rate 2 ml/min.
15 Nitro-PAH masses injected in fractionation HPLC for 8.1
recovery experiments
16 Recoveries of nitro-PAH after fractionation and 8.2
subsequent sample handling (percent)
17 Recoveries of nitro-PAH after a short concentration 8.3.2 to dryness (percent)
18 Recoveries of nitro-PAH (percent) from 10.1.2
XAD-2 resin
19 ng of nitro-PAH in 0.05 ml methanol injected in 10.2.5.3
center of each PUF plug
2 0 Measured recovery of solvent from PUF plug 10.2.5.3
extraction (percent)
21 Calculated losses of solvent from PUF plug 10.2.5.3
extraction (percent)
22 Recoveries of nitro-PAH obtained by a 3rd PUF plug 10.2.5.3
extraction, and in total after 3 extractions
(percent)
23 Recoveries of nitro-PAH after two PUF plug 10.2.5.3
Table Title Chapter
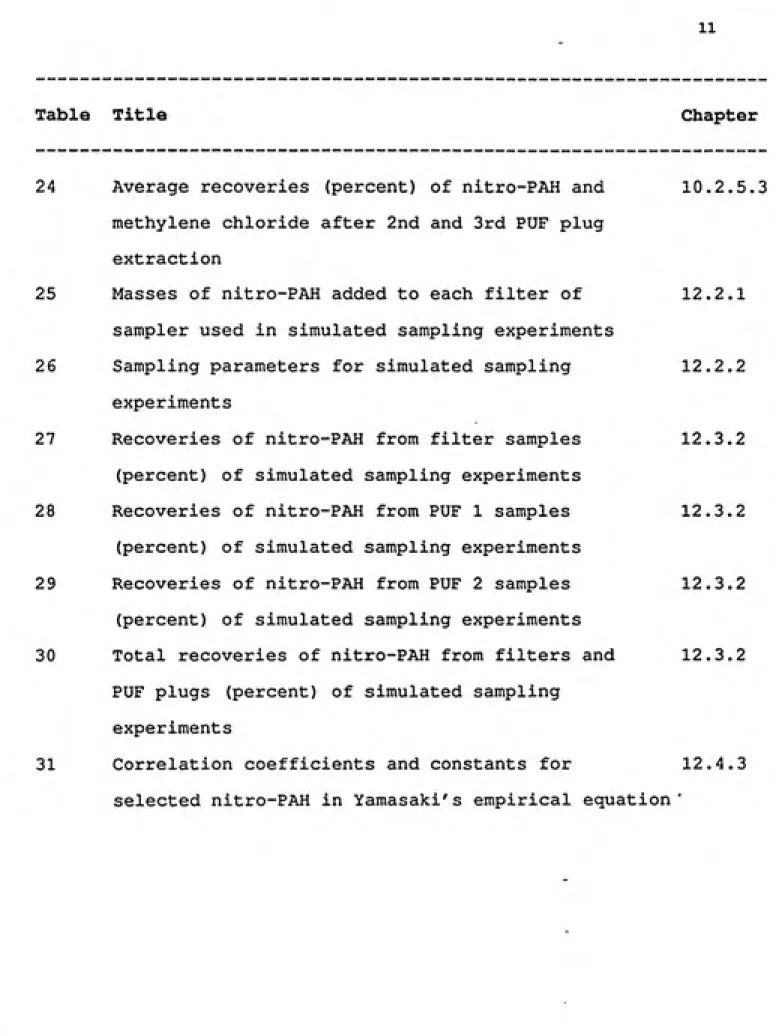
24 Average recoveries (percent) of nitro-PAH and 10.2.5.3
methylene chloride after 2nd and 3rd PUF plug
extraction
25 Masses of nitro-PAH added to each filter of 12.2.1
sampler used in simulated sampling experiments
2 6 Sampling parameters for simulated sampling 12.2.2
experiments
27 Recoveries of nitro-PAH from filter samples 12.3.2
(percent) of simulated sampling experiments
28 Recoveries of nitro-PAH from PUF 1 samples 12.3.2
(percent) of simulated sampling experiments
2 9 Recoveries of nitro-PAH from PUF 2 samples 12.3.2
(percent) of simulated sampling experiments
30 Total recoveries of nitro-PAH from filters and 12.3.2
PUF plugs (percent) of simulated sampling
experiments
List of Figures
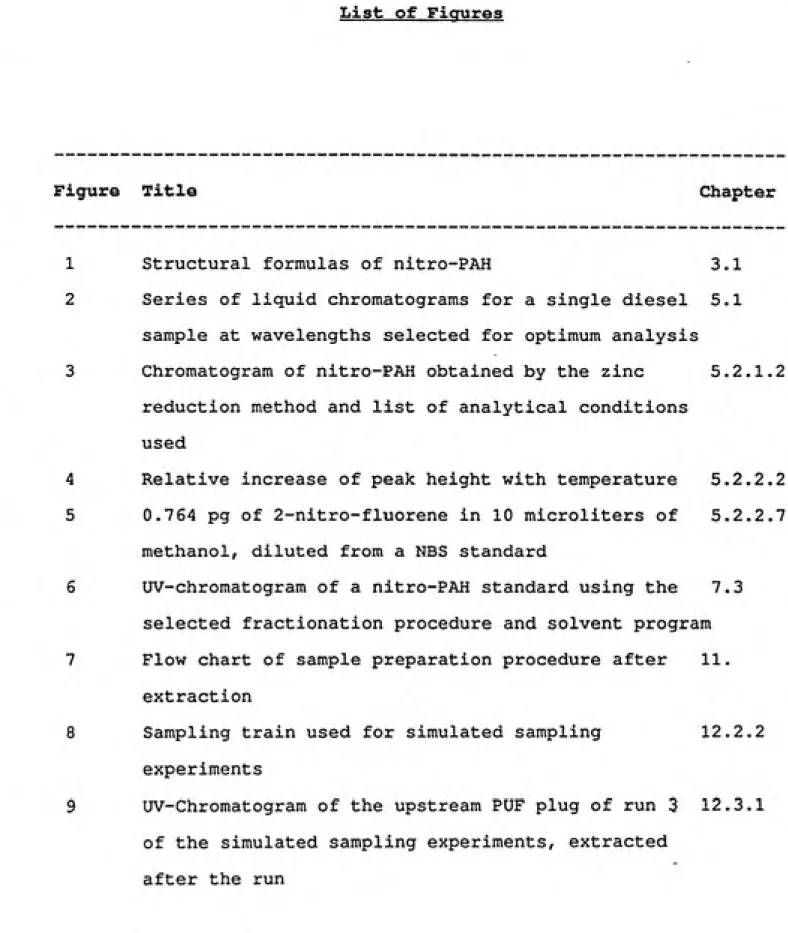
Figure Title Chapter
1 Structural formulas of nitro-PAH 3.1
2 Series of liquid chromatograms for a single diesel 5.1
sample at wavelengths selected for optimum analysis
3 Chromatogram of nitro-PAH obtained by the zinc 5.2.1.2
reduction method and list of analytical conditions
used
4 Relative increase of peak height with temperature 5.2.2.2
5 0.764 pg of 2-nitro-fluorene in 10 microliters of 5.2.2.7
methanol, diluted from a NBS standard
6 UV-chromatogram of a nitro-PAH standard using the 7.3
selected fractionation procedure and solvent program
7 Flow chart of sample preparation procedure after 11.
extraction
8 Sampling train used for simulated sampling 12.2.2
experiments
9 UV-Chromatogram of the upstream PUF plug of run 3 12.3.1
of the simulated sampling experiments, extracted
Figure Title Chapter
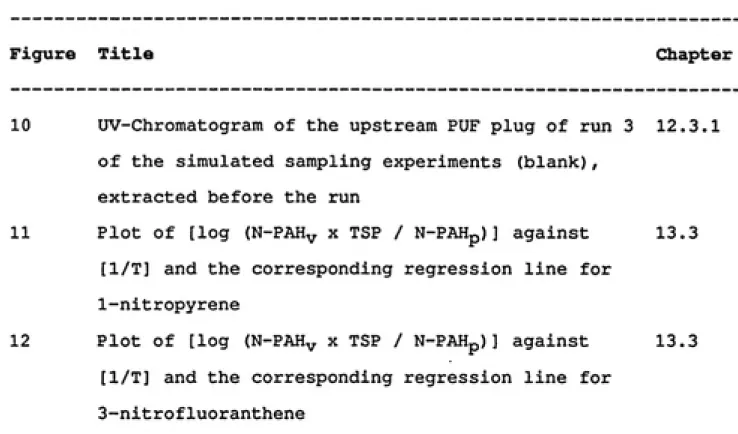
10 UV-Chromatogram of the upstream PUF plug of run 3 12.3.1
of the simulated sampling experiments (blank),
extracted before the run
11 Plot of [log (N-PAH^ X TSP / N-PAHp)] against 13.3
[1/T] and the corresponding regression line for
1-nitropyrene
12 Plot of [log (N-PAH^ X TSP / N-PAHp)] against 13.3
[1/T] and the corresponding regression line for
1. Abstract
WERNER ROHLFS. Development of a Procedure for Scunpling,
Fractionation and HPLC Analysis of Nitrated Polycyclic Aromatic
Hydrocarbons in Air. (Under the direction of RICHARD M. KAMENS)
A procedure has been developed for sampling, fractionation and HPLC
analysis of carcinogenic nitrated polycyclic aromatic hydrocarbons
(nitro-PAH) in air.
A high volume sampling system was selected consisting of a Teflon
coated glass fiber filter and two polyurethane foam (PUF) plugs in
series downstream from the filter. Teflon coated filters were
chosen because of their low catalytic potential for artifact
formation of nitro-PAH during sampling. PUF was used over XAD-2
resin for sampling volatilized nitro-PAH because of better blank
values and extraction efficiencies. Recoveries of simulatedsampling experiments (nitro-PAH added on filters were volatilized
by operating the sampling pumps) were in the range of
73.6 - 93.8 %.
Fractionations of crude sample extracts were performed using a
normal phase preparative HPLC column and an 83 minute solvent
program that controlled the proportions of n-hexane, methylene
chloride and acetonitrile as constituents of the mobile phase.
The selected method consisted of an HPLC separation on a reversed
phase column (Supelcosil LC-PAH (5 micron)) using a mixture of
methanol/water (80/20) as the mobile phase. After separation the
nitro-PAH were reduced on-line to the corresponding amino-PAH using
a heated catalytic reducer column containing a platinum-rhodium
three-way automotive catalyst. A fluorescence detector was used to
quantify the amino-PAH produced. The nine nitro-PAH studied in this
project could be analysed in chromatograms of 17 minutes length and
with detection limits ranging from 7.6 - 90 pg/10 microliter
injection.
The identity between sample and standard compounds could be tested
by comparing peak height changes that occured when non-optimal
wavelengths for the emitted fluorescence light were used for
detection instead of the optimal wavelenths.
In this way, 1-nitropyrene was confirmed in a filter sample from a
2. Introduction
The purpose of this Master's project is to develop a method that is
capable of quantifying trace amounts of nitro-PAH in air.
Research on the analysis of nitro-PAH is necessary because a number
of scientific studies demonstrated the strong mutagenic potential
of these compounds in bacterial (70), 17, 86, 85) and mammalian
(42) test systems. However, the major health concern is that many
nitro-PAH can cause cancer in animals (74, 65, 57). The main
source of these substances incomplete combustion such as diesel
emissions (88, 77, 78). Since probably every incomplete combustion
causes emission of PAH and potentially nitro-PAH, and also because
nitrating agents such as nitrogen dioxide are widespread in our
environment, nitro-PAH are commonly found in ambient air (81, 62,
61, 23, 25, 59).
However, only very few studies have tried to investigate the
presence of these compounds in the occupational environment (82,
64, 26), and almost no information is currently available in terms
of what concentrations can be found in industry. The majority of
industrial operations with some potential for nitro-PAH emissions
remain uninvestigated. These operations include incomplete
combustion processes of various kinds and heating of coal and coal
In order to evaluate the occupational health risk posed by
nitro-PAH, more research is necessary to quantify the compounds in air
samples taken from potential sources in industry.
The goal of this Master's project was to develop a method that
could detect nitro-PAH in occupational air samples. It was
hypothesized that already existing methods for sampling and
analysis could be modified in order to meet the following
requirements:
high sensitivity in order to allow short sampling times
in cases of short source emission periods;
high selectivity since occupational air samples might
include other organics in high concentrations;
collection of nitro-PAH adsorbed on particles and present
as vapors in order to determine the total nitro-PAH
concentration;
testing of the identity between sample and standard
compounds during analysis;
use of common techniques and equipment such as HPLC and
The approach to meet this goal was:
* to select a HPLC method for nitro-PAH analysis that is
sensitive, and not too difficult to operate.
* to find a technique that is selective enough in order to avoid
interferences from other sample compounds, such as fractionation of
the crude sample extract and selective detection;
* to select a filter and a collector material that can retain
nitro-PAH efficiently, that does not catalyze chemical reaction
during sampling, and that allows good recovery of nitro-PAH during
extraction;
* to devise a procedure to test the identity between a sample
and standard compound by means of a specific change in the method
of analysis.
The selection of the developed method was based on a review of
relevant literature and on experiments performed in the laboratory.
This report documents this selection and modification process and
describes the final method for sampling, fractionation, analysis
3. Characteristics of Nitro-PAH
3.1
Structural Formulas and Physical
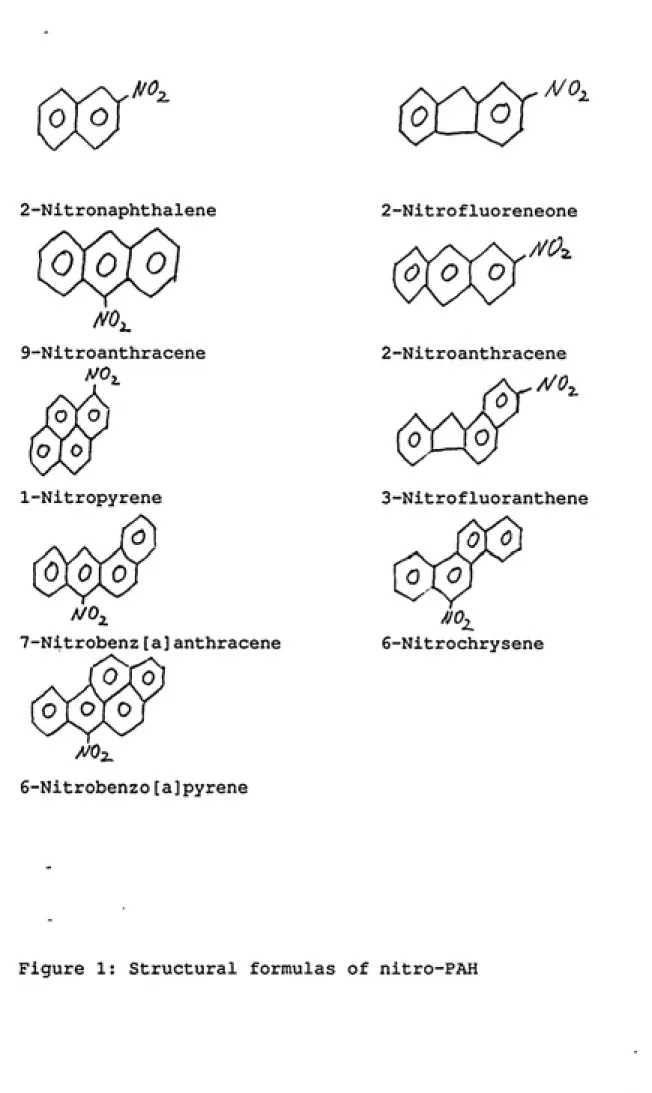
PropertiesFigure 1 shows the structural formulas of the nine nitro-PAH
studied in this project. Table 1 presents some of the physical
properties. However, the boiling points and the vapor pressures of
these compounds were not found in the literature except for
9-nitroanthracene (275 ^C). 6-Nitrochrysene sublimes without
decomposition (2).
1Nitro-PAH Molecular Weight
Meltina Point-^ 1
12-Nitronaphthalene 173.17 79 1
1 2-Nitrofluorene 211.22 158 1
19-Nitroanthracene 233.23 146 1
1 2-Nitroanthracene 223.23 (not published) |
11-Nitropyrene 247.3 155 1
13-Nitrofluoranthene 247.3 160 1
17-Nitrobenz[a]anthracene 274.3 (not published) |
16-Nitrochrysene 273.3 209 1
1 6-Nitrobenzora1pyrene 297.3 251 1
Table 1: Physical characteristics of the nitro-PAH studied.
Also, the sensitivity of nitro-PAH to light-induced chemical
decomposition is not well documented. However, it is known that
9-nitroanthracene is stable in ethanolic solution in the dark but
decomposes to anthraquinone, acetaldehyde and nitric acid when
^0,
2-Nitronaphthalene
9-Nitroanthracene
1-Nitropyrene
Q\0\ 0
7-Nitrobenz[a]anthracene
6-Nitrobenzo[a]pyrene
2-Nitrofluoreneone
/VC2
0]0] o
2-Nitroanthracene
WO,
ea
rSr
0
3-Nitrofluoranthene
^
6-Nitrochrysene
3.2 Sources and Formation
Nitro-PAH may be produced by several sources:
- primary emissions from combustion processes and other
stationary sources;
- atmospheric reactions with air pollutants and oxidants;
- chemical transformation of PAH by air pollutants and
oxidants adsorbed on particles or present in the vapor
phase during sampling (sampling artifacts).
All of these possible sources for nitro-PAH are currently being
investigated by numerous researchers (88, 19).
Early studies detected nitro-PAH on carbon black and photocopies
(5, 76) which caused considerable public interest. However, much
more important sources are diesel emissions (25, 78, 89) and stack
gases from power plants (61) or other types of incomplete
combustion.
Formation of nitro-PAH in the atmosphere or during sampling has
been a concern and was described in a number of studies. Table 2
lists selected chemical reactions (in-situ) between atmospheric
Reactive Gas Substrate/Reactant Product(s) Reference
NoO2^5
NO2
NO2, HNO3
Pyrene
Perylene Naphthalene
Perylene
Benzo[a]pyrene
Benzo[a]anthracene
Benzo[a]pyrene
1-Nitropyrene 67 3-Nitroperylene
1-N-naphthalene 66
3-N-perylene 68
l-N-b[a]p
3-N-b[a]p 6-N-b[a]p
10-N-b[a]p 53
6-N-b[a]p
Table 2: Nitro-PAH formation on substrate during sampling.
One has to be aware of the potential for these reactions when
concentrations of nitro-PAH in air are given because the relative
proportion of sampling artifacts is usually not known. When
evaluating the concentrations of 1-nitropyrene in ambient air given
in Table 3 this concern should be kept in mind.
Location
Range, ng/m-^ Reference
Street level near traffic in Oslo 0.01-0.22 81
Residential area west of Copenhagen <0.001 - 0.4 62
Rural area west of Copenhagen 0.009 +/-0.005 61
Detroit, Michigan 0.016 - 0.03 23
Allegheny mountain tunnel, PA <0.04 - 0.12 25
Industrial area in Japan 0.0208 59
3.3 Biological Effects of Nitro-PAH
Nitro-PAH have been tested extensively for mutagenicity in
bacteria, primarily Salmonella typhimurium (70, 17, 86, 85, 74).
Although the majority of nitro-PAH appear to be mutagenic, the
range of mutagenicity varies widely: between 0
(7-nitrobenz[a]anthracene) and 254000 (1.8 dinitropyrene) revertants
per nanomole (74). Also, the majority of nitro-PAH are mutagenic
in mammalian cell systems (75). The mutagenic potential of a
compound in such a bioassay is a rough indication of its mutagenic
potential for humans. Somatic mutations can cause cancer which is
the health hazard that ultimately needs to be evaluated if a
compound is mutagenic in bacterial or cell test systems.
Several bioconversion schemes of nitro-PAH have been described and
reviewed (74). The metabolism of nitro-PAH to their proximate
mutagenic form may occur by oxidation of the aromatic ring system
to form epoxides, or by enzymatic reduction of the nitro group with
subsequent formation of aryl hydroxylamines (10) . It has been
shown that lung cells and tissue of rabbits are capable of binding
1-nitropyrene or its metabolites to DNA and protein. Also,
macrophages as well as lung and tracheal tissue metabolize
1-nitropyrene by both oxidative and reductive pathways (42) . It is
i.e. nitroreduction, or whether it can be initiated by the
formation of other DNA adducts, i.e. via epoxides (74).
About 80 nitro-PAH have been tested for their mutagenicity in a
bacterial test using Salmonella typhimurium (TA98, +/-S9) (74) .
Table 4 shows the data given for the nitro-PAH studied in this
project.
1 1 Revertants per nano mole |
1 1 +39 -S9 1 INitro-PAH 1 Ref(85) 1 Ref(74) 1 Ref(85) 1 Ref(74) 1
1 1 III I
12-Nitronaphthalene j | | | 0.2|
12-Nitrofluorene | 26.4 j | 433 j 14 |
19-Nitroanthracene | 2.0 j | 2.6 j 0.5j
12-Nitroanthracene | j | | 8 92 |
|l-Nitropyrene | 58.4 | | 4360 I 453 |
13-Nitrofluoranthene | 60 I 1 13400 I 5439 |
17-Nitrobenz[a]anthracene j ! 0 I j 0 |
16-Nitrochrysene | 22.4 | | 269 I 269 |
16-Nitrobenzo[a]pyrene I 141 j 35 I 31.2 j 0 |
1 1 1 1 1 1
Table 4: Mutagenicity of nitro-PAH
It is evident that metabolic activation markedly influences the
mutagenic potential of nitro-PAH (10). The findings shown in Table
4 indicate that some nitro-PAH are so mutagenic that a biological
test system can be of similar detection sensitivity as modern
instrumental analysis such as GC-FID or HPLC-UV. The major public
health concern, however, is caused by findings of carcinogenicity
6-nitroanthracene are powerful cancer-causing agents (74). Among
the compounds studied in this Master's project, the following
nitro-PAH have been shown to cause tumors in animals:
2-nitronaphthalene, 2-nitrofluorene, 1-nitropyrene,
3-nitrofluoranthene, 7-nitrobenz[a]anthracene,
6-nitrochrysene, 6-nitrobenzo[a]pyrene (74, 65, 85, 57, 42).
For the remaining three of the nine nitro-PAH of this project, no
data are available from the literature.
However, there are many other factors that need to be evaluated in
order to estimate the magnitude of the health hazard caused by
nitro-PAH, such as the absolute amounts present in the environment
and the bioavailability to organisms. A high concentration of
nitro-PAH does not necessarily correlate with a high health risk.
For example, the relative high exposure to PAH in aluminum smelters
is not correlated to a great extent in epidemiological studies with
cancer among workers in the aluminum industry (8). A reason for
this observation might be that only a small fraction of the
airborne PAH is taken up by humans.
Similarly, isotopic exchange studies and tissue culture media
extraction studies indicate that only a small amount (10%) of
1-nitropyrene is extracted from fly ash in tissue media (60). Also,
it has been shown that the physical state of nitro-PAH (crystalline
versus adsorbed onto a particle) influences its biodistribution as
well as its retention (74). It is also reasonable to assume that
important in terms of evaluating the bioavailability of nitro-PAH.
The available information is not sufficient to permit a risk
assessment for humans given our lack of knowledge regarding
exposure levels and doses of nitro-PAH to the susceptible organ.
3.4 Industrial Relevance
Nitroaromatics are used to make several thousand consumer products,
which account collectively for nearly 10 % of the chemical industry
sales. Aniline and toluene diisocyanate are the two major
nitroaromatic compounds. Slightly more than one billion pounds of
benzene, toluene and xylene are used annually to make nitroaromatic
compounds worth nearly $ 2 billion (71).
However, practically all nitroaromatics of economic relevance are
one-ring compounds used as raw material for production of polymers,
rubber chemicals, dyes & pigments, pharmaceuticals, pesticides,
etc. (71).
Nitrated polyaromatics are only rarely produced, usually only for
research purposes and in very low quantities. Only 1-nitropyrene
had been produced in industry by a Japanese company in very small
quantities. It was used for the production of 1-azidopyrene, which
However, it appears reasonable to assume that nitro-PAH are
generated as side products in many industrial processes that
include incomplete combustion or heating of material that already
contains nitro-PAH. Unsubstituted PAH are produced under such
conditions and can be nitrated either during or after their
formation.
In an occupational environment, nitroaromatics with two or more
rings were found in only three studies, which all evaluated indoor
air samples in aluminum plants (82, 64, 26) . Among the compounds
found were 2-nitronaphthalene, 2-nitrofluorene, 9-nitroanthracene,
and 1-nitropyrene, which were all studied in this project.
A concentration of a nitro-PAH was given in only one study (2 6):
1-Nitropyrene was found in the potroom of a Soderberg aluminum
plant in a concentration of 64 ng/m^, which compares to
concentrations of unsubstituted pyrene in a similar plant of about
35000 ng/m-^ (volatile and particulate matter) .
of PAH emitted by aluminum smelter techniques employed in the U. S. is generally less, but still sigmificant.
Even though the concentration of 1-nitropyrene appears to be less than l/500th of that of unsubstituted pyrene in the Soderberg process, it is still more than 100 times higher than the
concentrations of 1-nitropyrene found in ambient air (see Table 3 in Chapter 3.2).
The threshold limit value in the Federal Republic of Germany for
1-nitropyrene is 5 mg/m^ in the workplace atmosphere. The 30 min
average standards in ambient air are 0.85 and 0.3 mg/m-^ for short
and long time exposure, respectively (1).
In general, the presence of nitro-PAH in industry (as contamination or side product) is likely. However, due to a lack of published
sampling data a risk assessment is impossible to perform at this
Apparatus and Chemicals
HPLC System Used for Platinum/Rhodium Method:
HPLC: Varian Ass., Varian 5000 Liquid Chromatograph;
Recorder: Fisher Recordall, Series 5000; Fluorescence Detector System:
Power Supply Unit: Perkin Elmer, Model 150;
Detector Unit: Perkin Elmer, Model 650 - lOS Fluorescence
Spectrophotometer;
Ultraviolet Detector: Waters Ass., Model 440 Absorbance Detector;
Analytical Column: Supelco, Reversed Phase, Supelcosil LC-PAH (5
micrometer), 15 cm x 4.6 mm ID., col. #: 30386 Catalyst Column: 4.0 cm x 2 mm ID., see Chapter 5.2.2.1 for
packing;
HPLC System Used for Zinc Method:
Injector: Waters Ass., Model UGK Universal Liquid Chromatograph Injector, 2 ml injection loop;
Recorder: Linear Instruments, Delux Laboratory Chart, triple
Chanel, overall limit of error from all sources less than
0.5 %;
Pumps: Waters Ass., Model 6000 A Solvent Delivery System, (two
pumps);
Fluorescence Detector System:
Power Supply Unit: Perkin Elmer, Model 150;
Detector Unit: Perkin Elmer 650 - lOS Fluorescence
Spectrophotometer;
Separate Fluorescence Detector System used only for Analysis of NBS Diesel Soot Standard:
Varian Ass., Aerograph Fluorichrome Detector, single channel,
filters used: excitation: 340 - 380 nm,
Raman cutoff*): 4 60 nm,
Ultraviolet Detector: Waters Ass., Model 440 Absorbance Detector;
Columns: See Chapter 5.2.1.2 for details.
Apparatus used for Fractionations of Sample Extracts:
The apparatus had been used for fractionation in a number of studies (5, 39, 38, 37, 40) and is identical to the one used for
this project. It consisted of a Tevnary Spectra Physics 8700 high
pressure liquid chromatograph and a Waters Semipreparative M
Porasil (300 x 7.8 mm ID) column.
*) Raman cutoff wavelength: shorter wavelengths than the one given are
Apparatus for Air Sampling;
The Apparatus as shown in Figure 8 in Chapter 12.2.2 for air
sampling was designed and provided by Professor Richard M. Kamens. Glass fibre filters: MSA Glass Fibre Filter WEB, Cat. #: CT-75428,
Mine Safety Appliances Co., Pittsburg, PA
Teflon coated glass fiber filters: supplied by Richard M. Kamens High volume pump: supplied by the Department of Environmental
Sciences and Engineering
Apparatus for Extraction and Sample Handling;
Rotary Evaporator: Buechi, Buechi HP-14 0,•
Shaker: Lab - Line Junior Orbit Shaker, Lab - Line Instruments,
INC., Melrose Park, Illinois;
Petri dishes for filter extraction: diameter 14.8 cm, 1.8 cm depth;
For PUF plug extraction: - beaker, 1 liter graded, diameter 10.3 cm,
- plunger for squeezing PUF plugs, 25
ml graded measurement glass cylinder
with bottom of 5.5 cm diameter;
Chemicals:
Name Purity Source
Nitro-PAH
Silica Gel 60 G
Water Platinum/Rhodium Catalyst Acetonitrile Methanol Methylene Cloride Hexane Toluene Acetic acid Sodium acetate Zinc, granular, 20 mesh.
Zinc, 7.1 micro¬
meter
Olympic 3415 Polyurethane -polyether
flexible foam
pH - paper
For thin layer chroma¬ tography
Distilled in glass
HPLC grade HPLC grade
HPLC grade UV grade
Distilled in glass Glacial, min. 99.7% Fused-anhydrous
A. C. S. reagent
Free of silicon^ density 24 kg/m~
Prof. Richard Kamens E, Merck
University of NC, Dept.
ESE, Room 148
Mr. S. B. Tejada
EM Science Fisher Scientific EM Science BJ BJ EM Science Fisher Scientific Aldrich Chem. Alfa Products
5. Analysis of Nitro-PAH by High Performance Liquid
Chromatography
5.1 Principal Methods and Considerations
After gas chromatography, high pressure liquid chromatography is most frequently used for analysis of extracts of airborne
particulate matter (19).
There are several applications of reversed phase HPLC in the
analysis of nitrated PAH. Most researchers employ a standard HPLC system with column diameters typically about 4 - 5 mm and generally less than 20,000 effective plates. This is considerably less than the more than 100,000 plates that can routinely be generated with
capillary gas chromatography (52).
Several methods are possible to overcome this short separation power in HPLC-technique. One is to employ a multi-column system
(frequently also referred to as column-switching or multi-column chromatography). The idea is to have several columns of different
selectivities in a row. Such a two-dimensional column switching
HPLC system was used to analyse nitro-PAH in diesel extracts (52).
confounded by coeluting peaks, making quantitation of these components difficult or impossible.
Reversed phase column material was also used for separating the
reaction products of a nitration of 10 PAH. The nitrated PAH were detected in a UV detector at 2 60 nm. However, a complete peak separation could not be established with this technique (16).
Another method to deal with insufficient separation capacity in HPLC-technique is the use of highly specific detectors rather than an UV-detector at wavelengths such as 254, 260 or 280 nm which can be used to detect many classes of organic compounds, especially all aromatics. The selectivity of an UV detector can be improved by making measurements at 4 00 nm, but even at this wavelength
interference with other components in environmental extracts is quite common. The limit of detection using UV detection is
generally in the range of 1 - 10 ng/injection (88).
One of the more specific detectors is the electrochemical detector which measures (by an amperometric controller) the electric current
in a cell to which a certain potential difference (between a "working" and a reference electrode) is applied. The amount of current is proportional to the amount of electrochemically active
substance in the cell that causes the current.
In case of nitro-PAH, a reduction to amines is caused by the
(70, 56). Although the sensitivity was good (10 - 100 pg for most
nitro-PAH (70)), several disadvantages also have to be considered:
- The HPLC system required periodic maintainance such as removal of nonpolar residues from the column, and
repolishing of the working electrode.
- Efforts were needed to prevent traces of atmospheric
oxygen from coming into the solvent system (even the
sample needed to be purged of dissolved oxygen with
nitrogen for about 10 min.). This strict requirement has
limited the widespread application of reductive
electrochemical LC detection. However, a promising oxygen removal method via a zinc oxygen scrubber column has
recently been published (55).
- Several nitro-PAH eluted as a single peak.
- Quinones and ketones were detected with sensitivities
comparable to those of the nitro-PAH since they are
reduced at potentials below -0.7 volts. They can, however, possibly be differentiated from nitro-PAH by their
hydrodynamic voltamograms (56) .
A reduction to amines is also performed with a different, very
sensitive and selective detection technique: fluorescence
detection. Unlike nitro-PAH and many other components present in extracts of airborne particulate matter, amino-PAH are strong emitters of fluorescence light and can be detected in even low
The first application of this detection principle for nitro-PAH in
air pollution analysis was published in 1978 with a fluorescence
quenching technique on thin-layer plates. In this case the reducing
agent consisted of potassium borohydride, copper(II)chloride, methanol and water. The detection limits, however, were very high
and ranged from 1 - 500 ng (34).
Three procedures have been proposed in the literature for this type
of detection in HPLC applications: one pre-injection reduction and two on-line reduction methods.
In the pre-injection method (23, 79, 24), an aliquot of a sample extract is treated for 3-16 hours at room temperature with a
reduction solution consisting of sodium borohydride in a mixture of
methanol, deionized water and cupric chloride. The reducing agent
was freshly prepared for each use. The mobile phase consisted of acetonitrile and water buffered with 0.2 % ammonium hydroxide or
t-butylammonium phosphate. Retention times, wavelengths used for
detection and the corresponding detection limits are given in Table
5. It should be noted that these detection limits are the lowest of
Minimum
Compound
mm.
Detect.ion Detection Excit. Emiss. Limit
nm nm pa/iniection
2-Aminofluorene 8.3 290 365 ND
3-Aminofluoranthene 11.1 415 518 23
1-Aminopyrene 12.1 365 430 1.1
Aminobenz[a]anthracene 15.7 310 470 ND
6-Aminochrysene 16.1 345 430 ND
6-Aminobenzo[a]pyrene 24.0 430 498 25
Aminobenzo[k]fluoranthene 24.5 310 495 ca. 2.5
Phenanthrene 7.2 250 365 22
Fluoranthene 8.7 280 500 40
Benzo[c]fluorene 9.5 305 355 2.5
Pyrene 9.9 325 389 9.5
Benzo[k]fluoranthene 15.5 310 404 3.0
Perylene 18.8 430 468 2.0
BenzoFalpyrene 18.0 383 430 8.0
Table 5: HPLC-fluorescence analysis of PAH and amino-PAH LR = Retention time during HPLC analysis;
Amino-PAH were analyzed using as mobile phase:
Acetonitrile-water 65:35, 0.2 % ammonia, (23, 79, 24)
Fluorescence detection offers another advantage in terms of
increased selectivity; as can be seen from Figure 2 - using PAH as
an example - the specific combination of two wavelengths for each
component permits a selective detection even if several compounds
are not well separated. For example, benzo[k]fluoranthene and
perylene were not resolved chromatographically, but at 310 nm
excitation and 404 nm emission, only benzo[k]fluoranthene was detected; and at 430 nm exitation and 468 nm emission, perylene
could be quantified free of interference.
Ben2o(k)fluoranth«n« Ptieninthrene (310,404)
14 J
^
il
h( 250,365)il
Befuci(a)pyrene
C3E3,430)
n
[/VU
0 10 20 0 10 20 0 10 20 Perylene Ben2o(c)fluorene Fluoranihene
(305,355) (280.500) (430,468) 146 14 1 3 i
'.I.
J
"-__,,U"^.
^^
-•._>._Pyrene
(325,3S5)
124
1
L-
JVjiN-0 1JVjiN-0 2JVjiN-0
0 10 20 0 10 20
Figure 2: Series of liquid chromatograms for a single diesel sample
at wavelengths selected for optimum analysis. The time scale in minutes, the level of each compound in ng/mg of diesel particulate, and the fluorescence wavelengths
(excitation in nm, emission in nm) used are shown for
each chromatogram. (reprint from reference 24)
Potential problems of this method include poor photolytic and oxidative stability of the derivatives, poor resolution of
amino-PAH isomers on reversed phase columns, and peak tailing/sample
adsorption on some column packings at low amino-PAH concentrations
On-line reduction of the nitro-PAH to amino-PAH means that this
chemical reaction takes place in a specific reduction column which
is located after the analytical column during the chromatographic run. The principal advantage is significantly reduced sample
handling. Therefore the analysis is easier and faster as well as more precise. The major disadvantage is the requirement of a
oxygen-free mobile phase.
The first method of this kind was published by Tejada et. al. in 1982 (83). This method was later selected for nitro-PAH analysis in
this project.
In this method, the conversion of nitro-PAH to the corresponding amino-PAH takes place in a reduction column that is placed after
the first of two analytical columns. The reduction column consists
of a 5 * 0.46 cm (i. d). stainless steel tube packed with platinum-rhodium on 5 micrometer alumina.
Dissolved oxygen was removed from the mobile phase prior to the analytical and reduction columns by a stainless steel tube (3 inch * 0.46 cm (i. d.), packed with ground (60 - 100 mesh) three-way
automotive catalyst.
efficient (greater than 99 %) and fast (less than one minute). The
analytical system did not require the addition of consumable
derivatization agent. The catalyst generated the reducing agent
from the solvent used in the chromatography. Due to solvent
programming and a column switching technique it was possible to
achieve a good separation of a diesel extract and a sensitivity of
below 10 pg for 1-nitropyrene in standard solution (83).
Two other methods of this kind were published in 1983. In one
application (78) , an unspecified on-line catalytic procedure was
used for fluorescence HPLC. No conversion efficiencies were
presented in that work.
The other application (56) used zinc and an acidic mobile phase to
reduce the nitro-PAH. The injected nitro-PAH were reduced after
chromatographic separation on the analytical column. The reduction
column was dry-packed (with vibration) with one part zinc dust (7
urn, about 200 mg) and two parts silica (20 micrometer, about 400
mg). Approximately one second of peak broadening was observed for a
chromatographic peak of 15 seconds half-width (56).
As a general view of all HPLC techniques described so far, it has
not been demonstrated that isomeric mixtures of nitro-PAH can be
separated adequately by HPLC. This is a major disadvantage of this
technique because a separation of isomers may be essential for
assessing the true health effects aspects of the sample. Moreover,
electrochemical detection methods) are not adequate for quantifying nitro-PAH in environmental samples. Only the fluorescence detection technique appears to be a promising technique, although only a few groups of researchers published papers using this method up to now, including Tejada (83), Kamens (39) , MacCrehan (55, 56) , Greensberg
(27), Schuetzle (78) and Gibson (23, 22, 79, 24).
The objective of this Master's project was to implement an
analytical procedure capable of detecting trace levels of nitro-PAH
in environmental samples. From the literature review, the
fluorescence detection method appeared to be promising due to its superior sensitivity and selectivity. An on-line reduction method appeared to be appropriate for its convenience during sample
5.2 Application of Two On-Line Reduction Methods for
Fluorescence Detection of Nitro-PAH
5.2.1 Zinc Reduction Method
5.2.1.1 Chemical Considerations
Reduction of nitro-PAH by metals in mineral acids always produce
the amine and cannot be stopped at an intermediate stage. The
mechanisms of these reductions have been studied very little,
though it is usually presumed that, at least with some reducing
agents, nitroso compounds and hydroxylamines are intermediates. The
reaction is in short (58):
NO2-PAH + 6 H3O+ ---Zn----> NH2-PAH + 8 H2O
However, under neutral conditions the reduction of nitro-PAH is
reported to stop at hydroxylamines (58).
Hydroxylamines, however, are readily reduced to amines in the
presence of an acid and zinc (58) which indicates that the mobile
phase probably has to be only mildly acidic in order to achieve
complete reaction towards the amines.
The zinc of the short reducer column can be consumed via
dissociation into the mobile phase due to traces of oxygen (55,
88) :
Zn + O2 + 2 H+ ---> Zn2+ + H2O2
Zn + H2O2 + 2 H ---> Zn2+ + 2 H2O
Due to these traces of oxygen the conversion efficiency of the
reducer column rapidly decreased to zero after passage of only a
few hundred milliliters of mobile phase (55, 88). Moreover, the
fluorescence signals of several PAH components show sensitivity to
the quenching effects of oxygen (55). To prevent a rapid
5.2.1.2 Implementation Experiments - Results and
Discussion
The following HPLC columns were evaluated because they were
available in our laboratory and could potentially separate
nitro-PAH:
Micro Bondapak, reverse phase Micro Pak, reverse phase
Particle 10 DDS 2
Micro CN (PIN 8420)
Supelcosil LC - PAH (# 80163) Supelcosil LC - PAH (# 80259)
The columns were tested using an UV-detector and mixtures of
methanol/water and acetonitrile/water as the mobile phase without
the catalytical column.
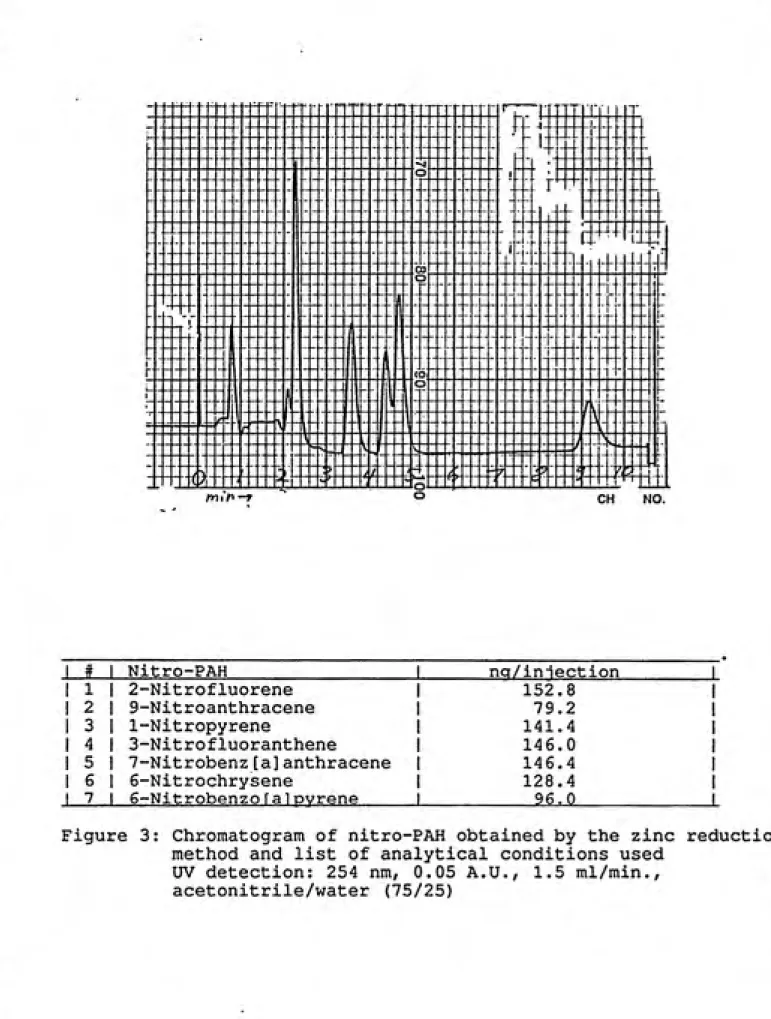
1 # Nitro-PAH nq/iniection 1 1 1 2-Nitrofluorene 152.8 1
1 2 9-Nitroanthracene 79.2 1
1 3 1-Nitropyrene 141.4 1
1 4 3-Nitrofluoranthene 14 6.0 1 1 5 7-Nitrobenz[a]anthracene 146.4 1
1 6 6-Nitrochrysene 128.4 1
1 7 6-Nitrobenzo falpvrene 96.0 1
Figure 3: Chromatogram of nitro-PAH obtained by the zinc reduction
method and list of analytical conditions used
UV detection: 254 nm, 0.05 A.U., 1.5 ml/min.,
The method of packing the catalytical column significantly
determined the performance of the chromatographic system,
especially the peak width. Broad peaks were a central problem with
all reducer columns used. Attempts to separate the corresponding
amino-PAH rather than the original nitro-PAH were not successful.
Also, a gradient program of methanol/water were used to improve
resolution but a strong increase in baseline limited this approach.
Peak broadening by the catalytical column could not be decreased by
using a mixture of one part silica and 0.73 parts zinc dust (by
weight) instead of pure zinc dust. It was not possible to analyze
the nitro-PAH under study when an unfractionated NBS direct soot
extract in methylene chloride was injected that contained certified
amounts of four of the nine nitro-PAH studied in this project.
At this point the work on the zinc reduction method was stopped. A
brief list of some problems that occurred during this work follows:
1) Zinc in the reducer column dissociates into the mobile phase due
to traces of oxygen and elutes out of the HPLC system as zinc ions
(55). Even if an oxygen scrubber column is used there are still
traces of oxygen left that cause slow consumption of the zinc in
the reducer column.
In this work zinc precipitation was observed in the UV detector,
causing an irregular decrease in sensitivity and a danger of
of precipitated zinc could be seen. Sometimes, parts of this
precipitated zinc detached from the cell surface and
- either agglomerated within the detector cell to a bigger
zinc particle (identifiable by a sudden and stable rise in
the baseline of one of the two UV detector cells
- or were flushed out of the system (identifiable by a very
sudden and short peak in the downstream UV detector cell).
Moreover, sometimes capillary connections downstream to the reducer
column clogged although no mechanical changes were performed
immediately before. Once, a capillary downstream to the
fluorescence detector cell clogged, causing a pressure buildup in
the system which destroyed the glass cell of the fluorescence
detector, a very expensive part. Most likely, these blockages were
caused by either precipitated zinc or by zinc particles escaping
the reducer column.
2) Several times the pressure drop at the reducer and oxygen
scrubber column increased substantially, reaching the selected
maximum allowable pressure (4000 psi) of the HPLC-system. This
pressure drop could be lowered to normal values by turning the
columns around. This measure worked only two or three times for a
particular column. Afterwards, the column needed to be repacked.
3) When a mixture of zinc and silica was used for the reducer
4) Sometimes upon emptying an oxygen scrubber or reducer column, it
was found that the packing material had become very hard and
difficult to remove. Once even an electric drill had to be employed
in order to empty an oxygen scrubber column, because the packing
material seemed to have "melted" together. This effect made it much
more time consuming to empty than to pack a column.
5) The peak resolution potential of the analytical column decreased
during prolonged use of the acidic mobile phase at pH 4.7. In order
to prevent or at least to slow down this process, a less acidic
mobile phase (pH 5.5) was used as suggested (56). Nevertheless,
such an acidic mobile phase may not be applicable to some packing
materials of analytical columns.
6) Sometimes leakages in the UV detector occured, causing
precipitation of sodium acetate used in the buffer solution on the
lense and glass surfaces of the detector cell that were difficult
to remove even by ultrasonic treatment in distilled water. Since
acetic acid is a liquid under ambient conditions, this substance
was used rather than the buffer (acetic acid/sodium acetate) to
acidify the mobile phase and to avoid such precipitations in case
5.2.1.3 Conclusions
As discussed in Chapters 5.1 and 5.2.1.1, applications of the zinc
reduction method described in the literature suggested this method
was a relatively selective and very sensitive analytical procedure,
potentially capable of even direct analysis of unfractionated
extracts of airborne particles. When this method was used, however,
the resulting problems suggested that this method was rather
unreliable and time consuming. These problems were:
- deterioration of the analytical column due to acidic
mobile phase;
- difficulty of packing the reducer column reproducibly and
free of dead volume;
- "hardening" of the zinc in the columns during use;
- pressure drop increase in zinc columns during prolonged use;
- frequent maintainance of zinc columns;
- zinc precipitation in the UV detector (and probably also
other parts downstream the zinc columns), causing a
decrease in sensitivity;
- risk of clogging capillaries during chromatographic runs
due to zinc precipitation or zinc particles escaping the
reducer column.
5.2.2 Platin\im-Rhodium Method
The literature does not give as much information about this method
as it does for the zinc reduction method. The original article (83)
described it only rather briefly so that several important
parameters and procedures needed to be determined before the method
could be used for nitro-PAH analysis in other experiments. The
following pages describe the effords made to determine those.
5.2.2.1 Packing of the Catalyst Coliomn
This procedure was expected to require less than an hour, but
turned out to be a rather difficult task. One week of effort was
necessary in order to deal with problems of:
poor chromatographic behavior (peak broadening)
low catalytic action (small peaks) high pressure drop.
The following packing procedure resulted in a working catalys.t
column:
Two particle size fractions of the platinum/rhodium catalyst were
2/3 of 37- 44 micrometer
1/3 of 74- about 100 micrometer
The column (4 cm length, 2 mm ID) was closed on one end and filled
with a mixture of methanol/water (80/20). A funnel was placed on
the column opening and the catalyst was slowly added until the
column was full. The material was stirred slowly with a fine
needle to create a homogeneous mixture and to eliminate bubbles.
During this procedure the level of catalyst material in the column
dropped. More material and solvent were added until full,
sometimes stirring the material again with a needle.
The column was then heated to about 60 °C for a few minutes to
evaporate the free methanol/water mixture on top, leaving the
material on top moist but not wet. Slight pressure was applied by a
thick wire, and some more material was added until the column was
full. The column was closed and used thereafter for all the
experiments described here. However, the pressure drop across this
column increased about 40 atmospheres over 150 hours of operation.
5.2.2.2 Effects of Catalytic Column Temperature
The catalyst of platinum/rhodium needs to be heated in order to
activate the reduction of the nitro-PAH to the amino-PAH (83).
for best system performance and safety. Two criteria had to be
considered:
effect of temperature on reduction efficiency
effects of high solvent temperature on detector cell
safety due to expansion of the cell material.
In order to determine these effects, the following experiment was
conducted: standard solutions of nitro-PAH were injected at
different temperatures and the peak response measured.
Figure 4 shows the results, normalized to a peak height of 1 at the
lowest temperature. There is an exponential relationship between
temperature and peak height which levels off at higher temperatures
of about 130 °C.
The curves also reflect the specific detector response per unit
mass of each compound. For example, at 135 °C a peak of ng
1-nitropyrene would be about 20 times longer than a peak of 1 ng
2-nitroanthracene.
Since the detector response at a certain temperature per ng is
substance specific, and since the dependence between temperature
and peak height shows a substance-specific exponential
relationship, the ratio of peak heights must be temperature
heights therefore requires a constant temperature of the catalytic
column during analysis.
For this project, a temperature of about 135 °C was chosen because
of the following reasons:
1) The curves of Figure 4 are relatively flat at that high
temperature. If the parameter temperature were to show some
variability the peak hight differences caused by such variability
would be smaller at a high temperature of 130 ^C than at a lower
one.
2) Higher temperature provided a higher sensitivity.
3) The capillary between the heated catalytical column and the detector cell had a big enough surface to allow the heated solvent
to cool down to a temperature a little above 36 °C at the cell,
2.2^
-s ero <i. ^ 2 ^
Cr
d^
ins't
>
1.^
~<
^
V
ͣ
5,
1.15
1-0
/^/r?
/3c /^£>
^'f r c r '-^ r c
1 : 2-Nitroanthracene
2 : 6-Nitrochrysene
3 : 2-Nitrofluorene
4 : 2-Nitronaphthalene
5 : 1-Nitropyrene
5.2.2.3 Conditions used for the Nitro-PAH procedure
in this work
The HPLC system was allowed to run for about 30 minutes in order to
reach equilibrium. Sample and standard vials were moved from the
deep-freezer (-60 ^C) and stored in the refrigerator (+4 ^C) until
the actual injection. To prevent carry over from a previous
injection, the injector was flushed with 0.5 ml methanol in the
load and inject position prior to sample injection. Additionally,
two blank injections of pure methanol were done, before
approximately 0.013 ml of the sample were injected in order to fill
the injection loop with a volume of 0.01 ml. The catalyst column
was kept at a constant temperature of about 135 °C. Detection
wavelengths and sensitivities were changed manually for each
compound of a chromatogram. The slit width of the monochromator was
10 nm for both excitation and emission. The mobile phase consisted
of a mixture of methanol/water in the ratio 80/20 and was
constantly degassed by a small flow of helium through the solvent
container solution. A flow rate of 1.3 ml/min was used for all
experiments. In order to prevent boiling of the HPLC eluent in the
catalytic column, a pressure drop downstream from the fluorescence
detector was caused by an HPLC capillary (about 1.5 meter long) and
a pressure pulse damper. The HPLC was operated in a recycling
mode, i.e. the eluent was led back to the solvent reservoir, thus
saving considerable amounts of solvent. Wavelengths used for
No special solvent reductive column was placed before the sample
injection valve. A solvent reduction column filled with automotive
catalyst reduced quenching of PAH fluorescence signals presumably
due to removal of dissolved oxygen (83) . In this project, however,
no significant difference in peak response could even be observed
between degassed and non-degassed HPLC solvent. Thus no attempt was
made to pack an additional solvent reduction column.
No pH modification of the HPLC solvent were performed because
* typical detection limits of this method could be obtained without
changing the pH value: 5 pg of 1-nitropyrene per injection with
this procedure versus 3 pg according to (83).
* a mobile phase of pH 8 as described in (83) is likely to cause
some column deterioration over time.
5.2.2.4 Determination of Variability between Injections
The variability of injection during HPLC analysis was checked by
calculating standard deviation and relative deviation of peak
Number of injections 5 5 4 3 Average peak
height (cm) of a nitro-PAH
20.76 9.74 5.63 12.9
Std. dev. rel. dev. in % (Std. dev.)x(lOO) (aver.) 2.6 0.99 1.23 0.17 12.75 10.13 21.8 1.34
Table 6: Consistency of peak heights in a set of injections.
As can be seen, the relative deviation varied considerably.
Therefore several injections were required to average out this
random variability, which was most likely due to a technical
problem of the injector: a small leak between the syringe needle
and a Teflon seal.
An internal standard was not used because:
* an internal standard would have to have very similar properties
to the nitro-PAH under study if it were to be used prior to
fractionation. It also would have to be fluorescence active.
* an internal standard should not be present in a real sample of a
field study.
To find such a compound would be very difficult.
Even if the internal standard were to be used after fractionation,
its retention chracteristics would have to be such that it would
not interfere with the peaks of nitro-PAH and also would not extend
the total run time. Initially the technical problem in the injector
was not expected to persist so that the experiments were performed
finding such a substance. However, it should be noted that the use
of an internal standard would considerably reduce injection
variability and time required for the analysis of a sample, since
only 1-2 injections would be necessary. It is therefore
recommended that future potential users of the method described in this project find an appropriate substance as internal standard.
5.2.2.5 Determination of the Stability of Peak Height Ratios
The stability of peak height ratios between several chromatograms of the same sample was studied in order to improve peak height
analysis of chromatograms that include 7 or less of the 9 nitro-PAH
under study. The following experiment was conducted:
In each of the chromatograms of eight injections of a standard solution, the peak height ratios relative to 1-nitropyrene were determined. The ratios of each nitro-PAH over the eight injections
were averaged and the standard deviation and relative deviation
were calculated. The relative deviation was defined as
Rel. dev. = (Std. dev.) x (100) / (average).
The relative deviation of the nine compounds ranged from 1.15 - 5.8
versus measuring the true peak heights would be about 3.35 % of the
true peak height. This error appeared to be acceptable.
5.2.2.6 Analysis of Chromatograms
The peak heights of standards and samples were measured and
standardized mathematically to the same detector conditions.
Concentrations in the sample were determined by comparison with a
standard analyzed before and after the sample injection series. In
this way, an analysis of a single sample required up to about 12
injections. If several samples were to be analyzed, a sequence of
"standard - sample - standard - sample" was used, thus requiring
about 8 injections per sample analysis. No carry over between
standards and blanks was observed if the precautions prior to an
injection were followed that are described in Chapter 5.2.2.3.
Since in a sample analysis the peak height ratios of different
nitro-PAH in a chromatogram remained almost constant between
several injections, it was also possible to calculate the expected
peak height of a compound in an injection where that particular
compound was not directly determined. Due to differences between
injections, the absolute peak heights showed significant
variability (about 15 %) from one injection to another. However,
the ratio of peak heights within each injection did not change
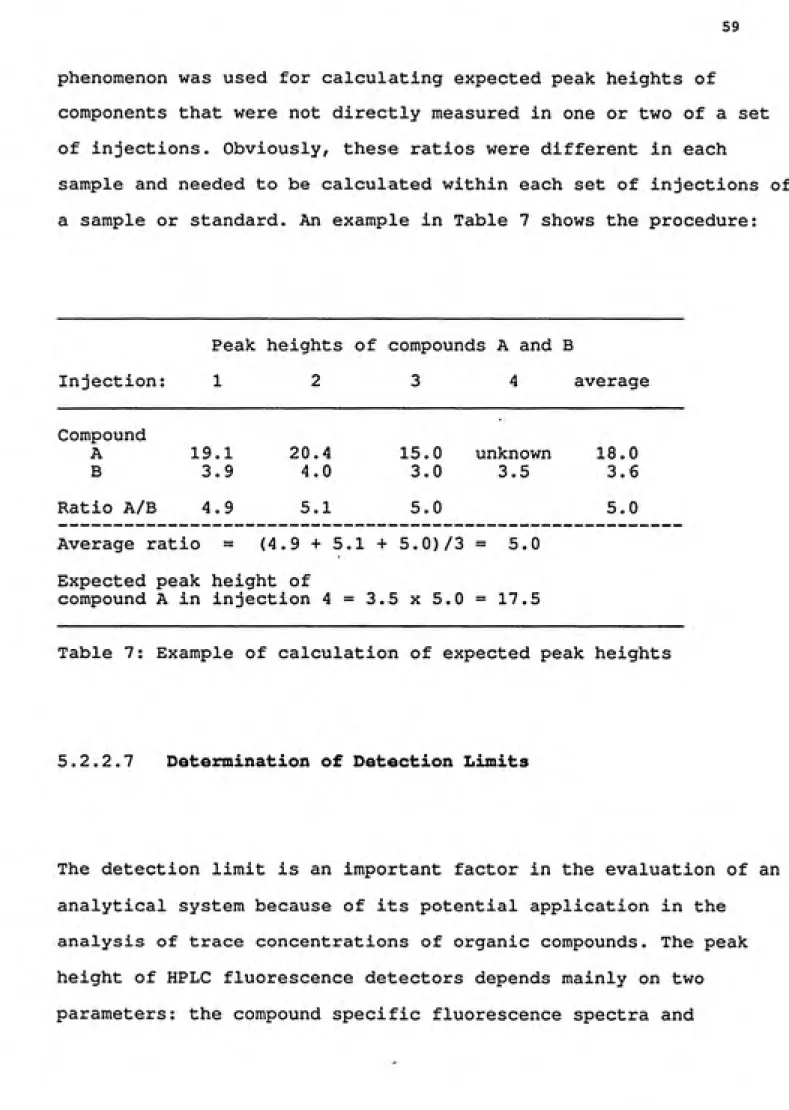
phenomenon was used for calculating expected peak heights of
components that were not directly measured in one or two of a set
of injections. Obviously, these ratios were different in each
sample and needed to be calculated within each set of injections of
a sample or standard. An example in Table 7 shows the procedure:
Peak heights of compounds A and B
Injection: 1 2 3 4 average
Compound
A 19.1 20.4 15.0 unknown 18.0 B 3.9 4.0 3.0 3.5 3.6
Ratio A/B 4.9 5.1 5.0 5.0
Average ratio = (4.9+5.1+5.0)73= 5.0
Expected peak height of
compound A in injection 4=3.5x5.0= 17.5
Table 7: Example of calculation of expected peak heights
5.2.2.7 Determination of Detection Limits
The detection limit is an important factor in the evaluation of an
analytical system because of its potential application in the
analysis of trace concentrations of organic compounds. The peak
height of HPLC fluorescence detectors depends mainly on two
technical features of the fluorescence detector such as cell volume
and geometry, intensity of the light beam from the lamp,
sensitivity of the actual detector and whether a monochromator or a filter is used for wavelength selection. Detection limits for
fluorescence detection are therefore principally also a function of
the apparatus used.
The detection limit was determined using the chromatographic system
and method as described in Chapter 5.2.2.3. Standards were prepared by diluting aliquots of the NBS standard solution with methanol. The detection limit was defined as being a peak of 3
times the noise width. As an example, Figure 5 shows the detection
limit of 2-nitrofluorene. The detection limits are listed in Table 8.
1 Nitro-PAH pa/iniection 1
1 2-Nitrofluorene 7.6 1
1 9-Nitroanthracene 54 1
1 1-Nitropyrene 5 1
1 3-Nitrofluoranthene 74 1
1 7-Nitrobenz[a]anthracene 40 1
1 6-Nitrochrysene 90 1
1 6-NitrobenzoralPvrene 40 1 Table 8: Detection limits of nitro-PAH
(injection volume 0.01 ml, in methanol,
1
11
1 !
1 1 1
1 i 1 M 1 o CM 1 ! i
1 1 !
^
'ill
Uji^1
n
I
f
i
i : O j 1 i i 1 '~ . 1 1 :
' I
! 1
i i 1
' ; !
i h 1
ͣ
, . : 1 t 1
!!
1 i 1 1 ^ 1
Figure 5: 7.64 pg 2-nitrofluorene in 10 microliters of methanol,
diluted from NBS standard
As can be seen, there are significant differences between the
various detection limits, which range from 5 to 90 pg per injection
of 0.01 ml. These values are in the same range as values published
5.2.2.8 Conclusions
The platinum - rhodium method for HPLC analysis of nitro-PAH was successfully implemented for this work. The detection limit
obtained with this system appeared to be adequate. However, several difficulties are associated with this technique:
- packing of the catalyst column is time consuming;
- catalyst material needs to be heated well above the boiling
points of the HPLC solvents which requires a sufficient pressure
drop downstream the catalyst column;
- if the use of an internal standard were to be desired a compound would have to be found for this purpose that is fluorescent, does
not interfere with the compounds of interest and is stable at the high temperature of the catalyst column.
6. Development of a Method for Testing the Identity
between Sample and Standard Compounds during
HPLC Fluorescence Analysis
General Considerations
Organic extracts of airborne particulate matter and semivolatile
components are usually very complex mixtures containing up to
hundreds of substances. Even though a fractionation prior to
analysis will usually help prevent interferences from other
compounds, there is no guarantee of an "easy" analysis.
Interference might be due to other nitro-PAH than the ones of
interest or due to compounds of different chemical nature. The
identity of the observed peak with the one obtained by a known
standard needs to be established.
In general, it is common practice to prove the identity of a sample
compound with a known standard by two different analytical
procedures that use different compound characteristics for
analysis. Since it is very time consuming to implement two
instrumental analytical methods for nitro-PAH analysis (such as
HPLC with fluorescence detection and gas chromatography with
nitrogen sensitive detection), a more convenient way of peak
Many organic compounds are not fluorescence at all. Those which
are have unique excitation and emission spectra. It is therefore
extremely unlikely to find two compounds that show the same change
in fluorescence light after a change in the combination of
excitation and emission wavelenths.
It was therefore assumed that the identity of a sample and a
reference compound is proven if all three of the following criteria
are met:
1) Both compounds are collected in the nitro-PAH fraction during
the fractionation step.
2) Both compounds have the same retention time on the analytical
HPLC.
3) Both compounds show the same response ratio if the emission
wavelength used for detection is changed from the optimum to a
non-optimum wavelength.
If conditions one and two were met, both compounds would have at
least very similar polarities and chemical structures because they
would have the same^ distribution coefficient between solid and
liquid phases in two different chromatographic systems. Condition
three would require an identity of the fluorescence spectra of the
criteria can be met by two different compounds. The main advantage
of this approach is its
* convenience: no additional analytical method needs to
be implemented.
* sensitivity: the most sensitive fluorescence detector can be
used.
The main disadvantage is of conceptual nature: the identity of two
compounds is only concluded, not directly measured (as it would be
possible using mass spectroscopy). However, in most cases an
identification by these criteria would be considered sufficient.
6.2 Experimental Methods