M.S. in I.S.degree. July, 2003, 47 pages, Advisor: Deborah Barreau
This paper describes and evaluates a tool developed to analyze communication interaction of Newslib LISTSERV using Bales’ Interaction Process Category. In this study, Microsoft ACCESS was used for managing data and SAS Enterprise Guide was used for performing the statistical analysis and representing their results.
The purpose of analyzing Newslib LISTSERV is to determine if there is evidence that this LISTSERV helps to create and reinforce a “community of practice” among the special librarians who work in a variety of News organizations. The results show that this group behaves as a community of practice by interchanging information or knowledge actively in their domains.
The ACCESS relational database system is suitable for this study to organize and
manipulate data because the relationship between entities needs to be modeled. The SAS Enterprise Guide is very useful to perform statistical analysis and represent results with new features such as the GUI interface and automatic output delivery system.
Headings:
Community of Practice -- Social Aspects
Electronic Communication Interaction -- Research Bales’ Interaction Process Category -- Research Relational Database System -- Database
A FRAMEWORK FOR ANLAYZING ELECTRONIC COMMUNICATION: BALES’ INTERACTION PROCESS CATEGORIES
AND A COMMUNITY OF PRACTICE
by Junghee Choi
A Master’s paper submitted to the faculty of School of Information and Library Science of the University of North Carolina at Chapel Hill
in partial fulfillment of the requirements for the degree of Master of Science in
Information Science
Chapel Hill, North Carolina July, 2003
Approved by:
CONTENTS
OVERVIEW ---1
BACKGROUND • Purpose of Analyzing the Newslib LISTSERV --- 2
• Bales’ Interaction Process Category --- 3
• Previous Related Studies --- 5
METHODOLOGY • Designing and Developing Database --- 7
• Collecting Data --- 9
• Entering Data --- 10
• Manipulating Data --- 12
• Analyzing and Representing Data --- 12
RESULTS OF STATISTICAL ANALYSIS • Category Analysis for All Messages --- 16
• Category Analysis for Each Message Type (initial message and response message) --- 18
• Interaction Analysis between Initial and Response messages --- 19
• Analysis of Newslib Member Interaction --- 22
EVALUATION • Bales’ Communication Interaction Category --- 23
• Using ACCESS --- 24
• Using SAS Enterprise Guide --- 24
CONCLUSION --- 26
WORKS CITED --- 28
APPENDICES A. Table List in this study Database System --- 29
B. An Example of the Newslib Mailing Digest --- 30
C. Category Code Results and Sample Messages Found in this study --- 31
D. Append Query List --- 36
E. Auxiliary Query List --- 37
F. Main Query List --- 38
G. List of Messages Statistical Analysis Result --- 40
H. List of Member Statistical Analysis Result --- 42
LIST OF TABLES Table 1. Bales’ Interaction Categories --- 4
Table 3. Steps and Methods of Member Analysis --- 16
Table 4. Results of Category Area for All Messages --- 18
Table 5. Conversation size and its Frequency --- 20
Table 6. Results of Member Analysis --- 22
LIST OF FIGURES Figure 1. ER Diagram and Database Schema --- 8
Figure 2. “Message” Form for Entering Messages’ Data --- 11
Figure 3. Result of Category Analysis for All Messages --- 17
Figure 4. Category Results Grouping by Each Message Type --- 19
OVERVIEW
The introduction and rapid development of information technologies have
changed the work patterns in organizations. With organizations more dependent than ever
on information technology, many scholars and practitioners are devoted to finding out the
implication of these changes and the future role of information specialists. This paper
builds on the research data collected by Dr. Deborah Barreau who is interested in the
vision and practice of the new information professional. One of the questions in her
research addresses how communities of practice support professional in organizations
that have to deal with the pressure to cut costs while using technology to improve
efficiency (2-9).
Communities of practice have a social role in helping professionals to become
integrated into a community, learning group norms. They also have task-related
characteristics in helping members of their group to be successful and conform to
standards. Since communities of practice have similar functions to smaller group that are
formed in professional organizations to accomplish work, it is worth looking at the
potential of Bales’ communication interaction categories to analyze interaction among
members of one community. The purpose of this paper is to describe and evaluate a tool
developed for analyzing electronic communication in a community of practice (SLA’s
News Division), using Bales’ communication interaction categories to follow
conversational threads. Analyzing the electronic communication interaction of
professional librarians who work in various kinds of News organizations may lead to a
better understanding of how these practitioners support and collaborate with each other.
1. Is there evidence that the Newslib LISTSERV helps to define and
maintain the community of news researchers in the way Bales observed
for small groups and Knuppel observed for Usenet NEWSGROUPS?
2. Can the analysis of the Newslib listserv be partially or fully automated to
make the technique more useful to others?
First, this paper discusses the background of this study. Second, it describes the
method of collecting, organizing, analyzing and representing data. Third, it shows the
statistical results of the communication patterns of News Division community. Lastly, it
evaluates a tool developed for this study.
BACKGROUND
Purpose of Analyzing Newslib LISTSERV
The Newslib LISTSERV was selected to observe the electronic communication
interaction pattern of a community of practice. “Communities of Practice” is a term that
refers to an approach or methodology for creating and sharing knowledge as social
participation. Jean Lave and Etienne Wenger used this term in their book, ‘Situated
Learning’, and Wenger has studied how organizations collectively create and share
knowledge. With colleagues McDermott and Snyder, he defines communities of practice
as “groups of people who share a concern, a set of problems, or a passion about a topic,
and who deepen their understanding and knowledge of this area by interacting on an
Newslib is a mailing list dedicated to news libraries and news research under the
News Division of the Special Libraries Association (SLA), an international association
representing the interests of information professionals in over seventy countries. The
News Division is an international organization for print and broadcast news librarians,
news researchers and others interested in the role that information plays in quality
journalism. Its objectives are as follows:
• To encourage and promote the utilization of knowledge through the collection, organization, and dissemination of information to its members • To develop usefulness and efficiency of news media libraries
• To publish and stimulate research • To promote high professional standards
• To facilitate communication and cooperation among its members and with organizations that have similar allied interests (News Division).
One purpose of analyzing the Newslib LISTSERV is to examine how this
LISTSERV supports creation and reinforcement of a community of practice among the
special librarians who work with editors, journalist or others who have different
background or training in a variety of news organizations. Another reason for analyzing
the LISTSERV is to determine how much of the process may be automated.
Bales’ Interaction Process Categories
To characterize the communication interaction patterns, a qualitative analysis is
recommended. Bales proposed twelve different behaviors that can be used to characterize
the elements of a small group interaction. Twelve observation categories, numbered from
1 to 12, are divided into two main category areas- “social-emotional” and “task”. The
social-emotional behaviors consist of both positive (categories 1 to 3) and negative
(categories 4 to 6) and questions (categories 7 to 9). Details of Bales’ categories are in
Table 1(258-259).
Category Code Definition
1 Shows solidarity, raises other’s status, gives help, reward 2 Shows tension releases, jokes, laughs, show satisfaction
Social-Emotional Area: Positive
Reactions 3 Agrees, shows passive acceptance, understands, concurs, complies 4 Give suggestion, direction implying autonomy for others
5 Give opinion, evaluation, analysis, expresses feeling, wish Task Area:
Attempted
Answers 6 Gives orientation, information, repeats, clarifies, confirms
7 Ask for orientation, information, repetition, confirmation 8 Ask for opinion, evaluation, analysis, expression of feeling Task Area:
Questions
9 Asks for suggestion, direction, possible ways of action 10 Disagrees, shows passive rejection, formality, withholds help 11 Shows tension, asks for help, withdraws out of field
Social- Emotional Area: Negative
Reactions 12 Shows antagonism, deflates other’s status, defends or asserts self (Table 1. Bales’ Interaction Categories)
Bales developed this interaction process category for small face-to-face group
interaction, but the Newslib community is very large, and their interaction is not
face-to-face conversation. Bales’ interaction process category is used in this study because some
previous studies related to analyzing Computer Mediated Communication (CMC) have
used this category and because Bales himself noted that these categories could be user to
characterize the elements of group interaction(262-263). Since communication
interactions between people vary depending on the situation and audience, there may be
some difficulty in coding the messages in Newslib based on Bales’ categories. It is
or whether the technique can be applied meaningfully to large groups, but one of the
goals of this research is to investigate these issues.
Previous Related Studies
Bales’ categories are often used for qualitative analysis of communication
interaction. Matthew Knuppel used this method in his master’s paper. He analyzed the
communication interaction of a Linux NEWSGROUPS to characterize this community.
After coding the messages from selected specific discussions from the Linux community
NEWSGROUPS, using categories developed by Bales’ interaction process analysis, he
showed the frequency for each category. He found that most of messages were attempted
answers, and the second most frequent behavior was attempted questions (2-4). He
analyzed a NEWSGROUPS interaction whereas this study analyzes a LISTSERV. A
NEWSGROUP is a discussion about a particular subject consisting of notes written to a
central Internet site and redistributed through USENET, a worldwide network of news
discussion groups. NEWSGROUPS are organized into subject hierarchies, with the first
few letters of the NEWSGROUP name indicating the major subject category and
sub-categories represented by a subtopic name. A LISTSERV is a program that automatically
redistributes e-mail to names on a mailing list. Individuals who belong to LISTSERV do
so by choice, and in the case of the Newslib, recipients include journalists, librarians and
others who are connected in some way to the field of journalism. There are traditionally
two types of LISTSERV. One is a one-way method of disseminating of information to a
group. The other type is an open forum, where participants may post information and
some topics, but is different in other ways. Material from a LISTSERV lands in a
personal mailbox, where it demands attention while USENET requires an active effort to
participate. Therefore, we could guess that mailing lists might result in a community’s
collaborating more actively and easily than a NEWSGROUP or USENET.
Another approach to analyze communication patterns was performed by Paul
Solomon who developed an analytical framework for analyzing conversations in
information-seeking contexts. He chose nine conversations from two information-
seeking contexts where the communication is for the purpose of helping one person deal
with some information need by communication with another who is a specialist in
information retrieval, to test the utility of the analytical framework and explore possible
characteristics of information- seeking conversations. In this case, linguistic and
sociolinguistic issues were considered to develop an analytical framework (217). This
study is similar in looking for patterns in communication.
While previous studies have focused on determining the characteristics of
communication, this paper describes and evaluates a tool for analyzing the
communication of a community of practice, along with reporting the statistical results of
communication behaviors and patterns of this community (Newslib). The practical
contribution of this paper is to develop a method for storing, manipulating, analyzing and
representing data for investigating electronic communication behaviors of the Newslib
METHODOLOGY
In this study, there are three steps to analyzing Newslib communication
interaction. The first step was to design a database system to organize and manipulate
data for statistical analysis. The second was to collect the messages from the daily
mailing list digest, and code them using Bales’ interaction process category for
qualitative analysis of communication interaction, and store them into database system.
The last step was to perform statistical analysis and represent the results. The ACCESS
relational database software was chosen for storing and manipulating data and the SAS
enterprise Guide was used for statistical analysis and representation. These software
packages were chosen because they were available at the University and are used widely
for other applications.
Designing and Developing the Database
To design a database system, it is important to decide what kinds of data need to
be stored based on the information needs. In this study, two entities were analyzed-
LISTSERV messages and LISTSERV members. A message needs to be identified as
either an initial thread message or a follow-up response message in order to follow an
interaction and to see the interaction between members. For such a situation, a relational
database system is more suitable than a flat database system like EXCEL even though the
number of entities is very small. There is a ‘one to many’ relationship between message
and member because a member may post many messages. Messages are designed as
initial messages and response messages, and there is a ‘one to many’ relationship
generate many responses. The ER diagram and database schema of this study are in
Figure 1.
ER Diagram
MEMBER
INT_MESSAGE RES_MESSAGE
sends
has ID
e_mail position
date
RMID
topic level
date content
content category
category
Database Schema
MEMBER
( e-mail, position)
INITMESSAGE FK
(IMID, topic, category, date, sender, content)
RESMESSAGE FK FK
(RMID, level, sender, originmessage,content, category)
In the relationships among the entities, three relational tables were developed.
Other than these three relational tables, one stand- alone table that describes Bales’
interaction process was created, and two more tables were developed from queries to
extract and separate data from existing tables. All table lists and their characteristics are
in Appendix A.
Collecting Data
The Newslib mailing system is open and unmoderated, so joining the Newslib
mailing list allows collection of messages from the list digest that includes all of the daily
messages that members sent each other. A sample mailing list digest is in Appendix B.
Other than contents of the mailing list digest, each message was coded using the Bales’
interaction category. The coding process was done while reading the messages from the
mailing list digest. Some messages were coded with more than one category. A sender
might, for example, express his feelings of thanks to members who sent response
messages to his previous message and after that ask some other question. In this case, this
message can be coded with categories 1 and 7. All the analysis code results and sample
messages are in Appendix C. Messages were tracked for a period of three months, from
January 1 to March 31, 2003 and it was not uncommon for a message thread to be
Entering Data
1. Entering Message Data
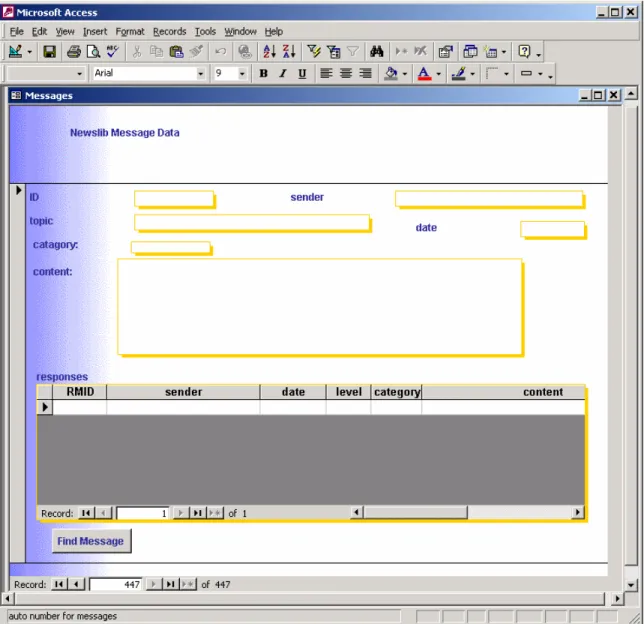
To input data easily and conveniently, a “message” form (Figure 2) was
developed using Microsoft ACCESS. The function of this form is entering message data
into proper tables based on message type. For an initial message, all related data were
input into the “initMessage” table by entering data on the top part of this form. This form
includes a sub-form that enters response message data into the “resMessage” table. The
‘Find Message’ button under the sub form on this “message” form could be used to find
the initial topic message of this response message. Once the initial message was found,
message data for the response was input into the “resMessage” table by entering data on
the bottom part of this form.
2. Entering Member Data
Member’s information is caught from the “iniMessage” and “resMessage” tables.
Since senders’ data is already stored in these two tables, by using the queries we can
catch the sender information without duplicating. These queries performed the two
functions- finding a new sender and appending the data into the “member” table. The
following is the SQL command to do these functions.
Adding initial message senders:
INSERT INTO member ([e-mail])
SELECT DISTINCT initMessage.sender FROM member, initMessage;
Adding response message senders:
By running these two queries, sender’s information was stored into the “member”
table without duplication.
Manipulating Data
Once all the data has been inputted, some pieces of data that are in existing tables
can be extracted and combined by using queries. In this study, three kinds of queries were
developed: Append Queries, Auxiliaries Query and Main Queries. Append Queries were
used in adding data without duplication into the existing two tables- “member” table and
“allMessage” table. The “member” table holds the sender’s e-mail address and
“allMessage” table is developed from queries for further analysis. The “allMessage”
holds all the messages, senders, dates, and categories and message types (initial or
response). Their list and characteristics are in Appendix D. Auxiliary Queries were
developed as a preliminary work for the Main Queries. Their list and characteristics are
in Appendix E. Main Queries were developed to retrieve the selected information for
analysis purposes or end user’s information needs. Their list and characteristics are in
Appendix F.
Analyzing and Representing Data
After all the data were collected, statistical analysis was done in two areas-
messages and members. Some simple statistical results can be obtained by ACCESS
queries using ‘total’ function button, but in most cases, statistical results were obtained
by using the SAS Enterprise Guide. One of benefits of using SAS Enterprise Guide is that
it represents the results very clearly with graphs.
1. Statistical Analysis of Messages
• Code results for all messages: In this analysis, the focus was to find out
Bales’ category patterns for all messages. What kinds of Bales’ categories
were observed for all messages during a period of three months?
• Code results for all messages grouping by message type: In this analysis,
the focus was to watch the Bales’ category patterns grouping by message
type. That is we watched the Bales’ category results separately between
each initial messages and response messages.
• Interaction between the initial messages and response messages:
Conversational communication interactions were formed when an initial
thread message got at least one response message. In this analysis, the
focus was to find out how many group members participated when
conversational communication interaction occurred. Another approach of
interaction analysis was to find out how many response messages were
posted for each Bales’ category of initial messages. By reviewing the
quantity of interaction as well as content, it should be possible to
determine if the LISTSERV demonstrates characteristics of a community.
• Code results for all messages by month. : In this analysis, the focus was to
find if there was any different communication pattern by the time or
special event. It watched how many social-emotional, mixed, or task
category area were observed for each month.
These results created HTML files automatically when the statistical description
show the result of message analysis and their characteristics are in Appendix G. The steps
to analyze of messages in case of using SAS Enterprise Guide are shown Table 2.
2. Member Analysis
In this study, the first concern is to capture the communication pattern of the
Newslib LISTSERV, but the interaction behaviors of each member are a viable
secondary concern. To see all behavior patterns of all members, the query
‘memberHistory’ was generated. Statistical analysis of members was performed for only
active senders. Active senders were defined as Newslib members who posted at least five
initial messages and five response messages. Extracting active senders was performed by
ACCESS and representing their results was performed by SAS Enterprise Guide. The list
of this analysis is in Appendix H. The steps and methods of member analysis are in
Aim of
analysis Step1: Data Import Step2: Perform descriptive statistical analysis Step3: Represent result with graphs Detail results Import query ‘categoryAnal’ from Access Analysis variable: countOfID(number of messages) Classification variable: category Generate bar graph Show category result for all messages Category analysis for all messages Import query ‘categoryAnal’ from Access Analysis variable: countOfID(number of messages)
Classification variable: area
Generate bar and pie graphs
Show
category area result for all messages Import query ‘categoryAnal’ from Access Analysis variable: countOfID(number of messages) Classification variable: category
Group analysis by
initMessage?(message type)
Generate a bar graph
Show category result for all messages, grouping by message type Category analysis for all messages grouping by message
type Import query ‘categoryAnal’ from Access
Analysis variable: countOfID(number of messages)
Classification variable: area Group analysis by
initMessage?(message type)
Generate a bar graph
Show
category area result for all messages, grouping by message type Interactio n analysis between initial thread and response message Import query ‘interaction’ from Access
Analysis variable: number of response messages
Classification variable: category(initial message)
Generate a bar graph Show total number of response messages for each initial message category Category Analysis by Month Import query ‘categorybyMo nth’ from Access Analysis variable: countOfId(number of messages) Classification variable: category area
Group analysis by month
Generate a bar graph Show the results of category area analysis by month
Steps Method Detail results Step 1: Show the
interaction behavior for all members
ACCESS
query ‘memberHistory’ query
Step 2: Select Active senders by using Access query
ACCESS query
‘activeSenders’query
Step 3: Statistical
analysis SAS Enterprise Guide
Show the interaction behaviors for active senders 1. Data import: ‘activeSenderAnalCategory’query from Access
2. Perform descriptive statistical results
Analysis variable: frequency (number of sent messages)
Classification variable: sender Group by category area
3. Represent the result with graph: Generate chart
(Table 3. Steps and Methods of Member Analysis)
RESULTS OF STATISTICAL ANALYSIS
Category Analysis for All Messages
There are 1,115 messages posted in the Newslib between January 1 and March 31,
2003. The results of coding based on Bales’ Categories for all messages are in Figure 3.
Since some messages are involved in more than one category, coding results were more
than 12, which is the number of original categories in Bales’ interaction process.
Counting combination categories involved more than one category, total of 31 categories
appeared in this study. Overall, category 6 (giving information and orientation) and 7
(asking information) are the most heavily represented behavior patterns in this paper.
Category 5(giving opinion, express feeling) and combination category with 1(shows
to express their feeling of thanks and close the initial thread message because a sender of
initial message received some answers or advice. I coded this kind of messages with
category 5. Category 1 and 5 combination were assigned in case of expressing thanks
message and closing the task as well as adding praising comments of person who sending
reply message. It is important to note that at least one example of each of the Bales’
categories were found among the data in this study.
(Figure 3. Result of Category Analysis for All Messages)
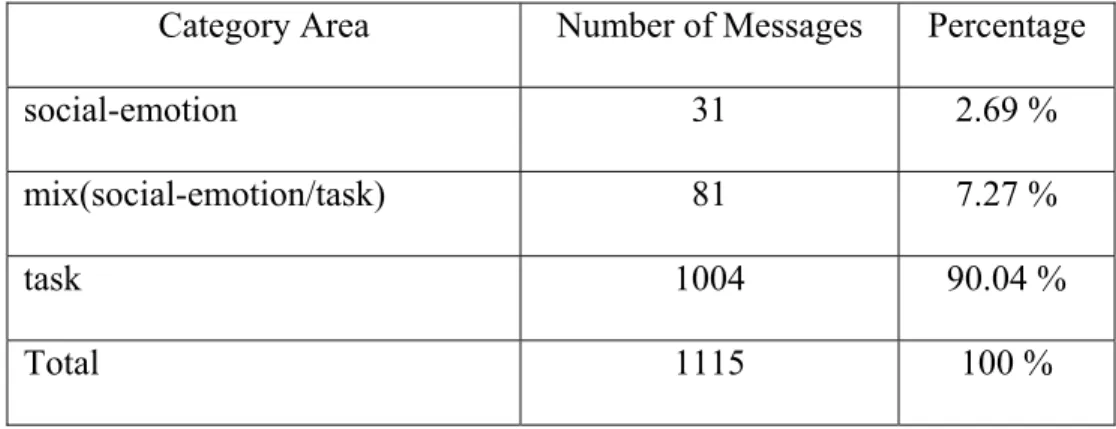
As the Figure 3 shows, the most of categories observed in this study is regarding the task
area. Table 4 shows the total number of messages for each category area (social-emotion,
mix, task) in this paper. More than 1000(90.04%) messages were coded in task category
indicate a community focuses on the LISTSERV because the tasks directly relate to their
jobs as researchers (see examples, Appendix C).
Category Area Number of Messages Percentage
social-emotion 31 2.69 %
mix(social-emotion/task) 81 7.27 %
task 1004 90.04 %
Total 1115 100 %
(Table 4. Results of Category Area for All Messages)
Category Analysis Result for Each Message Type (Initial vs. Response Messages)
Figure 4 shows the category coding result grouping by each message type. As it
shows, most of the messages were coded category 6 and 7, and the top part of bar
(initMessage? 1) represents initial messages and the bottom part of bar (initMessage? 0)
represents response message. This result indicates that the most prevalent behavior of this
community is asking some question or seeking information (initial message, category 7)
and responding to that message (response message, category 6). The second most
prevalent conversation pattern is post information (initial message, category 6) and
asking about that question (response message, category 7).
The main difference between these two message types is in the social-emotional
category area. Even though the social-emotional pattern was found in mix area in initial
whereas there were some social-emotional category areas in response messages. This is
to be expected since many response messages begin by expressing thanks.
(Figure 4. Category Results Grouping By Each Message Type)
Interaction Analysis between an Initial message and Response messages
Among the 446 initial messages, 206 messages had at least one response message.
In this analysis, I observed the communication interaction between 206 initial messages
and 669 response messages involving with these initial messages. To find the interaction
between an initial message and its response messages, two statistical analyses was
performed. First, find out actual number of group members that participated in a thread
and find out the frequency of the same size of conversation group. This analysis was
Num of participants Frequency Num of Participants Frequency
1 77 11 2 2 45 12 2 3 23 14 1 4 25 16 1 5 10 17 1
6 7 19 1
7 4 20 1
8 2 38 1
9 3
(Table 5. Conversation Size and its Frequency)
Most of the conversational communication interaction occurred between 2 people,
and usually less than 7 people (including initial message senders) forming a conversation
group. Therefore, we could say the members’ interactions were performed in a small
group size, however, there were interactions involving as many as 20 and more.
The other approach was observing the total number of response messages for each
Bales’ category of initial message. The results are in Figure 5. As the Figure 5 indicates,
category 7 has the most response messages. This is natural because categories 7, 8, 9 are
asking something about the task. So category 7 appears many times in initial messages
and gets many response messages. The second category that has many response messages
is 6. This pattern can be explained when someone posts or some information on the initial
(Figure5. Number of Response Messages for Initial Message Category)
.
Analysis message category by Month
Comparing the communication interaction pattern by month was an interesting
exercise. While reading messages from Newslib, I noted more social-emotional category
area in February. This can be explained in that, if the month has special days (like
Christmas and Valentine’s Day), there is more active interaction in social-emotional
category area. Similarly, in January there were some message regarding New Year’s
greetings, but these were fewer than the February social-emotional messages. This
pattern can be explained by noting that New Year’s Day is a holiday, whereas
Valentine’s Day is not. Newslib members might have more chance to socialize with each
other by sending messages on Valentine Day, from their workplace, than they did on
Analysis Newslib member interaction
I also tried to find out if there are some roles between members. To do this, I
selected active senders who were involved in both initial thread message and response
message at least five times. According to this condition, nine people were active senders;
their interactions are shows in Table 6. To preserve members’ anonymity, I assigned each
active sender a different letter of the alphabet.
Number of posted message Member
Social-Emotional
Area Mixed Category Area Task Area
A 2 1 8
B 0 2 9
C 0 0 11 D 0 0 39 E 1 3 15
F 0 1 9
G 0 7 12 H 2 3 22 I 0 3 12
(Table 6. Results of Member Analysis)
There is no specific social-emotional category area role between members, whereas
there are lots of task category areas. Member D, the most active sender, is involved only
with the task area. This means Newslib members are using this mailing list for exchanging
information rather than for building social relationships. This reinforces the professional
EVALUATION
This research addressed two questions. The first was whether the LISTSERV
helped to define and maintain a community of news researchers and whether the Bales’
categories would demonstrate this. And second, was whether the LISTSERV analysis could
be fully or partially automated. The following sections summarize the results.
Bales’ Interaction Process Category
Bales’ Interaction Process Categories have been used in this study for qualitative
analysis of conversations on Newslib LISTSERV. Bales’ categories are good for
analyzing communication interaction, but some difficulties were found in coding the
message in this study. As Newslib is an informal and open communication place for
News research librarians, they seem to enjoy discussing personal topics sometimes as
well as task- related topic. For example, on the heavy snow day, someone brought up the
weather issue. Many people joined this thread and they gave information about their local
weather and shared their opinions about the weather. I classified their actions in task area
(category 5, 6, 7, 8) because they were asking for and offering information and opinions.
But on second thought, these messages can be classified in the social- emotional area
because the topic itself was personal and informal rather than related to the task. It is
desirable to develop analytical tools for finding conversation pattern depending on
situations and audience for further study. Secondly, while Bales was useful for analyzing
message threads, there were many other messages posted to the list that resulted in no
Using ACCESS
Relational database systems are widely used for organizing data for academic
research as well as managing data in various kinds of organization. Elmasri points out
some reasons to adopt a relational database system instead of a flat file system. One of
the reasons he identified is complex relationship between the data. Another is the
necessity of modeling data in order to organize and manipulate it easily (32). Both
situations applied to this study. Followings are benefits of using ACCESS in this study:
• Easy data input process- by providing user- friendly interface form
‘message’, user can enter the data into the appropriate table automatically;
• Easy data manipulating- by using queries, user can extract and combine
some pieces of data for analysis purpose or information needs; and
• Flexible report generation- as research evolves, reports can be generated
dependent on information needs
Using SAS Enterprise Guide
SPSS and SAS are the most popular statistical analysis software packages for
academic research. SAS is more flexible depending on the user’s purpose, but SPSS
provides better-looking graphs and its GUI interface is easier to use than SAS’s code
based software. SAS Enterprise Guide, a new version of SAS, provides a user-friendly,
GUI interface. The following are additional functions of SAS Enterprise Guide and the
• Automatic Data Conversion: The original SAS required a data conversion
process; SAS Enterprise Guide can import the data from a database and
convert it automatically.
• Automatic output delivery system: It automatically creates all the
statistical results and graphs in HTML files.
Even with these benefits, SAS Enterprise Guide had some problems in the
representation of statistical results. For instance, due to the complex message interaction,
some messages were coded with more than one category in this paper. For this reason,
the ‘category’ field was defined with a string data format. This causes some problems in
representing the statistical results; the order of the categories should be numerical: 1, 2,
3…10, 11, 12. However, the string data type results in the order 1, 10, 11…2. This order
was not preferable for this analysis because categories were grouped in numerical order.
Each set of three numbers represented a specific category area: positive emotional area
(category 1-3), negative emotional area (category 10-12), attempting answers (category
CONCLUSION
Analysis of Newslib messages using Bales’ interaction process shows that most
Newslib messages regard professional tasks. The most prevalent interaction pattern is
asking information (category 7) in an initial message, and response messages that
attempts answers (category 6) to that initial message. Even though the social- emotional
category was very lightly represented, special days like Valentine’s Day do prompt an
increase in social-emotional categories, providing the opportunity to reinforce social ties
among members of the community. The results of Newslib member analysis indicates no
one has specific role in social-emotional area, but in the task area, some people always
posted new information or gave their opinions. Overall, we can say this community
collaborates very actively by exchanging information with each other. Even though
Bales’ category do not explain the entire interaction pattern of this community, it is still
good to get clear picture of the interacting patterns. One of the analysis results showed
that the conversational communication interaction of Newslib occurred in small group
sizes. In case of forming conversation among members, the number of participants who
were joined in a thread was usually less than 7 peoples and these interactions usually had
occurred within one or two days. In this sense, the communication interaction of Newslib
is similar to the interaction of small face-to- face group.
To analyze electronic communication patterns, this study adopted the relational
database system ACCESS and statistical analysis software SAS Enterprise Guide. The
complex inter-entity relationships require a relational database system rather than a flat
database system to manage data easily. With the flexible SQL commands, user can fully
information needs. Although there were some difficulties in representing data due to the
data format type, the new characteristics of SAS Enterprise Guide allow collected data to
be represented with meaningful statistical results automatically and without a complex
WORKS CITED
Bales, Robert. “ASet of Categories for the Analysis of Small Group Interaction”
American Sociology Review Apr. 1950. Vol 15, Issue2: 257-263.
Barreau, Deborah. “The New Information Professional: Vision and Practice” Final
Report to the Special Libraries Association in completion of the 2002 Steven I.
Goldspiel memorial Research Grant 2003.
Elmasri, R. & Navathe, S.B. Fundamentals of database system 3rd ed Reading, Edition.
MA: Addison-Wesley, 2000.
Saint-Onge, Hubert & Wallace, Debra. Leveraging Communities of Practice for
Strategic Advantage Butterworth-Heinemann, 2002: 32-40
Knuppel, Matthew. “A Characterization of the LINUX Community of Practice Using
Linux NEWSGROUP and Bales’ Interaction Process Analysis” master’s paper of
school of Information Science of University of North Carolina at Chapel Hill
May. 2000.
“News Division”. Special libraries Association News Division . Home page. 25 June. 200
< http://www.ibiblio.org/slanews/ >.
Solomon, Paul. “Conversation in Information-Seeking Context: A Test of an Analytical
Framework” Library & Information Science Research Nov.1997. Vol 19, No. 3:
APPENDICES
Appendix A. Table List in this study Database System
Name Fields Use Feature
iniMessage (446 records)
ID, topic, sender, date, content, category
To store initial thread message data
Inputted data by using message form
resMessage (669 records)
RMID, sender, date, content, category, origin message
To store follow up response message data
Inputted data by using message form
allMessage (1115 records)
ID, topic, sender, date, initial?, level
To show all the messages together. It indicates whether it is initial message or response message along with category. In case of response message, it shows its level.
Inputted data from
‘initMesage’ and ‘resMessage’ table by using append query. This table is used by other query for statistical analysis Category Code, category To store Bale’s
interaction category definition Stand-alone table CategoryResult (32 records) ID, initialMessage, responseMessage,area
It indicates how many initial message and response
messages were found for each category along with category area
(social-emotional or task area)
Stand alone table. The data inputted by me after perform some queries. It will be user for statistical analysis of communication interaction between two message type Member (341 records)
sender to store sender’s email address
Appendix B. An example of the Newslib mailing digest
NEWSLIB Digest for Wednesday, January 01, 2003.
1. Newsstand?
2. Librarians Don Leather to Raise Money
---
Subject: Newsstand?
From: "Al Thibeault" <[email protected]> Date: Wed, 01 Jan 2003 15:08:36 -0500
X-Message-Number: 1
>Dear Listmates:
We are looking into signing an agreement to put our paper, in toto, in PDF format, online with Newsstand. Has anyone else out there had any experience with them?
Thanking all in advance and wishing each and every one of you and your a most happy, healthy, fortunate and joyous 2003.
Alan Thibeault
Assistant Chief Librarian Boston Herald
617-619-6679
---
Subject: Librarians Don Leather to Raise Money From: [email protected] (Judith Ausuebel) Date: Wed, 01 Jan 2003 16:39:10 -0500
X-Message-Number: 2
The librarians of Ocean County, N.J. have posed - in their best black leather outfits ;-) - alongside a Harley Davidson to raise money for their library.
The article appears in today's New York Times: Librarians Trade `Shhh' for `Va-Va-Voom'
http://www.nytimes.com/2003/01/01/nyregion/01LIBR.html
An order form is on the library's website:
http://oceancounty.lib.nj.us/HUH/librariansinleather.htm
Way to goooooo!!!!
Judy Ausuebel
Information Specialist
Appendix C. Code Results and Sample Message found in this study
Code
Result Example message
1 Outstanding work by all!!
1,4 This list is the best! Hi Abigail, thank you too, you are welcome. I phoned with one of my colleagues, it seems to me that you are right and that the company doesn’t exist any longer under that name; he will forward me some additional stuff later tonight, I keep you posted.
Wil
1,5 Thanks to everyone who responded. You're the tops 1,6 Hello Newslibbers,
Linda Chapman's Quick and Dirty Guide to Microfilm Digitization Companies is now available on the SLA News Division Web site at:
http://www.ibiblio.org/slanews/archiving/digitizingfilm.htm. For the version in the site's frames, go to http://www.ibiblio.org/slanews/ and follow the link under What's New? or go to the Archiving in News
Libraries section and follow the link there.
Thanks to Linda for willingly sharing the list and volunteering to maintain it on the Web site!
Thanks to those of you, also, who suggested that it be added to the Web site. It's good to know there are scouts out there looking for resources to add to the site. As always, further suggestions and submissions are welcome.
1,7 Dear Listmates:
We are looking into signing an agreement to put our paper, in to, in PDF format, online with Newsstand. Has anyone else out there had any experience with them?
Thanking all in advance and wishing each and every one of you and your a most happy, healthy, fortunate and joyous 2003.
1,8 I sent this message during the holidays and did not get much response.
So I am trying again. We are redesigning our voter's guide and would like to see what others are doing. The meeting is early next week, so if you could spare a guide (or a photocopy of the guide), please email me and I will provide our Fed-ex number.
THANKS to The Houston Chronicle, The Fort Worth Star-Telegram and The Charlotte Observer for already sending copies.
2 I did share--at least virtually. I emailed Sandy a snowball. 2,5 I can't believe I missed that. I have to concur with Jody...
Barbara - just what is that age old slogan of yours based on anyway?
:-)
Code Result
Example message
3 Right. Now, it would be great if they would put the entire set of Who Was Who in America online somewhere....(It's something we don't have here, & need to get).
3,5 Congratulations to John, Judy, and Ginny, and thanks to the committee for making such good choices. As has been stated they are very worthy recipients.
3,6 I'm agree with all your comments, the number of requests is not important (strictly). Usually for directors, the number is vital to evaluate.
The most approximated answer for the question "how to quantify research work?" that I found was in the concepts related with Knowledge =
Management.=20
Here you can find these concept:
http://www.kmetasite.org/kmetasite/introductory/index.html I hope I could use these concepts to justify resources.
4 I'd recommend placing things on the perimeter...I'm saddled with a set up where my Diebold machines (6 of them) literally divide my staff in half.
Forcing a long walk for any collaboration. My .02 - Mike
4,5 There are now many who are services, each serving domain name service providers and not others. I usually go to www.samspade.org (use the top, "do stuff" box) for a simultaneous search of multiple who are sites. You'll get the entry for the aljazeera.net site, although as it turns out, it will not help answer Keefe's question. I guess I don't understand why Keefe's reporter doesn't just call the network's DC or NY bureaus and ask them for Tucker's number. Seems a lot faster to me, and it may be that, in light of the vituperation aimed at the website, Tucker is deliberately keeping a low public profile these days but will talk to fellow journalists.
4,6 You might try the Audit Bureau of Circulations. Headquarters
900 N. Meacham Road Schaumburg, IL 60173-4968 Tel: 847-605-0909
Their online data is only current, but they've been collecting this kind of information since forever!
5 I would like to thank everyone who took the time to send examples of news library mission statements . It has been a great help. Thanks again.
~Tom
5,6 Sorry about the obvious mistake--I meant, the Census web site has median household income, AND per capita income, for the 1980 census. I didn't mean to say "per capita household income." I know that makes no sense. I'll just blame my lack of brain function on the fact that it's been a long week... 5,7 Of course Newslib is the best discussion list for media libraries to use, it
Code Result
Example message
newslib colleagues, regularly find useful for our work.
I'm mentoring a library school class project on "careers in media libraries", and they've asked for a list of useful listservs. So I'm coming to the Source!
Many thanks in advance, 5,8 Padmini,
I think we all shall be wrestling with this issue sooner or later. Share the wealth.
And Tom's suggestion of the "American Memory" project is a good place to start. Maybe someone from LOC will give some gentle suggestions?
5,10 Miss it? I guess I understand how you can, but if you saw the streets today, you wouldn't be TOO nostalgic!
6 Hello from D.C.
Some new "stuff" for your ready reference file from the U.S. Census and Statistics Canada
1) Updated, U.S. Population Estimates by Age, Sex, Race and Hispanic Origin http://www.census.gov/Press-Release/www/2003/cb03-16.html
"They are the first such estimates released by the Census Bureau since Census 2000."
See Also: Additional Tables and Data Sets
http://eire.census.gov/popest/data/national/asro.php
2) Canada: Canada's Ethnocultural Portrait: The Changing Mosaic, 2001 Census New Full-Text Report.
http://tinyurl.com/4pql
6,7 I apologize for sending the wrong link to the Surveys and Forms section of the SLA News Division Web site. I changed it on the site yesterday and didn't remember to change it in my e-mail to Newslib.
The correct, direct link to the section is: http://www.ibiblio.org/slanews/surveys/.
If anyone has anything they would like to contribute to this section of the Web site, please let me know.
Code Result
Example message
The Freedom Forum provides intensive training programs for beginning journalists and journalism students. We would like provide them with tips from librarians who are working in various news outlets.
For more information:
Freedom Forum: www.freedomforum.org <http://www.freedomforum.org/>=20 Chips Quinn Scholars: www.chipsquinn.org <http://www.chipsquinn.org/> =20 "The Chips Quinn Scholars program offers journalism students of color
hands-on training in journalism and mentoring by caring news veterans. The aim: Provide special support and encouragement that will open doors to news careers and bring greater diversity to the nation's newspaper newsrooms."
Freedom Forum Diversity Institute:
http://www.freedomforum.org/templates/document.asp?documentID=3D12802 "A program to develop a new pool of journalists of color, the institute
at Vanderbilt University in Nashville, Tenn., has graduated its first class. The institute trains non-traditional students to work at their local daily newspaper in the United States. Most students are making a career transition into journalism."
7 Does anybody know of any websites that offer comparisons and reviews of "Dude Ranches"?
7,8 I am curious as to News Librarians' and their respective News organizations' response to the leak from an insider in the Justice Department yesterday to the Center for Public Integrity (www.publicintegrity.org) regarding a draft of potential new legislative expansions to the USA Patriot Act which would include, according to one constitutional scholar, "expansion of law
enforcement and intelligence gathering authority, reduce or eliminate judicial oversight over surveillance, authorize secret arrests, create a DNA database based on unchecked executive 'suspicion' , create new death
penalties, and even seek to take American citizenship away from persons who belong to or support disfavored political groups." Due to the leak, it is
clear that the Department's recent denials of the existence of such plans in the works was dishonest. With a war on Iraq very likely in the near future and the political climate that will create it is reasonable to wonder if this will be remolded through Congress with little legislative or public debate the way the original USA Patriot Act was pushed though shortly after 9/11/01 whereas before it had little support.
The point is that this is important news.
I have noted no coverage at all from the local mainstream media on this in the East San Francisco Bay Area. Was there any coverage in other areas? If not, why not?
Code Result
Example message
information about the w. h. phrase -- as in "wild-hare schemes" or "every once in a while a teen-ager gets a wild hair and acts impetuously."
I've checked various dictionaries including Morris Dictionary of Word and Phrase Origins and Brewer's Dictionary of Phrase and Fable. I found "Wild as a March Hare," but nothing that exactly matches.
Is anyone familiar with the origin of this phrase? Do you have any suggestions for additional sources
8 Hello,
Are there any users of Questia, the online library, out there in Newslib-land? If so, how do you like it for news applications?
8,9 Have any of you used GeoLyctics Census products. Can you advise us?
We are thinking of purchasing the Census Research Package described below. Any shortcomings? Any product alternatives of which I should be
aware? The product must include the historical data back to the 1970 Census. Thanks in advance.
9 One of our editors wants/needs story ideas that involve the "home front": how people helped/dealt with/supported during the Gulf war effort or the war in Afghanistan. Because her request is so vague, I am having trouble narrowing the search terms. Any suggestions for story ideas, stories that your paper may have done, or defining the search?
12 It is absolutley untrue that any photos were altered. Our AME of photography has spent the morning comparing every raw shot with published photos to make sure this did not happen. She too has been bombarded by the rumor.
Appendix D. Append Query List
Name Fields Use Feature
addInitSender sender to input new sender who sends initial message into ‘member’ table
append table query ( append data to ‘member’ table)
addResSender sender to input new sender who sends response message into ‘member’ table
append table query ( append data to sender
‘member’table) addInitMessages ID, sender,
category, date
insert initial message data into ‘allMessage’ table
append table query ( append data to ‘allMessage’ table) addResMessages ID, sender,
category, date
insert response message data into ‘allMessage’ table
Appendix E. Auxiliary Query List
Name Fields Use Feature
ResMessageTopic RMID, topic, sender,category, level,
Retrieve the initial thread topic of follow up response messages
To develop ‘addResMessages’ (append query) NumOfSender_ini nt (230 records)
Sender, Num of initial messages
Show all the senders who sent at least one or more initial thread message and total number of initial messages this sender sent to the mailing list during this time period
To develop ‘member History’ query
NumOfSender_res (243 records)
Sender, Num of response
messages
Show all the senders who sent at least one or more response follow up messages and total number of response messages this sender sent during this time period.
To develop ‘member History’ query
MemberHistory (341 records)
Sender, num of initial messages, num of response messages
Show all members’ activity (how many initial message and response messages they sent)
To develop Active sender query
activeSenders (9 records)
Sender, num of initial messages, num of response messages
Show the members who sent both initial message and response messages more than 5 times and their action history
To develop
Appendix F. Main Query List
Name Fields Use Feature
CategoryAnal Area,category, initMessage?, num of messages
To show the total number of messages of each category for all message
45 categories are observed
CategorybyMonth Area, date, category, num of messages
To show how many messages were posted for each category by month
To help understanding communication pattern by month Interaction
(446 message)
ID, topic, sender, category, number or response messages
To show initial thread message, sender, category and number of follow up messages
240 messages don’t have any responses.
206 messages have at least one
response messages conversation numOfSender,
frequency
To show the frequency of initial messages that has same number response messages
To catch the conversation size- it usually less than 7 including initial message sender init_resCategory
(84 records) Init category, follow up category, number of sender for this action
Show total number of senders for initial and follow up category result
Total number of senders is same number with response messages taskCategory area, category,
initalMessage, responseMessage
show the task area category result
Task areas were divided into task-g(give info, opinion…) and task-a(ask info, opinion, action..) emotionCategory area, category,
initalMessage, responseMessage
show the emotional area category result
Emotion areas were divided into emotion-p(positive) and emotion-n(negative) mixNEmotionTask (0 record) area, category, initalMessage, responseMessage show negative emotion and task category
No record was retrieved
mixPEmotionTask area, category, initalMessage, responseMessage
show positive emotion and task category
mix-p-a : positive emotion and ask info..
Name Fields Use Feature
emotion and give info…
doubleTask area, category, initalMessage, responseMessage
show more than one task category
mix-g-g: give info, action…
mix-a-a: ask info, action…
mix-g-a: give and ask info, action…. doublEmotion
(1 response message)
area, category, initalMessage, responseMessage
show mixed (more than 1 emotional) category
More than one emotional action
activeSenderAnal
_Category Sender, category, frequency of this sender, area
Show the active sender’s category they are involved
Appendix G. Messages Statistical Analysis Result List
Analysis Web address Feature
http://owl.ils.unc.edu/p rojects/Newslib/allCat egory.htm
Descriptive statistic tables- how many messages are observed in each
category for all message http://owl.ils.unc.edu/p
rojects/Newslib/allCat egoryChart.htm
Bar chart of category analysis for all message
http://owl.ils.unc.edu/p rojects/Newslib/catego ryArea.htm
Descriptive statistic tables- how many social-emotional area and task area are observe for all message
http://owl.ils.unc.edu/p rojects/Newslib/catAre aBarChart.htm
Bar chart for category area analysis for all message
Category analysis for all messages
http://owl.ils.unc.edu/p rojects/Newslib/catAre aPieChart.htm
Pie chart for category area analysis for all message
http://owl.ils.unc.edu/p rojects/Newslib/allCat GpByType.htm
Descriptive statistic tables- how many messages are observed in each
category for each initial and response message type
http://owl.ils.unc.edu/p rojects/Newslib/allCat GpByTypeChart.htm
Bar chart for category analysis for each message type
Green(0): response message Yellow(1) : initial message http://owl.ils.unc.edu/p
rojects/Newslib/catego ryAreabyType.htm
Descriptive statistic tables – how many social, task, mix category area message posted for each initial and response messages
http://owl.ils.unc.edu/p rojects/Newslib/catego ryAreabyTypeBchart.h tm
Bar chart of Category Area analysis ( initMessage=0 : response message inintMessage=1 : initial message) Category analysis
grouping by message type( initial thread message and response message)
http://owl.ils.unc.edu/p rojects/Newslib/catego ryAreabyTypePchart.h tm
Pie chart of Category Area analysis ( initMessage=0 : response message inintMessage=1 : initial message)
http://owl.ils.unc.edu/p rojects/Newslib/interac tion.htm
Descriptive summary table- show the total number of response messages for each category of initial thread message Interaction analysis
between initial
message and response message
http://owl.ils.unc.edu/p rojects/Newslib/interac tionChart.htm
Analysis Web address Feature
http://owl.ils.unc.edu/p rojects/Newslib/init_re sCategory.htm
Descriptive summary table- show the total number of response message category group for each initial message category
http://owl.ils.unc.edu/p rojects/Newslib/init_re sCategoryChart.htm
Bar chart for the results of response message category for each initial message category
http://owl.ils.unc.edu/p rojects/Newslib/catego ryAreabyMonth.htm
Descriptive summary table – show the total number of each category by month
Message Category by Month
http://owl.ils.unc.edu/p rojects/Newslib/month Chart.htm
Appendix H. Member Statistical Analysis Result
Analysis Location Feature
MemberHistory (341)
Access query: ‘memberHistory’ Show the number of initial and response messages for all senders
activeSender Access query: ‘activeSender’ Show the number of initial and response messages for active sender who sent both initial and response message more than 5 times.
http://owl.ils.unc.edu/projects/Ne wslib/memberInteraction.htm
Descriptive summary table-shows total messages of each category for active sender Activity of Member
http://owl.ils.unc.edu/projects/Ne wslib/memberChart.htm