Vol. 2, No. 2, pp 126-143 Summer 2008
Implementation Procedures for the Risk in Early Design (RED) Method
Katie Grantham Lough1*, Robert B. Stone2, Irem Tumer31,2
Department of Interdisciplinary Engineering, Missouri University of Science and Technology, Rolla, MO 65409
1
[email protected], [email protected]
3
Department of Mechanical, Industrial, and Manufacturing Engineering Oregon State University [email protected]
ABSTRACT
Risk assessments performed at the conceptual design phase of a product may offer the greatest opportunity to increase product safety and reliability at the least cost. This is an especially difficult proposition, however, as often the product has not assumed a physical form at this early design stage. This paper introduces the Risk in Early Design (RED) method, a method for performing risk assessments based on functions, rather than physical components, to address this challenge. In particular, this paper focuses on the function based mathematical mappings of the RED method for a preliminary risk assessment based on catalogued historical failure information. An example is presented on how the RED preliminary risk assessment method is used in the design process on a spacecraft thermal control subsystem. Also, heuristics for applying the particular types of risk assessments are discussed. The preliminary risk assessment method discussed offers a potentially paradigm-shifting approach to identifying potential areas of concern in a product during the early stages of design when risk mitigation is least expensive. 1. INTRODUCTION
The early and accurate assessment of risks is necessary to anticipate and prevent accidents from occurring or repeating. The impact of risk assessment on the design of a product is greatest in the conceptual, planning, and startup phases of a project. During this phase, design changes are the least costly and easiest to implement. With this in mind, in this paper we address function information with regard to an early stage design at the NASA-Jet Propulsion Laboratory known as Team X (Mark, 2002). This team performs conceptual design for space missions and is a good model for studying design activity given the multi disciplinary team makeup and the variety of missions involved. However, the RED method is applicable to the broader product design field as well. The focus of Team X is on the conceptual design phase of space missions. During this design phase, their product exists first as a set of subsystems or functions it must fulfill before it assumes a physical form (Van Wie, et al., 2005-1). This design team pays special attention to risk in the early stages of design by using a risk expert (known as the risk chair) to solicit and manage risks during the design process. Certain failures warrant the generation of mitigations to reduce risk. Risk elements and any mitigation listed are part of the design session’s final report. This information is
*
used in certain risk support tools undergoing continual development such as the Risk Analysis Prototype (RAP) tool (Meshkat, et al., 2003).
Evaluation of the risk elements produced by the Team X environment has been performed (Van Wie, et al., 2005-2) through direct observation and interviews with subsystem chairs. This evaluation found that the risk elements often do not communicate complete and specific risk information. Therefore, tools that help assess the product risk in this phase are valuable to Team X. Part of the interest in investigating risk and function information during Team X designs stems from
recent work in formalizing functions (Hirtz, et al., 2002) and failure modes (Tumer, et al., 2003).
Currently, there is also an established relationship between product function and failure modes (Stone, et al., in press; Tumer and Stone, 2001; Uder, et al., 2004).
The results of the statistical and linguistic analyses on the Team X risks (Van Wie, et al., 2005-2) show that to communicate risks effectively, a designer needs to address the following risk element properties in their risk element statement: 1) performance parameter, 2) design parameter, 3) noise parameter, 4) failure modes, and 5) failure scenario. In conjunction with the risk element statement, the following data is also useful: likelihood of individual failure modes, impact of individual failure modes, overall risk likelihood, overall risk impact, overall risk, mitigation, mitigated likelihood, and mitigated impact [4]. Much of these types of specific risk information are not recorded in the design process of Team X sessions. The scope of this study is limited to mapping product function to the likelihood and consequence of historical physical failure modes. Therefore, this study addresses the design parameter, failure mode, and likelihood of individual risk elements. It is also important to note here that this work focuses on formulating a generically applicable risk in early design (RED) method as a risk assessment tool in the conceptual design phase of a product; the work is not focused on compiling a complete database of historical product failures.
Prior work by the authors provided significant extensions to the established relationship between product function and failure mode. The extensions link product function to risk likelihood and consequence (Grantham, et al., 2005; 2006). These extensions allow quantitative preliminary risk assessments to be performed early in the design stage, before a physical form of the product has been determined. The intent of the risk in early design (RED) likelihood risk assessments is to provide detailed risk information to designers with the quantitative components coming from catalogued historical events. This paper describes heuristics that allow designers to tailor a risk assessment to the needs of their particular design, as well as step-by-step instructions for performing the risk assessments in the conceptual design phase.
2. BACKGROUND
2.1. Risk Analysis Techniques
Risk assessment has received much attention by various disciplines and has accumulated a variety of techniques to assist engineers with their risk assessment and management. A collection of various risk assessment techniques combined with their characteristics and their advantages and disadvantages is discussed in this section. While these methods vary in their approaches, they all have one element in common – an expert is required to identify the risk based on their experience (i.e., they all are qualitative or subjective). Therefore, the individual (or team) responsible for risk analysis must have the knowledge of all past and potential failures.
Preliminary hazards analysis (PHA) (Holloway, 1987) is a necessary first step in performing a risk assessment because it includes the process of identification of the potential hazards or risks.
Although it is a necessary first step it does not include rigorous quantitative analysis of the risk elements and is dependent on expert knowledge to elicit the risk information. PHA is a step of the failure modes and effects analysis (FMEA) (MIL-STD-1629A). This technique examines all the failure modes of every component. FMEA is easily understood and is a widely accepted and relatively standardized approach for risk assessment (Henley and Kumamoto, 1992). The quantitative portion of the analysis assigns a risk priority number (RPN), that is, a multiplicative result of failure severity, occurrence, and detection. The RPN is the product of three subjective terms and, therefore, is more subjective than the individual components that compose it. Also, FMEA is very time consuming because it relies on experts to thoroughly examine each component of a system to identify its potential failure modes. Hazards and operability studies is a similar risk assessment approach (Lawley, 1974). FMEA focuses on components of a system while hazards and operability studies focus on the processes of a system. Again a PHA is necessary to identify the potential areas of concern. Then a FMEA-like assessment is performed on each process of the system. This method has seen most use in chemical plant risk analyses. Unlike FMEA it is not well standardized and reported in the literature (Henley and Kumamoto, 1992).
Another collection of risk assessment techniques such as fault trees, event trees, and cause-consequence diagrams, are most concerned with identifying sequences of events that have negative impacts (Henley and Kumamoto, 1992). Fault trees (Vesely, et al., 1981) initiate their analysis with an identified failure and work backwards through the system to identify all the events that could contribute to the failure. The end result is a logical tree of system events that cause specific failures. While fault trees are well accepted for risk assessment, often large fault trees become complicated with the logic involved in their construction and are difficult to understand (Henley and Kumamoto, 1992). Event trees are also a type of sequential risk assessments (Frank, 1999). Unlike fault trees, event trees start with an initiating event and propagate that event through the system to identify if it causes failures. This type of risk assessment process is good for identification of sequences of events resulting in a failure as well as alternate consequences of failures. However, like fault trees, the diagrams can become complicated and difficult to understand. Also, event trees cannot model parallel sequences of events [14]. Cause–consequence diagrams are a combination of the fault and event trees (Bohnenblast and Schneider, 1987). The cause-consequence diagrams start their analysis at a critical event and work forward through the system with event trees. Then, once a fault is reached, it is analyzed with a fault tree. This process is an extremely flexible all encompassing risk analysis; however, it is very time consuming and the diagrams are very complicated. Again, these sequenced based risk assessment techniques all rely on the identification of faults or critical events by experts and cannot be performed well by novice designers alone.
2.2. Functional Modeling and the Function Failure Design Method (FFDM)
In contrast to the above risk analysis tools that are component-based or process-specific-based, we now consider risk approaches that are function-based. A functional model is a description of a product or process in terms of its elementary operations or functions that are required to transform its input flows of energy, material, or signal into desired output flows. Some important definitions associated with functional models are:
Definition 1. Flow: a material, energy, or signal that is used by or affects the product
Definition 2. Function: the operation that the product performs on a flow or a set of flows to transform it from its input state to its output state
Functional models are form independent blueprints of a product that can be derived early in the conceptual design phase from high-level customer needs. From this functional information about what the product does, designers can begin to perform analyses and studies about how the product can perform these functions. This tool helps guide design activities such as problem decomposition, concept generation, physical modeling, product architecture, and team organization. The procedure for developing a functional model involves 1) developing a system-level, overall black box function with inputs and outputs that address high level requirements (often expressed as customer needs); 2) relating the high-level requirements to specific input and output flows; 3) deriving chains of sub-functions (a decomposition of the black box function) that transform input flows to desired output flow; 4) aggregating the individual chains together into a complete model; and 5) checking that each requirement is addressed by at least one subfunction (Kurfman, et al., 2003; Otto and Wood, 2001).
The functional basis (Hirtz et al., 2002) is the language for functional modeling. This language specifies the standard verb-object format advocated in value engineering (Miles, 1972) and prescriptive design methods (Pahl and Beitz, 1984) as a complete list of verbs and objects that span the design space of interest. Using a common language for functional models has the following benefits: reduces ambiguity at the modeling level, increases the uniformity of information within functional models, creates early and repeatable physical models of products at a high-level of abstraction, and decomposes design problems into realizable sub-problems.
The Function-Failure Design Method (FFDM), a mathematical relationship between product function and failure modes, is a significant step in generating potential failure modes based on product function (Stone et al., in press). This relationship is dependent on the specific languages used to describe both function and failure (the functional basis (Hirtz, et al., 2002) and failure mode taxonomy (Tumer, et al., 2003), respectively) and the knowledge base that contains the data from which the FFDM draws its information. The FFDM method uses a matrix which matches function
to product component (EC) and one which links product component with failure modes (CF) to
output the number of failures that have occurred for a particular function in the form of the EF
matrix as shown in Equation (1).
EC x CF = EF (1)
3. THE RISK IN EARLY DESIGN METHOD (RED)
The Risk in Early Design (RED) theory (Grantham Lough, et al., 2005; 2006) was developed to extend FFDM into the realm of quantitative risk assessment. The theoretical formulations, shown in Tables 1 and 2, translate the recorded information about function and failure, provided by the FFDM, into categorized risk likelihood and consequence elements for a product. These extensions provide valuable historical information about the likelihood of specific product risks. RED presents this important product information elegantly in a bounded integer format to clearly convey the risk status of the product under investigation.
The FFDM produces the type and number of failures that have occurred for a particular function.
This result is a matrix multiplication of the m×r binary function-component matrix (EC) and the
r×n component-failure matrix (CF). The resulting function-failure matrix (EF) is of size m×n, and
contains the numerical relationship between particular functions and their failure occurrences, as shown by Equation (1).
The component-failure (CF’) severity matrix , a separate matrix than (CF) is used with the
function-component matrix (EC) in RED to calculate risk consequence, the details of the
calculation are presented in Table 3. It is be populated in unison with the component-failure (CF)
matrix. After the component and failure have been identified and the failure frequency entered into
the component-failure matrix (CF), that corresponding entry in the component-failure severity
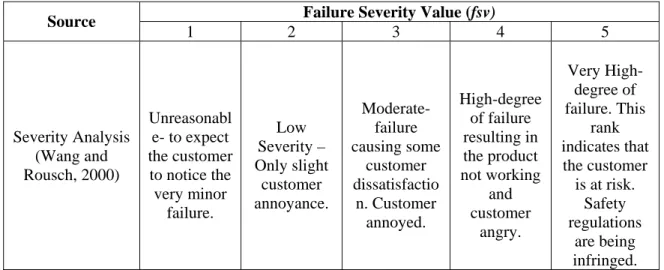
matrix (CF’) receives a number indicating the severity of that particular failure, the failure severity
value (fsv). The severity classifications are presented in Table 1. They indicate the fsv that should be
recorded for the failure.
Failure Severity Value (fsv) Source
1 2 3 4 5
Severity Analysis (Wang and Rousch, 2000)
Unreasonabl e- to expect the customer to notice the very minor failure. Low Severity – Only slight customer annoyance. Moderate-failure causing some customer dissatisfactio n. Customer annoyed. High-degree of failure resulting in the product not working and customer angry. Very High-degree of failure. This rank indicates that the customer is at risk.
Safety regulations
are being infringed. Figure 1. Failure Severity Value Definitions
3.1. RED Likelihood
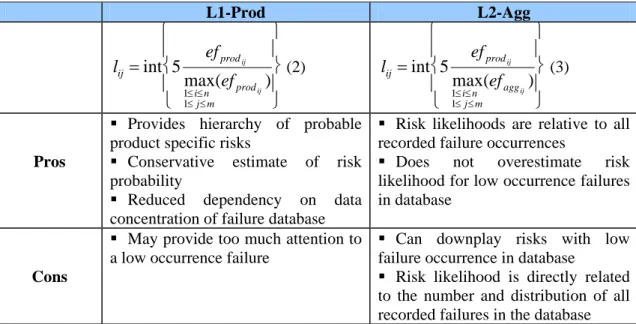
The likelihood mappings, presented in Table 2, identify the specific function-failure combinations and rank the frequency of historical failure mode occurrence by function. Two likelihood mappings are formulated that normalize their result based on either a product view (L1-Prod) or the entire, aggregate database (L2-Agg).
L1-Prod: The L1-Prod likelihood mapping, Equation (2), inserted in Table 2, normalizes the number of failures a function experiences by the maximum number of failures experienced by a function of that product. This mapping provides a risk distribution that will always yield at least one risk element with a likelihood of 5, which is the highest likelihood ranking used on a risk fever chart (DSMC Risk Management Guide, 1999).
L2-Agg: The L2-Agg likelihood mapping, Equation (3), inserted in Table 2, normalizes the number of failures a function experiences by the maximum number of failures experienced by any function in the database, regardless of whether the product has that function. Therefore, if the functions of the product do not have a history of many failures, relative to the database, then they will show as less likely to fail.
The preliminary risk likelihood assessments described in this paper provide a detailed list of potential failures and ranks them from low to high likelihood based on historical occurrences. The communication of the frequencies are manipulated so that they are compatible with a risk fever chart. This chart, originated by the Defense Acquisition University (DAU) (DSMC Risk Management Guide, 1999), is used widely in industry, such as NASA (Van Wie, et al., 2005-1) and
Boeing (Warren, 2005). The fever chart allows the quantification of risk with clear risk communication across all realms from designers, engineers, managers and other decision makers. While it is true that some information is lost in the discretization, there are great communication benefits, such as clearly presented high, moderate, and low-risk elements. A fever chart is used to display risk results in Section 3.3.
The intended use for this type of assessment is to easily identify specific function-failure mode combinations that have historically occurred and to quantify that information into a likelihood based on the outcome of the historical events. This type of approach allows even novice personnel to identify potential problem areas based on historical precedents. Also, it helps to remove personal bias by providing a database on which to perform the likelihood and consequence calculations.
Table 1. RED Likelihood Mappings Summary (Grantham Lough, et al., 2006)
L1-Prod L2-Agg
l
ij=
int 5
ef
prodijmax
1≤i≤n 1≤j≤m
(ef
prod ij)
⎧
⎨
⎪
⎩
⎪
⎫
⎬
⎪
⎭
⎪
(2)l
ij=
int 5
ef
prodij
max
1≤i≤n 1≤j≤m
(ef
agg ij)
⎧
⎨
⎪
⎩
⎪
⎫
⎬
⎪
⎭
⎪
(3)Pros
Provides hierarchy of probable
product specific risks
Conservative estimate of risk
probability
Reduced dependency on data
concentration of failure database
Risk likelihoods are relative to all
recorded failure occurrences
Does not overestimate risk
likelihood for low occurrence failures in database
Cons
May provide too much attention to
a low occurrence failure
Can downplay risks with low
failure occurrence in database
Risk likelihood is directly related
to the number and distribution of all recorded failures in the database
Since RED is intended to be a preliminary risk assessment performed with minimal resources during the conceptual design phase, before the product has assumed a physical form, it is imperative that designers evaluate the RED results as they apply it to their particular product.
3.2. RED Consequence
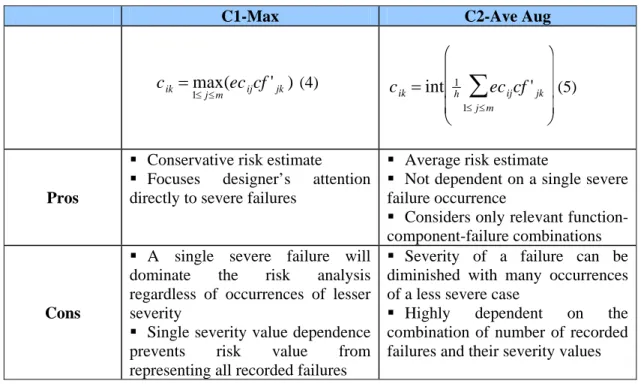
The consequence mappings presented in Table 3 are concerned primarily with product performance and safety. As with the likelihood mappings, two consequence mappings are formulated. One mapping takes a conservative view on consequence (C1-Max) and the second provides an average consequence value (C2-Ave Aug).
C1-Max: The C1-Max consequence mapping, Equation (4), inserted in Table 3, is a conservative mapping by design. This mapping conveys the worst-case scenario of severity for a function-failure combination.
C2-Ave Aug: The C2-Ave Aug consequence mapping, Equation (5), inserted in Table 3, is also aimed at averaging the recorded severities. This mapping takes an average of only the function-failure combinations which have recorded function-failures.
RED’s aim as a preliminary risk assessment tool is to 1) identify risks and 2) communicate those risks. Therefore, the RED method attempts to promote the identification of historical risk related to product function, as well as, the communication of those preliminary risks on a fever chart. RED as a preliminary risk assessment tool presents the potential consequences on a 1 to 5 scale for communicability and highlights possible safety problems based on product functionality. Therefore, the more conservative consequence that might be yielded with this construct is not considered a hindrance. Also, after the preliminary consequence values are generated by RED, experts can apply their knowledge to tailor the assessment to more accurately depict the risk status of the product.
Table 2. RED Consequence Mappings Summary (Grantham Lough, et al., 2006)
C1-Max C2-Ave Aug
cik =max
1≤j≤m(ecijcf'jk) (4) cik =int
1
h ecijcf'jk 1≤j≤m
∑
⎛ ⎝ ⎜ ⎜ ⎜
⎞ ⎠ ⎟ ⎟
⎟ (5)
Pros
Conservative risk estimate
Focuses designer’s attention
directly to severe failures
Average risk estimate
Not dependent on a single severe
failure occurrence
Considers only relevant
function-component-failure combinations
Cons
A single severe failure will
dominate the risk analysis regardless of occurrences of lesser severity
Single severity value dependence
prevents risk value from representing all recorded failures
Severity of a failure can be
diminished with many occurrences of a less severe case
Highly dependent on the
combination of number of recorded failures and their severity values
3.3. Example Application: Thermal Control Subsystem RED Assessments
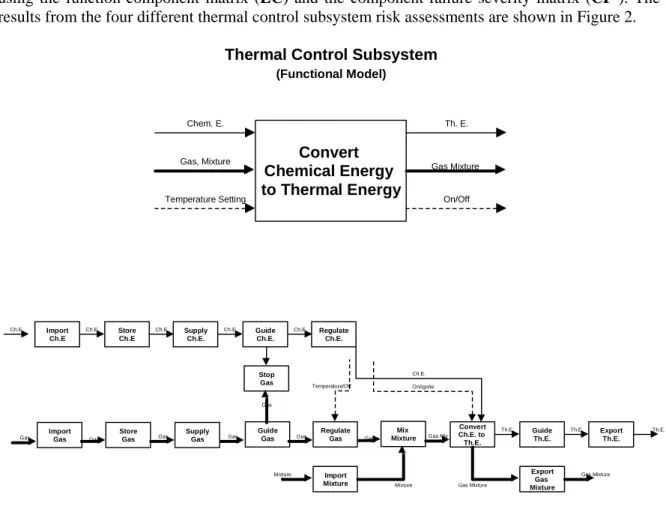
As an example, we present how the RED risk mappings are useful in a design setting such as Team X. RED risk assessments are performed on a functional model of a Thermal Control Subsystem. The Problem/Failure Reporting (P/FR) (Brown, 1994; Quinn, 1994) database at JPL (spell out JPL) contains thousands of anomaly reports for various missions and subsystems. One such subsystem is a Thermal Control Subsystem. This device is used to control the heat generated through chemical processes on the spacecraft. A functional model of a thermal control subsystem is analyzed here to demonstrate the RED approach and its applicability to the design process. Both the likelihood and consequence calculations are performed on the device in this paper to demonstrate the differences between the mappings. In the next section heuristics for selecting the most appropriate risk calculations are discussed.
The functional model of a thermal control subsystem is shown in Figure 1. These functions follow the chemical energy and gas used to generate thermal energy, or heat, for the spacecraft systems. The functions, written in the functional basis, were collected and used to select the entries of the
function-component matrix for the RED likelihood analysis. Once the function-component (EC)
L1-Prod and L2-Agg risk likelihood calculations, shown in Table 2, were performed using the EFprod
matrix. Also, the C1-Max and C2-Ave Aug consequence calculations from Table 3 were performed
using the function-component matrix (EC) and the component-failure severity matrix (CF’). The
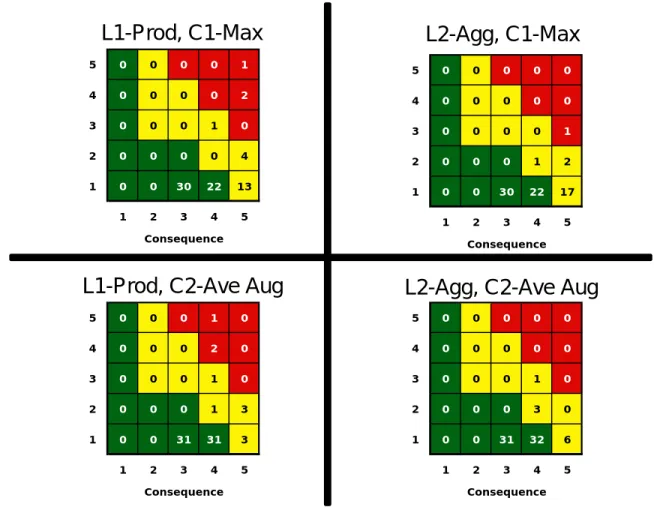
results from the four different thermal control subsystem risk assessments are shown in Figure 2.
Thermal Control Subsystem (Functional Model) Import Gas Ch.E. Gas Store Gas Ch.E. Gas Ch.E. Gas Supply Gas Stop Gas Ch.E.
Gas MixtureMix
Ch.E. Gas Import Mixture Mixture Mixture Convert Ch.E. to Th.E. Gas Mix Export Gas Mixture Gas Mixture Th.E. Gas Mixture Export Th.E. Th.E. Guide Gas Ch.E.
Gas RegulateGas Ch.E. Gas Guide Th.E. Th.E. Convert Chemical Energy to Thermal Energy
Chem. E. Th. E.
Gas, Mixture
Gas Mixture
Temperature Setting On/Off
On/Ignite Temperature/Off Import Ch.E Store Ch.E Supply Ch.E. Guide Ch.E. Regulate Ch.E.
Figure 2. Functional Model of Thermal Control Subsystem.
The risk fever charts from the four RED risk assessments performed on the thermal control subsystem risk assessments are shown in Figure 2. All the risk assessments produced 73 risk elements. The most severe risk element, from the L1-Prod, C1-Max
mapping is Export thermal energy fails due to high cycle fatigue (5,5). This risk element contains the specific function (export thermal energy) at risk for the specific failure mode (high cycle fatigue) with a consequence and likelihood combination of 5, 5. The same function-failure mode portion of the risk element appears in all the risk assessments performed. However, the likelihood and consequence pairs of the risk element can change depending on which RED risk assessment is performed. Table 4 shows a sample of the risk elements the RED risk assessments produced for the thermal control subsystem as well as their consequence and likelihood values for the different assessments. These risk elements suggest that designers should pay special attention to the expert thermal energy function with respect to high cycle fatigue and yielding failures. Also, the guide gas function may experience difficulty with thermal fatigue. These types of risks are consistent with risks of thermal mechanical systems.
5 0 0 0 0 1
4 0 0 0 0 2
3 0 0 0 1 0
2 0 0 0 0 4
1 0 0 30 22 13
1 2 3 4 5
Consequence
L1-Prod, C1-Max
5 0 0 0 0 0
4 0 0 0 0 0
3 0 0 0 0 1
2 0 0 0 1 2
1 0 0 30 22 17
1 2 3 4 5
Consequence
L2-Agg, C1-Max
5 0 0 0 1 0
4 0 0 0 2 0
3 0 0 0 1 0
2 0 0 0 1 3
1 0 0 31 31 3
1 2 3 4 5
Consequence
L1-Prod, C2-Ave Aug
5 0 0 0 0 0
4 0 0 0 0 0
3 0 0 0 1 0
2 0 0 0 3 0
1 0 0 31 32 6
1 2 3 4 5
Consequence
L2-Agg, C2-Ave Aug
Figure 3. Thermal Control Subsystem RED Risk Assessments
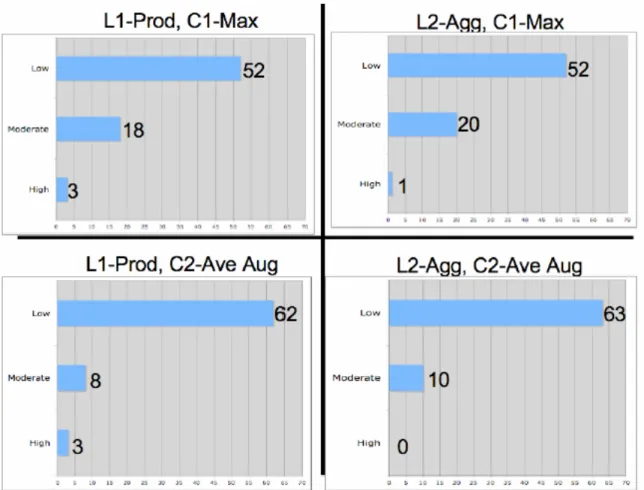
Assessments are equal to or greater than the L2-Agg likelihood values. Another observation from Figure 4 is that the C1-Max risk assessments have at least double the amount of moderate risk elements than their corresponding C2-Ave Aug risk assessments. This interesting note is due to the more conservative nature of C1-Max mapping, which only considers the most severe failure case for evaluating risk consequence.
Table 3. Sample Risk Elements from Thermal Control Subsystem RED Risk Assessments
Risk Element Statement (C1,L1) (C1,L2) (C2,L1) (C2,L2)
Export thermal energy fails due to high cycle
fatigue (5,5) (5,3) (4,5) (4,3)
Export thermal energy fails due to yielding (4,3) (4,2) (4,3) (4,2)
Figure 4. Thermal Control Subsystem RED Risk Level Distribution
4. WHERE RED FITS IN THE SYSTEM DESIGN PROCESS
The RED method is an engineering design tool for identifying and assessing risks in early design. The method, graphically detailed in Figure 4, is a significant extension to the FFDM which links product function to historical failures. Like FFDM, the RED method starts with the functional model of a product. After the functions are identified, a matrix multiplication is performed to calculate the number of failures a particular function has encountered historically from a database. This calculation is then extended to risk likelihood, the particular formula used is based on the previously presented heuristics. Next, the historically catalogued failure severity information is used to calculate risk consequence. After the product’s risk is calculated, the risk information (function, failure mode, consequence, and likelihood) is presented graphically on a risk fever chart. The particular details of the RED method are presented in the following steps.
Step 0: RED Database Population.
As stated previously, RED requires users to possess a database of product history and corresponding failure information. To construct a database for performing RED, gather failure reports from various products. The failures recorded in the database provide part of the context for which the product risk is considered. These can come from National Transportation and Safety Board (NTSB) reports, consumer product failure reports, ASM handbooks, etc. Also, if the risk
assessment is only intended to be in the context of company specific products, then a database of company specific failures may be considered for the calculations. These failure reports should provide enough information so that the specific component and failure can be identified. The
number of the reported failures of components populates the component-failure (CF) matrix in the
FFDM. The failure severity information is recorded in the component-failure severity matrix (CF’).
This matrix records the severity of each reported component-failure combination examined.
The final part of database construction involved recording the functionality of the components that have recorded failures. This is done by constructing functional models of the components. After the
functional models have been constructed, the function-component (EC) matrix is populated with a 1
entry if the component in the corresponding column performs the function in the corresponding for, a 0 is entered otherwise.
After a database has been established, the first step in performing a RED preliminary risk assessment is to develop a functional model for the product that will be assessed for risks. The remaining steps involve calculating the function-failure matrix for the specific functions of the product under investigation.
Step 1: Functional Modeling
Functional modeling, as described in Section 2, is a form independent blueprint of a product that describes what the product will do. Functional models are created by the process that places an emphasis on customer needs. Once a product’s functional model has been created, it can be used to generate a function-failure matrix as part of RED.
Step 2: Product Function-Failure Matrix
To generate the function-failure matrix, the designer must compile the list of the products functions, from the functional model. Then the designer can choose the corresponding function rows from the database’s function-component matrix. Next use Equation (1) to arrive at the Function-Failure Matrix for the product. This result provides the number of specific types of failures each particular
function has experienced in the past according to the historical database.
Step 3: Risk Calculations
The risk likelihood calculation is a direct extension of the FFDM. To apply this extension, first the appropriate mapping should be selected. The reader is referred to the heuristics section presented earlier for guidance on mapping selection. After the appropriate mapping has been selected apply the corresponding equations, refer to Tables 2 and 3, to the functions of the product.
Step 4: Risk Result Communication
The information provided by the risk calculations yields four important pieces of information for each product risk (function, failure mode, consequence, and likelihood). These risk elements must be communicated in such a way that it is easy to understand the current risk state of the product. Therefore, these items should be plotted on a risk fever chart. This is done by entering the number of risk elements that have a particular risk coordinate in that location on the 5x5 risk grid. This grid is overlaid with green, yellow, and red colors with indicate low, moderate, and high-risk respectively. This indicates the overall product risk. Depending on the number of risk elements and the communication space available, they can be shown along side the grid accompanied with their
risk coordinates, or in accompanying documents. This type of communication presents the general product picture as well as directs specific attention to risk areas and identifies them with particular functions and failure modes.
Step 5: Evaluate the Risk Elements for Relevance
Once the risk results are in a communicable form they must be evaluated by experts for relevance to the particular product being designed. This step is necessary because the historical failure information used to populate the database is designed to err on the side of caution, i.e. it might produce more risk elements than are applicable to the present product. The relevance evaluation will possibly reduce the number of overall risk elements on which to focus investigation, making it more feasible to perform in depth risk evaluations during the conceptual design phase; while possibly inspiring different risk elements for consideration. The risk element evaluation processes is aided by the likelihood and consequence values assigned to the risks because they provide a guideline for resource allocation of the evaluations. For example, one would begin the relevance examination with the perceived most critical risks, those with high consequence and likelihood values, and then proceed to those perceived less critical by the RED output. To perform the evaluations successfully, it is important in this step to consider various aspects of the product such as the customer needs, operation environment, performance specifications, cost, etc.
Step 6: In depth PRA analysis of Relevant Risk Elements
After determining the set of risk elements that are relevant to the product it is recommended that further investigations be performed on them to determine their potential specific effects within the product. One method of further investigation is to use the RED relevant results from Step 5, as preliminary hazards and combine their effects with other PRA techniques. Some of the possible PRAs to consider include FMEA, Event Trees, and Fault Trees. Initiating this type of analysis during the conceptual design phase is often difficult due to the lack of information about the physical form of the product. However, with the information from the functional model and the RED output the analysis can be initiated and as the product components are chosen, inserted to determine their affect on the risk.
Step 7: Risk Mitigation
The in depth PRA analysis of Step 6 will provide direct insight on exactly how the risk will affect the product in terms of its operation. In order to reduce the risk, steps must be taken during the product’s design to lessen the likelihood of the risk occurring, lessen the consequence of the risk, or both. Experts need to make those decisions as the product evolves; however, with the information about the risk provided early in the design process, the risk mitigations are less costly because they do not involve redesign, recalls, or retrofits. Mitigation strategies vary greatly for each type of risk and product. Some strategies include adding backup functionality, incorporating sensors to monitor critical systems, or using material specifically designed to prevent particular failures.
5. RED HEURISTICS
The investigation of Section 3.3 combined with previous work (DSMC Risk Management Guide, DoD, 1999) that included two unmanned products (star scanner and robotic arm) as well as one human centric product (rotorcraft) were examined in an effort to assign guidelines for choosing appropriate RED likelihood assessments for particular design problems. While these products are no longer in a conceptual design stage, performing RED risk assessments on them has provided
insight as to the applicability of the risk mapping combinations. This insight leads to four basic heuristics that are presented in the following sections. The heuristics are categorized along two dimensions: design level and product type. The design level dimension is defined as having two extremes of system level and subsystem level. The product type dimension has two extremes of human centric and unmanned. These dimension extremes have the following working definitions:
Definition 1.System level: This is a stage of design which considers the product as a whole. In this portion of design the question, “Is this a risky product?” is under consideration.
Definition 2.Subsystem level: This is a stage of design which is concerned with the subsystems or smaller pieces of the product. In this portion of design the question, “What is the most risky part of the product?” is under consideration.
Definition 3. Human centric: A human centric product is one in which a human is central to its operation.
Definition 4. Unmanned: An unmanned product is one which does not directly interact with a human during its intended operation.
One main assumption for applying the RED likelihood and consequence mappings is that an adequate database of functionally related product historical failures has been established. Without a strong foundation, the risk assessments are not likely to produce relevant and adequate risk data.
5.1 L1-Prod Likelihood Mapping Heuristics
The L1-Prod likelihood mapping normalizes the number of failures a function experiences by the maximum number of failures experienced by a function of that product and will always yield at least one risk element with a likelihood of 5. Considering the results of the previous investigations, this mapping consistently provided a distribution across the likelihood spectrum for all the products. Combining these characteristics, the L1-Prod likelihood mapping may be best used as a risk assessment in the subsystem design level. This mapping will quickly identify the product specific problem areas for a product.
5.2 L2-Agg Likelihood Mapping Heuristics
The L2-Agg likelihood mapping normalizes the number of failures a function experiences by the maximum number of failures across the database, regardless of whether the product has that function. Therefore, using this information, it is proposed that the L2-Agg mapping be used at the system design level. This mapping will address the questions of whether or not to proceed further with the design of the product based on the amount of risk the designers are willing to assume.
5.3 C1-Max Consequence Mapping Heuristics
The C1-Max consequence mapping is a conservative mapping conveying the worst-case scenario of severity for a function-failure combination. The investigations of Section 4 produced the most severe risk assessments when using this mapping. Since a severity, and consequence, of 5 relates mostly to personal injury this worst case scenario would only pertain to human centric products. Therefore, the risk assessments that involve human related products are taken more serious in an effort to promote safety.
5.4 C2-Ave Aug Consequence Mapping Heuristics
The C2-Ave Aug consequence mapping, Equation (5) in Table 3, averages the function-failure combinations which have recorded failures. This average of relevant failures, according to the investigations of Section 4, provided a risk distribution with less severe risks. The risk elements were often distributed among the low and moderate categories with this consequence mapping. Therefore, this mapping might be better suited for the unmanned products. Since the unmanned products are not concerned with personal injury during their normal operation, the effect of those severities is lessened by averaging them with other severity ratings.
5.5 Heuristics Summary
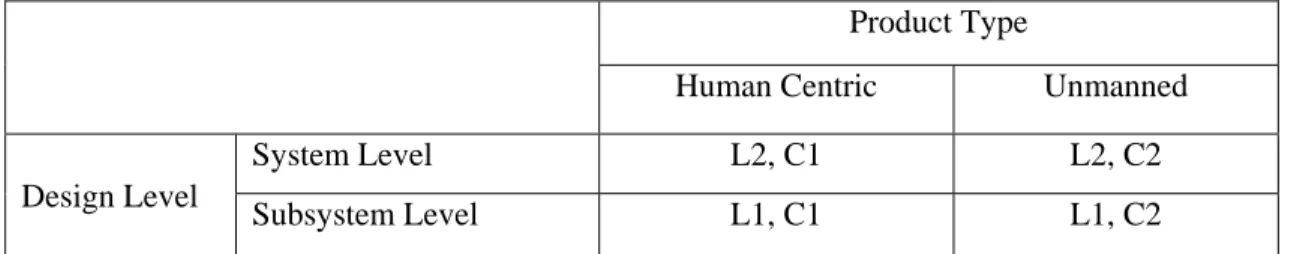
Table 5 presents a summary of the heuristics presented in the previous sections. The risk mapping combinations for the four categories are shown in the table for a quick look up. It is suggested that when using a particular mapping that the reader refer to Tables 2 and 3 for summaries of each mapping’s characteristics. The appropriate combination of the likelihood and consequence mappings teamed with a well-developed database will greatly assist designers in risk identification and assessment.
Table 3. RED Heuristics
Product Type
Human Centric Unmanned
System Level L2, C1 L2, C2
Design Level
Subsystem Level L1, C1 L1, C2
6. RED IN THE DESIGN PROCESS OF A THERMAL CONTROL SUBSYSTEM
To demonstrate the steps for using RED in the design process, the thermal control subsystem, introduced in Section 3.3, is used again. Recall that Section 3.3 presented the functional model of a thermal control subsystem, and the RED results from all four potential risk mappings to provide insight into heuristics for the mappings. Now, when considering incorporating the RED method into the design of a thermal control subsystem, start with the steps outlined in Section 5.1.
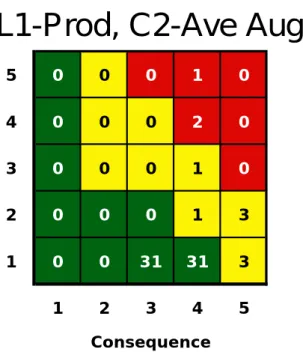
According the seven steps described in section 5.1, there needs to be a functional model of a product, see Figure 1. Next, in Step 2, the functions from the functional model are selected and input into the RED database. These functions include the following: import chemical energy, store chemical energy, supply chemical energy, regulate chemical energy, import gas, store gas, supply gas, guide gas, stop gas, regulate gas, import mixture, mix mixture, convert chemical energy to thermal energy, guide thermal energy, expert thermal energy, and export gas mixture. Step 3 in the method requires using the heuristics from Section 4 to perform the appropriate RED calculation for the product. The thermal control subsystem in question fits under the subsystem design category, which indicates using the L1-Prod likelihood mapping. Also, this particular subsystem is to be included on an unmanned spacecraft; therefore, the C2-Ave Aug consequence mapping is appropriate. This analysis results in 73 risk elements (3 high risk, 8 moderate risk, and 62 low risk). The numerical results are communicated on a fever chart, recommended by Step 4, as shown in Figure 5.
5 0 0 0 1 0
4 0 0 0 2 0
3 0 0 0 1 0
2 0 0 0 1 3
1 0 0 31 31 3
1 2 3 4 5
Consequence
L1-Prod, C2-Ave Aug
Figure 5. L1-Prod, C2-Ave Aug Thermal Control Subsystem Risk Assessment
Also, the results include the 73 risk element statements that detail the function, failure mode, likelihood and consequence of the risk. Those results for both the high and moderate risks are shown in Figure 6.
The next step in the process involves evaluating the risk elements for the relevance to the product. Examining only the high and moderate risk elements for example implies that one needs to determine if the high cycle fatigue, thermal fatigue, thermal shock, impact fracture, and yielding risks are relevant. Since the thermal control subsystem will be operated on an unmanned spacecraft the high cycle fatigue risk is a concern during the launch of the craft. Thermal fatigue and thermal shock are relevant during the operation of the craft and the extreme temperature variations of the space environment. Impact fracture is also a relevant risk due to space debris and debris from launch. Finally, yielding can also be a relevant potential risk at this stage until more about the materials of the thermal control subsystem are known. Therefore, all of the high and moderate risks evaluated from the RED output are considered relevant to the product.
Step 6 suggests that after the relevant risks are identified, an in depth PRA should be initiated to identify the specifics of how the risk will affect the product. For this step in the thermal control subsystem, it can be seen that the high risks occur along the gas flow and thermal energy flow of the functional model. Therefore, it is suggested that event trees be generated along these flows of the functional models to determine the possible events associated with these failures during the thermal control subsystem operation. Here the reader is referred to (Henley and Kumamoto, 1992) for information on how to perform various PRAs.
Risk mitigation is the last step of incorporating RED into the design process. With this in mind, an example of mitigation for the thermal control subsystem is to add insulation to the material involved with the high risk gas flow to protect against thermal fatigue, thermal shock and impact fracture. As the product matures, other mitigation ideas may be added to the system.
Figure 6. High and Moderate Thermal Control Subsystem Risk Elements
7. CONCLUSION
The risk in early design (RED) method provides designers with an automatic risk identification/assessment tool that can be used as early as the conceptual design phase. RED produces specific detailed preliminary risk assessments based on catalogued historical failure data. This paper presents heuristics for applying RED risk assessments to different types of products and provides the steps for including it in the design process. Depending on the type of product and stage of product design, RED can be used to aid decision makers with whether or not they should continue design efforts on a product or even aid in resource allocation for further risk analysis in subsystem design efforts. And, as described in the previous section, all this information can be achieved before the product has assumed a physical form, where the potential for positive impacts on product cost and reliability are the greatest. Future work will include exploring implementation of the RED method in a design setting such as the Team X environment. This implementation will demonstrate how well the heuristics and incorporation into the design process perform in a design environment.
Acknowledgements
This material is based upon work supported by the NASA Ames Research Center under grant NCC 2-1380. Any opinions, findings, and conclusions or recommendations presented in this paper are those of the authors and do not necessarily reflect the views of the sponsor or collaborators.
REFERENCES
[1] Bohnenblust H., Schneider T. (1987), Risk appraisal: Can it be improved by formal decision models?; Uncertainty in Risk Assessment, Risk Management, and Decision Making; edited by V. T. Covello et al., pp. 71-87; New York Plenum Press.
[2] Brown A.F.( 1994), Development of a Method for Flight Anomaly Characterization; JPL Technical Report, JPLD-11382, Jet Propulsion Laboratory, California Institute of Technology, Pasadena, CA.
High Risk
Moderate Risk
Import gas fails due to thermal fatigue, (5,2)
Store gas fails due to high cycle fatigue, (5,1)
Supply gas fails due to high cycle fatigue, (5,1)
Guide gas fails due to thermal fatigue, (5,2)
Export thermal energy fails due to impact fracture, (5,1)
Export thermal energy fails due to thermal fatigue, (5,2)
Export thermal energy fails due to thermal shock, (4,2)
Export thermal energy fails due to yielding, (4,3)
Import gas fails due to high cycle fatigue, (4,4)
Guide gas fails due to high cycle fatigue, (4,4)
[3] Department of Defense, Procedures for performing failure mode, effects and criticality analysis; MIL-STD-1629A.
[4] Frank M.V. (1999), Reentry safety: probability of fuel release in Safety and Reliability; Proceedings of ESREL ’99, eds G.I. Schueller and P. Kafka, Balkema, Rotterdam.
[5] Grantham Lough K., Stone R., Tumer I. (2005), Function Based Risk Assessment: Mapping Function to Likelihood; Proceedings of ASME International Design Engineering Technical Conference; September 24-28, Long Beach, CA.
[6] Grantham Lough K.A. (2005), Risk in Early Design; A Dissertation; University of Missouri-Rolla, August.
[7] Grantham Lough K., Stone R., Tumer I. (2006), The Risk in Early Design (RED) Method: Likelihood and Consequence Calculations; Proceedings of ASME International Design Engineering Technical Conference; Submitted.
[8] Henley E., Kumamoto H. (1992), Probabilistic Risk Assessment; IEEE Press; New York.
[9] Hirtz J., Stone R., McAdams D., Szykman S., Wood K. (2002), A Functional Basis for Engineering Design: Reconciling and Evolving Previous Efforts; Research in Engineering Design 13(2); 65-82. [10] Holloway N.J. (1987), A method for pilot risk studies; In Implications of Probabilistic Risk
Assessment; edited by Cullingford M.C., Shah S.M., and Gittus J.H., 125-140., New Yourk; Elsevier Applied Science.
[11] Kurfman M., Rajan J., Stone R., Wood K., Stock M. (2003), Experimental Studies Assessing the Repeatability of a Functional Modeling Derivation Method; Journal of Mechanical Design 125(4); 682-693.
[12] Lawley H.G. (1974), Operability studies and hazard analysis; Chemical Engineering Progress 70(4); 45-56.
[13] Mark G. (2002), Extreme Collaboration; Communications of the ACM 45(6); 89-93.
[14] Meshkat Cornford S., Moran T. (2003), Risk Based Decision Tool for Space Exploration Missions; American Institute of Aeronautics and Astronautics space Conference and Exhibition, AIAA; 2003-6377.
[15] Miles L. (1972), Techniques of Value Analysis Engineering; McGraw-Hill.
[16] Office of the Under Secretary of Defense (1999), DSMC Risk Management Guide for DoD Acquisition; 2nd Edition, Defense Systems Management College Press, Fort Belvoir, Virginia.
[17] Otto K., Wood K. (2001), Product Design: Techniques in Reverse Engineering; Systematic Design, and New Product Development, New York, Prentice-Hall.
[18] Pahl G., Beitz W. (1984), Engineering Design: A Systematic Approach; Design Council, London. [19] Quinn J.D. (1994), Flight P/FRs and the Design Review Process; JPL Technical Report, JPL D-11381,
Jet Propulsion Laboratory, California Institute of Technology, Pasedena, California.
[20] Stone R., Tumer I., Van Wie M., The Function Failure Design Method; Journal of Mechanical Design; in press.
[21] Tumer I., Stone R., Bell D. (2003), Requirements for a Failure Mode Taxonomy for use in Conceptual Design; Proceedings of the International Conference on Engineering Design, ICED; Stockholm, paper 1612.
[22] Tumer I., Stone R. (2001), Mapping Function to Failure Mode During Component Development; Research in Engineering Design 14(1); 25-33.
[23] Uder S., Stone R., Tumer I. (2004), Function Based Risk Assessment and Failure Prediction for Unmanned Space Missions; ASME International Mechanical Engineering Congress IMECE; 60846. [24] Van Wie M., Bohm M., Barrientos F., Tumer I., Stone R. (2005-1), Learning from Failures: Archiving
and Designing with Failure and Risk; Proceedings of the 6th InternationalConference on Computer-Aided Industrial Design and Conceptual Design; Delft, The Netherlands.
[25] Van Wie M., Grantham Lough K., Stone R., Barrientos F., Tumer I. (2005-2), An Analysis of Risk and Function Information in Early Stage Design; Proceedings of ASME International Design Engineering Technical Conference; September 24-28, Long Beach, CA.
[26] Vesely W.E., Goldberg F.F., Roberts N.H., Haasi D.F. (1981), The Fault Tree Handbook; US Nuclear Regulatory Commission, NUREG 0492.