PHARMACOKINETICS AND BIODISTRIBUTION OF LCP NANOPARTICLES
Yang Liu
A dissertation submitted to the faculty of the University of North Carolina at Chapel Hill in partial fulfillment of the requirements for the degree of Doctor of Philosophy in the Eshelman School of Pharmacy.
Chapel Hill 2012
Approved by:
© 2012 Yang Liu
ABSTRACT
YANG LIU: Pharmacokinetics and Biodistribution of LCP Nanoparticles (Under the direction of Leaf Huang, Ph.D.)
ACKNOWLEDGEMENTS
I would like thank my academic advisor, Dr. Leaf Huang, for his guidance and support on my research. I also thank my committee members, Drs. Blancafort, Cho, Juliano and Liu, for their suggestions on my dissertation project. The kind assistance from the Huang lab during my graduate research and study is acknowledged. I also appreciate the support from my friends and family.
Contents
LIST OF TABLES ... X LIST OF FIGURES ... XI LIST OF ABBREVIATIONS AND SYMBOLS ... XIII
1 INTRODUCTION...1
1.1 BARRIERS FOR DRUG DELIVERY BY NANOPARTICLES ...1
1.2 FACTORS AFFECTING PK AND BIODISTRIBUTION OF the NP...4
1.2.1 Effect of size ...5
1.2.2 Effect of surface characteristics ...7
1.2.2.1 Effect of surface chemistry ...7
1.2.2.2 Effect of active targeting ...8
1.2.3 Other factors...9
1.3 PEGYLATION: GRAFTING DENSITY AND CONFORMATION ...10
1.3.1 Steric stabilization by PEGylation ...11
1.3.2 Conformation of surface-grafted PEG ...12
1.3.3 Linkage of PEG to NPs ...15
1.3.4 Coverage density and conformational studies ...15
1.4 PROTEIN ADSORPTION ONTO NANOPARTICLES ...17
1.4.1 Formation of the protein corona ...17
1.4.2 Analytical method for corona evaluation ...18
1.4.3 Outcome of protein-NP interactions ...19
1.5 PERSPECTIVES OF OPTIMIZING IN VIVO PERFORMANCE OF NP ...20
2 METHODOLOGY FOR PK / BIODISTRIBUTION STUDIES ...22
2.2 MATERIALS AND METHODS ...25
2.2.1 Materials ...25
2.2.2 Experimental animals...26
2.2.3 3H labeling of oligonucleotides ...26
2.2.4 Preparation of LCP NPs ...27
2.2.5 Tissue distribution study by Texas Red labeling ...28
2.2.6 Tissue distribution study by radioisotope labeling ...28
2.2.7 Fluorescence intensity measurement in different tissues ...28
2.2.8 Statistical analysis ...29
2.3 RESULTS ...30
2.4 DISCUSSION ...34
3 CHARACTERIZATION OF LCP NP FORMULATION ...38
3.1 INTRODUCTION...39
3.2 MATERIALS AND METHODS ...41
3.2.1 Materials ...41
3.2.2 Experimental animals...42
3.2.3 NP preparations ...42
3.2.4 Sucrose gradient centrifugation ...43
3.2.5 Transmission electron microscopy ...43
3.2.6 Dynamic light scattering and Zeta potential ...44
3.2.7 Fluorescence-labeled lipids analysis ...44
3.2.8 X-ray photoelectron spectroscopy study ...44
3.2.9 Small angle neutron scattering study ...45
3.2.10 Statistical analysis ...46
3.3.1 Size, morphology and surface charge of LCP NPs ...46
3.3.2 Surface coverage of PEG ...47
3.3.3 Conformation of surface-grafted PEG ...50
3.4 DISCUSSION ...54
4 PHARMACOKINETICS AND BIODISTRIBUTION OF LCP NP ...56
4.1 INTRODUCTION...57
4.2 MATERIALS AND METHODS ...58
4.2.1 Materials ...58
4.2.2 Experimental animals...58
4.2.3 NPs preparation ...59
4.2.4 PK study ...59
4.2.5 Tissue distribution study ...59
4.2.6 Cell-type specific localization by confocal microscopy ...60
4.2.7 Statistical analysis ...60
4.3 RESULTS ...61
4.3.1 Blood Clearance ...61
4.3.2 Kinetics of tissue distribution ...62
4.3.3 Cell-type specific localization in liver and spleen ...63
4.4 DISCUSSION ...66
5 PROTEIN ADSORPTION AND ITS IMPACT ON IN VIVO BEHAVIOR ...69
5.1 INTRODUCTION...70
5.2 MATERIALS AND METHODS ...71
5.2.1 Materials ...71
5.2.3 NPs preparation ...72
5.2.4 PK study ...72
5.2.5 Tissue distribution ...73
5.2.6 Cell-type specific localization in liver ...73
5.2.7 Determination of the protein corona composition ...73
5.2.8 In vivo apoE dependency ...74
5.2.9 Statistical analysis ...74
5.3 RESULTS ...75
5.3.1 Blood Clearance ...75
5.3.2 Tissue distribution ...76
5.3.3 Cell-type specific distribution ...77
5.3.4 Composition of protein corona ...78
5.3.5 in vivo apoE dependency ...81
5.4 DISCUSSION ...82
6 DISCUSSION ...85
6.1 Summary of research results and future plans ...86
6.2 Further directions ...88
6.3 Ending remarks ...90
APPENDIX A ...91
APPENDIX B ...94
LIST OF TABLES
Table 3.1 A summary of characteristics of LCP NPs. ... 47 Table 3.2 The thickness of the lipid and PEG layers based on a polydispersed
core-with-3-shell spherical model. ...53 Table 5.1 Representative proteins associated with LCP-DOTAP NPs with 5%
LIST OF FIGURES
Figure 1.1 Kinetic and physical barriers to the systemic delivered nanoparticle
formulation. ... 4
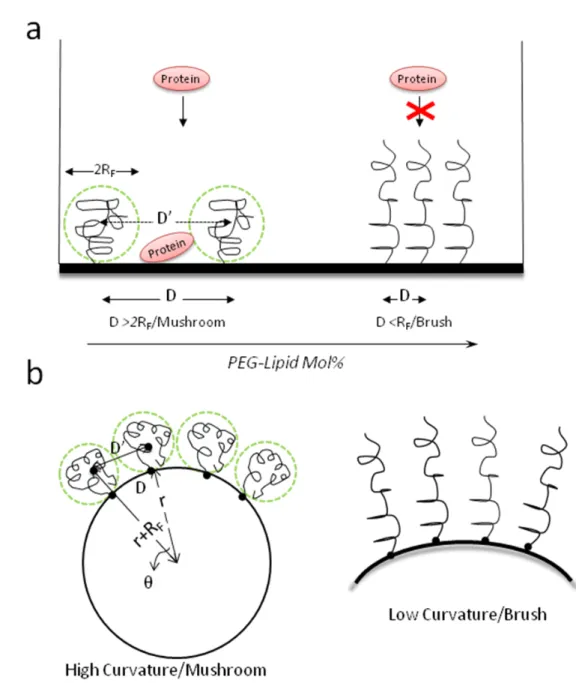
Figure 1.2 Putative PEG conformation regimes with respect to the polymer concentration in (a) the bilayer and (b) the curvature of the bilayer. ...14
Figure 2.1 Formation of LCP NPs formulation in microemulsion. ... 30
Figure 2.2 Biodistribution of LCP NPs in tumor-bearing mice. ... 32
Figure 2.3 Measured fluorescence intensity of Texas Red oligonucleotides. ... 33
Figure 2.4 Measured fluorescence intensity of Cy5.5 in tissue homogenate... 34
Figure 2.5 Standard curve generated by quantifying the intensities of known concentrations of oligonucleotides. ...34
Figure 3.1 Proposed lipid bilayer-core structure of LCP NPs. ... 40
Figure 3.2 Schematic illustration of sucrose gradient centrifugation for purification. .... 41
Figure 3.3 TEM image of CaP cores. ... 47
Figure 3.2 Quantitative analysis of DSPE-PEG-CF on purified LCP NPs... 49
Figure 3.3 High resolution carbon 1s scans of LCP NPs with different amount of PEGylation. ...50
Figure 3.6 SANS data of the LCP NPs at 10 oC (circles) and 40 oC (triangles). ... 53
Figure 4.1. Pharmacokinetics of LCP NPs in normal and tumor-bearing mice. ... 62
Figure 4.2 Tissue distribution of LCP NPs as a function of time after administration... 63
Figure 4.4 Proposed two-compartment PK model in the tumor-bearing mice. ... 67 Figure 5.1 Pharmacokinetics of LCP NPs with different lipid in normal and
tumor-bearing mice. ...76 Figure 5.2 Tissue distribution of LCP NPs with different lipid. ... 77 Figure 5.3 Cell-type specific localization of LCP NPs with different lipid in liver. ... 78 Figure 5.4 SDS-PAGE gel of serum proteins obtained from LCP NP-protein
complexes following incubation at different serum concentrations. ...80 Figure 5.5 Tissue distribution of LCP NPs in wild-type and apoE−/− mice (N=4). ... 82 Figure 5.6 Hypothesized mechanism of hepatocytes uptake of LCP-DOTAP and
LCP-DOPC NPs...85 Figure A1. Schematic illustration of general-purpose SANS diffractometer. ... 92 Figure A2. Schematic representation of the momentum initial state and final state
LIST OF ABBREVIATIONS AND SYMBOLS
1D- or 2D- one or two-dimensional
λ wavelength
a monomer size
Å Angstrom
apoE apolipoprotein E BBB blood brain barrier
D distance of two grafting sites DOPA Dioleoylphosphatydic acid DOPC Dioleoylphosphatidylcholine
DOPE Dioleoyl-phosphatidylethanolamine
DOTAP 1,2-dioleoyl-3-trimethylammonium-propane
DSPE-PEG2000 1,2-distearoyl-sn-glycero-3-phosphoethanolamine-N-[poly(ethylene glycol)2000]
DSPE-PEG-CF 1,2-distearoyl-sn-glycero-3-phosphoethanolamine-N-[poly(ethylene glycol)2000-N'-carboxyfluorescein
EDTA ethylenediaminetetraacetic acid ESI electrospray ionization
EPR enhanced permeability and retention HSA human serum albumin
ICP-MS inductively coupled plasma mass spectrometry LDL low-density lipoprotein
LDLR low-density lipoprotein receptor
IgG Immunoglobulin G
ID injected dose
LPD liposome-polycation-DNA
MALDI matrix-assisted laser desorption/ionization MMP matrix metalloproteinases
MS mass spectrometry
MW molecular weight
N degree of polymerization
NIR near-infrared
NMR nuclear magnetic resonance
NPs nanoparticles
PAGE polyacrylamide gel electrophoresis PEG polyethylene glycol
PK pharmacokinetics
RES reticuloendothelial system
RF radius of the random coil the polymer forms in solution Flory radius
SANS small angle neutron scattering
SD standard deviation
SLD scattering length density
TEM transmission electron microscope TGA thermal gravity analysis
TOF time-of-flight
Xm-b concentration of grafted PEG-lipid for which the PEG chains first begin to overlap
CHAPTER 1
INTRODUCTION
Intravenously injected nanoparticles (NPs) as drug carriers provide a wide range of unique opportunities for site-specific delivery of therapeutic agents to many targets, for example tumors or the liver [1, 2]. The future of this expanding field is promising; over 20 NP therapeutics have been approved by the FDA for clinical use and many are in late-phase clinical trials [1, 3]. Safe and efficient delivery of cargos is a precondition for a successful nanoparticle-based therapy. Over the past decades, a wide range of nanoparticulate systems, such as liposomes and polymeric nanoparticles, have been used as carriers for the intravenous delivery and site-specific targeting of small molecules and macromolecular (e.g., proteins, nucleic acid) therapeutic agents. Various attempts to increase the therapeutic index of drugs while simultaneously minimizing side effects have been made in the field of drug delivery systems.
1.1 BARRIERS FOR DRUG DELIVERY BY NANOPARTICLES
2
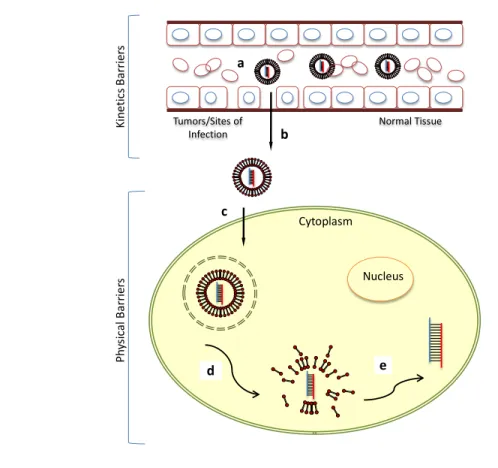
face a series of physical barriers. Macromolecules such as siRNA cannot cross the cell membrane easily owing to its relatively large size and high negative charge content. NPs, especially with ligand, can bind and trigger endocytosis to cross the cell membrane and enter into their action site— cytoplasm (Figure. 1.1c). More importantly, NPs must escape the endosome (Figure. 1.1d); if they do not, they will traffic through the endomembrane compartments of decreasing pH and finally be subjected to degradative conditions in the lysosomes [11]. Finally, encapsulated drugs must dissociate from the delivery carrier and be released to be bioavailable (Figure. 1.1e).
Tumors/Sites of
Infection Normal Tissue
Kin et ic sB arri er s Ph ys ic al B ar rie rs Nucleus Cytoplasm b c d e a
Figure 1.1 Kinetic and physical barriers to the systemic delivered nanoparticle
formulation.
(a) NPs should avoid filtration, degradation and RES uptake in circulation; (b) across the vascular endothelial barrier; (c) be internalized into the cells; (d) escape the endosome; (e) disassemble and release the cargo.
1.2 FACTORS AFFECTING PK AND BIODISTRIBUTION OF THE NP
interrelated physicochemical and biological factors. Biological determinants include the biochemical, anatomical, and immunological barriers, as well as the opportunities offered by disease sites for nanoparticlate therapeutics, as described in sections 1.1 and 1.2.1. The influential physicochemical factors include, but are not limited to the size distribution of NPs, the particles’ surface characteristics, particle rigidity, and molecular architecture. These factors are all tunable parameters and could interact with biological barriers in vivo. Indeed, a detailed knowledge of particle characteristics would be vital for design optimization.
1.2.1 Effect of size
reduced plasma protein adsorption on their surface and a reduced amount of RES uptake [13].
1.2.2 Effect of surface characteristics
Opsonization is the major factor that induces RES uptake of NPs. However, the surface characteristics of the NPs can counteract the hydrophobic and electrostatic interactions between the NPs and the plasma proteins or macrophages, resulting in less RES uptake and a prolonged blood circulation time. Therefore, surface characteristics of NPs greatly influence their PK and biodistribution. NPs that have a mean diameter of approximately 100 nm with a neutral and hydrophilic polymer-modified surface generally exhibit a prolonged blood circulation and an increased level of tumor delivery.
1.2.2.1Effect of surface chemistry
It has been reported that surface charge is a very important factor in determining the in vivo fate of NPs, as well as the mechanism of cellular uptake and resulting efficiency [20,
employed through the introduction of surface coatings in order to reduce opsonization. PEGylation technology has been developed to improve the stability, blood circulation time and pharmacokinetics of biopharmaceutical agents. A coating of PEG on the surface of NPs has been shown to prevent particle aggregation and reduce the opsonization with serum proteins, leading to decreased RES uptake and prolonged circulation time [24-26].
Although NPs carrying a negative charge may have significantly less non-specific uptake in the liver and spleen compared with their positive or neutral counterparts, the electrostatic repulsion between negatively charged NPs and cellular surfaces could prevent cellular uptake [27, 28]. Many macromolecules cannot easily cross the cell membrane owing to their relatively large size and high, negative charge content. Extracellular release is not a good design for the delivery of membrane impermeable drugs such as siRNA and proteins. This problem might be solved through the creation of NPs with targeting ligands, which can bind and trigger endocytosis to cross the cell membrane and enter into their action site.
1.2.2.2Effect of active targeting
[30]), nucleic acids (i.e. aptamers [31]), and small molecules (e.g. folic acid [32] and RGD peptide [33]); the attachment of a targeting moiety on the surface of nanoparticles improves their therapeutic outcomes in vivo [34]. However, recent work in understanding the parameters that influence targeted nanoparticle behavior has revealed that the presence of the targeting ligand does not significantly affect their PK or biodistribution profiles [35-37]. It is suggested that the enhanced therapeutic efficacy was attributed to the increased cellular uptake of the targeted nanoparticles [36]. Active targeting leads to selective nanoparticle internalization into cancer cells that have abundant receptor expression. Furthermore, these studies also indicate that there is a minimum density requirement of targeting ligand content on the nanoparticle that provides adequate avidity for effective active targeting.
1.2.3 Other factors
Other than the topics discussed above, there are several other critical issues that need to be considered in achieving desired PK and biodistribution patterns. For example, stability is a key issue in the creation of successful pharmaceutical products. The in vivo stability is an important prerequisite parameter needed to allow prolonged blood circulation and the preferred tissue distribution.
particles may also contribute to their long circulation times. Additionally, studies utilizing cultured macrophages revealed that the worm-shaped nanoparticles experience a strong drag force exerted by the fluid flow, enabling them to be carried away by the flow before the macrophages can engulf them. This phenomenon is probably the underlying mechanism of the nanoworms’ extremely prolonged circulation time. Mathematical models have been developed to study the adhesion properties for NPs of various shapes; Decuzzi and Ferrari (year) concluded that NPs used for drug delivery should have a radius smaller than 100 nm in order to facilitate their interaction with the endothelium wall [40].
1.3 PEGYLATION: GRAFTING DENSITY AND CONFORMATION
indicate that PEG chains must have a minimum molecular weight of 2000 to achieve RES-avoidance, making PEG2000 the most frequently used PEG polymer [13, 25, 26]. Essentially, the grafting density of PEG chains determines the efficiency of PEGylation and thereby the protein repelling capability of the resultant NPs.
1.3.1 Steric stabilization by PEGylation
The mechanism by which PEGylation increases circulation times and improves biodistribution profiles is not fully understood. However, the most widely accepted explanation is that PEG provides a steric barrier, which prevents nanoparticle opsonization, which delays removal by the RES. PEGylation involves physical, chemical, and biological stabilization of the liposomes and retention of their payload. The conformational flexibility and high chain mobility of PEG lead to extensive hydration in aqueous environments, causing a steric hindrance to protein adsorption. Thus, such polymers shield the hydrophobic surface of the particles and thereby reduce opsonization by blood proteins and uptake by macrophages of the RES.
1.3.2 Conformation of surface-grafted PEG
Experimental data closely follows the theoretical model that protein repellence by PEG coatings depends on both length and density of the chain which jointly determine the thickness of the PEG corona. The conformation of surface grafted PEG chains is dictated by the relation between the distance of two grafting sites (D) and the radius of the random coil the polymer forms in solution (RF), the latter being defined by the Flory dimension (RF = aN3/5), where N is the degree of polymerization and a is the monomer size [46]. The polymer forms a mushroom conformation at D > 2RF, while a brush-like conformation appears at D < RF, when the polymer chains stretch out perpendicularly from the surface due to steric hindrance among each other (Figure 1.2a). These two conformations do not represent sharply separated regimes, but undergo smooth transitions through mushroom/brush intermediates as D and RF values became closer [47]. The transition between the mushroom and brush regimes occurs at the concentration of grafted PEG-lipids (Xm-b) where the PEG chain first begins to overlap as random coils (i.e. mushroom). This concentration is determined by the size of the polymer (RF).
shown in Figure 1.2a. Li & Huang employed PEGylated liposome-polycation-DNA (LPD) NPs to address this issue (citation). In that formulation, the nucleic acid was complexed by protamine to form a compact core, which was coated by two cationic lipid-bilayers. The inner bilayer is directly in contact with the core and is supported and stabilized by the charge-charge interaction of the cationic lipids with the negatively charge-charged core. This unique feature of LPD may enable the supported bilayer to tolerate a high amount of DSPE-PEG2000 (10 mol %), forming a relatively dense PEG brush on the surface [51]. As a result, the zeta potential of an unprotected LPD is +40 mV, while a fully protected LPD contained 10 mol% surface-grafted PEG has a zeta potential of approximately 0 mV. LPD containing 10 mol% PEG was not taken up by the liver Kupffer cells, thus completely evading the RES [52, 53]. Of course, the accumulation in the tumor still depends on how leaky the tumor vasculature is, i.e., the EPR effect.
significance. As the particle size decreases, its influence will need to be taken into consideration. Xm-b will be determined by the size of PEG-lipids (RF) as well as the radius (r) of the nanoparticle on which they are grafted.
1.3.3 Linkage of PEG to NPs
Both covalent and noncovalent approaches are used to anneal PEG molecules to the NP surface. In the creation of solid NPs, such as gold NPs, a thiol group is the classic approach. Here, a sulfhydryl-capped PEG chain adheres to the gold surface [54]. Silica NP surfaces are generally capped with an organosilane such as amino- or mercapto-trimethoxysilane for routine bioconjugation [55].
A commonly used approach in noncovalent PEGylation involves coating the hydrophobic NP surface with lipid–PEG conjugates through hydrophobic interactions. For example, to prepare PEGylated liposomes, it is feasible to simply include PEGylated lipids into the lipid mixture, or incubate naked liposomes with aqueous micellar solution of lipid– PEG conjugates [56]. PEGylated phospholipids are able to bind to the hydrophobic surface of NPs, for example single-walled carbon nanotubes [57], hydrophobic polymeric NPs [58], or quantum dots [59], in such a way that hydrophilic PEG groups are facing the aqueous exterior and provide the nanotubes with a hydrophilic PEG corona. The hydrophobic interactions between lipids and NPs anchor the PEG chain.
1.3.4 Coverage density and conformational studies
loading of added PEG molecules to determine the density. Thus, the exact influence of PEG-density dependence on NP biodistribution remains unknown.
Dynamic light scattering reveals three important characteristics of the final PEGylated NPs: size, zeta potential and size distribution. Size measurement by dynamic light scattering suffers from poor reproducibility, yet it is convenient and can be used to monitor the sequential size increases which occur before and after PEGylation [61]. The size distribution can be used to measure the homogeneity of the NPs. Although size increases offer some evidence of PEGylation, it cannot discriminate between brush and mushroom configurations. Zeta potential also offers information regarding the surface coating; reduced surface charge may indicated the presence of PEGylation. Unfortunately, these measurements are suboptimal and inconclusive in determining PEG density and conformation.
fluorescence-labeled PEG to model the binding densities possible at different density levels. This approach may not be appropriate for gold NPs because of quenching.
NPs that have a PEG corona adopt a core-shell structure, concentric domains of two chemically different materials, a structure that is ubiquitous in the colloid science field. Structural information on core-shell systems can be assessed effectively using scattering techniques. In particular, they can be studied in great detail using contrast-variation methods [64], achieved most readily in the context of small-angle neutron scattering (SANS). Several studies have also used light or X-ray scattering. In this work, we use SANS to investigate the aqueous dispersions of PEG-grafted, LCP NPs under two different temperatures. We focus on how the signals change in relation to increasing temperature. The conformation of grafted-PEG could be estimated by model fitting the signals. Detailed information of SANS studies is provided in APPENDIX A.
1.4 PROTEIN ADSORPTION ONTO NANOPARTICLES
1.4.1 Formation of the protein corona
new “bio-nano interface,” created by covering NPs with a complex layer of proteins (corona), determines the subsequent cellular/tissue responses and biological consequences [68, 69]. Surface characteristics such as charge, hydrophilicity and curvature dictate the extent and specificity of protein binding [67, 70]. Specific protein binding is one of the key elements that affect biodistribution of the NPs. Indeed, a detailed knowledge of NP-protein interaction is vital for a rational formulation design as well as optimization.
1.4.2 Analytical method for corona evaluation
Analysis of the protein corona involves purification of protein-NP complexes and separation and identification of the purified proteins. To date, the routine method for isolating protein-NP complexes is centrifugation. Relative to other techniques, centrifugation is easy and requires little material. Separation by centrifugation has been used to identify major plasma proteins such as human serum albumin (HSA), immunoglobulins, and fibrinogen bound to the NPs [66], [71]. It is not surprising to find these proteins bound to injected NPs because these are some of the most abundant proteins found in human plasma.
Aside from gel electrophoresis, other separation methods involving gel filtration, such as size-exclusion chromatography or affinity chromatography, are also used to separate proteins from plasma and identify individual proteins [66].
1.4.3 Outcome of protein-NP interactions
While the complete plasma proteome is expected to contain as many as 3700 proteins [69], of which only approximately 50 have been found in the protein corona associated with nanoparticles [67, 74]. Specific protein binding can have a direct effect on biodistribution and internalization of NPs. Certain components of the corona proteins allow macrophages of the RES to easily recognize NPs. These proteins are knownas “opsonins.” Binding of opsonins, for example, fibrinogen, Immunoglobulin G (IgG), and complement factors, are believed to promote phagocytosis and the removal of the particles from systemic circulation via cells of the RES. These particles tend to sequester in the RES organs very rapidly and concentrate in the liver and spleen. On the other hand, dysopsonins such as HSA generally prolong circulating time in the blood [75].
transportation of drugs across the BBB and into the brain, though the mechanism of transport is still under debate [78].
To inhibit opsonization and subsequent clearance by the RES, the surface of the NPs can be coated by hydrophilic polymers such as PEG to reduce protein binding [79-83]. The mechanism by which PEG decreases protein interactions is non-specific [84]. PEG is not the only polymer that can be attached to NPs to inhibit the protein binding to the surface of the NPs and avoid immune recognition. Various other polymers and polysaccharides have been utilized in place of PEG. In all cases, protein adsorption was not completely avoided (i.e. HSA, fibrinogen, IgG, and apolipoproteins were detected), but was greatly reduced [72].
1.5 PERSPECTIVES OF OPTIMIZING IN VIVO PERFORMANCE OF NP
Responding to these limitations, researchers recently shifted the paradigm of design from stable nanomaterials to “environment-responsive” systems that possess stimuli-responsive properties. External stimuli cause changes in the particle size, shape or surface structure, and lead to their rearrangement to improve targeted compound delivery. These dynamic nanoparticle systems may use biological, physical, or chemical factors in their target environment to trigger a change in their properties to maximize targeted delivery. Two approaches have been used so far. The first uses hallmark cues inside the target environment such as low pH, low O2 and ormatrixmetalloproteinase enzymatic activity within the tumor. One example is NPs with a PEG surface layer that will shed off in response to pH to reveal a positively charged surface. These particles target and are retained in hypoxic tumor regions [85]. Other groups have used pH to trigger the breakdown of the NPs to release drugs in local tumor environment [86]. Enzymatic activity has also been used as a trigger for drug release [87]. Additionally, by using local cues inside the tumor to trigger drug release, the NPs localized in the liver and spleen do not cause toxicity.
in tumor microenvironment maximizes tumor delivery. The shrunken NPs can more readily diffuse throughout the tumor for improved diagnostic sensitivity [88]. The second approach applies an artificial environmental cue such as near-infrared (NIR) light upon the target tissue. The NIR light can excite gold nanorods or nanoshells inside the tumor to generate heat to trigger localized drug release from the liposomes [89, 90].
CHAPTER 2
METHODOLOGY FOR PK / BIODISTRIBUTION STUDIES
2.1 INTRODUCTION
method. In addition, mass spectrometry is an end-point measurement, which lacks the ability to probe dynamic events in real time.
Due to the aforementioned circumstances, fluorescence imaging is emerging as a popular modality to couple with the traditional methods. Fluorescent dyes are conjugated to the drug to produce optical probes used in vivo or ex vivo. This technology is relatively safe, low-cost and noninvasive. The key to effective imaging, especially in deep tissues, is the use of fluorophores with a red or NIR emission range (600–1000 nm), which corresponds to low photon absorption and auto-fluorescence in tissues. Biological chromophores, in particular hemoglobin, strongly absorb visible light, thereby limiting the penetration depth to only a few millimeters. Other biological components, such as water and lipids, are optically transparent from the visible to the NIR range, but strongly absorb light in the infrared. The combined absorption of these components translates into an optical imaging window of approximately 600 to 1000 nm where the absorption coefficient of tissue is at a minimum. Additionally, light scattering and auto-fluorescence are low in the NIR. This allows a significant signal with relatively low background [97, 98].
an amorphous, calcium-phosphate-precipitate core wrapped with a single lipid-bilayer with surface modification of polyethylene glycol with and without a targeting ligand [99]. The NP formulation has been successfully used to deliver siRNA [99, 103] and cDNA (unpublished results) to both solid and metastatic tumors. Our results showed a discrepancy between the radioactivity and the fluorescence signals. Signals from 3H and 111In exhibit very similar distribution patterns, suggesting that the liver and spleen were the major accumulation sites. However, fluorescence imaging indicated that tumor accumulation was predominant. Furthermore, we found that the fluorescence signals in both liver and spleen are greatly attenuated compared with those in the tumor due to the intrinsic tissue absorption and light scattering. Therefore, careful attention must be paid to the quantification and interpretation of fluorescence imaging measurements, which could skew the data towards the tissues with less light absorption and scattering.
2.2 MATERIALS AND METHODS
2.2.1 Materials
(Alabaster, AL). NCI-H460 human lung cancer cells were obtained from American Type Culture Collection.
2.2.2 Experimental animals
All animal work was performed in accordance with and approved by the University of North Carolina Institutional Animal Care and Use Committee guidelines. Athymic nude (nu/nu) mice carrying H460 human lung cancer xenografts were used for all of the experiments.
2.2.3 3H labeling of oligonucleotides
3
H labeling of oligonucleotides was prepared by inducing hydrogen exchange with 3
H2O at the C8 positions of purine oligonucleotides using methodologies described by Graham et al. [104]. For each labeling experiment, 12 mg of 22-mer oligonucleotide was dissolved in 200 μL of 50 mM sodium phosphate and 0.1 mM EDTA (pH 7.8) and lyophilized in a 2 mL glass microfuge tube. The dry oligonucleotide was resuspended in 200 μL of 3
containing Sephadex G-25 (GE Healthcare, Life Sciences). The radiolabeled compound is stable in biological systems and was stored at -20°C for further experiments.
2.2.4 Preparation of LCP NPs
2.2.5 Tissue distribution study by Texas Red labeling
LCP NPs containing Texas Red-labeled oligonucleotides were intravenously injected into the tumor-bearing mice at a dose of 0.25 mg/kg of oligonucleotides. Four hours later, mice were sacrificed and tissues of interest were collected for fluorescence imaging. Fluorescent images were acquired under the IVIS Imaging System (Xenogen Imaging Technologies, Alameda, CA) at indicated wavelengths.
2.2.6 Tissue distribution study by radioisotope labeling
A dose of 0.25 mg/kg of oligonucleotides of labeled LCP NPs was intravenously injected into the mice. Four hours later, mice were sacrificed and tissues of interest were collected for further analysis. The amounts of 3H-labeled oligonucleotides and 111In that accumulated in different tissues were quantified using liquid scintillation and gamma counting, respectively.
2.2.7 Fluorescence intensity measurement in different tissues
100 mg of tissue per mL. One-hundred μL each of blood, tissue homogenate and homogenization buffer were then transferred to a 96 well plate. Ten μL of homogenization buffer containing various amounts of Texas Red oligonucleotides were added. The tissues and plate were then imaged using an IVIS Imaging System as described above. The plate was also measured by a plate reader (Bioscan Inc., Washington DC) for the fluorescence intensity in order to create standard curves.
To prepare the perfused liver, un-injected animals were euthanized and 3 mL of warm PBS was perfused via portal vein through the liver to expel the blood. The perfusion rate was kept at about 3 mL/min. Texas Red-labeled oligonucleotides (0.5 µg) were directly injected into non-perfused liver, perfused liver and tumor, respectively. The tissues were then imaged using the Kodak In Vivo Imaging System FX Pro (Carestream Health, Woodbridge, CT) at indicated wavelengths.
2.2.8 Statistical analysis
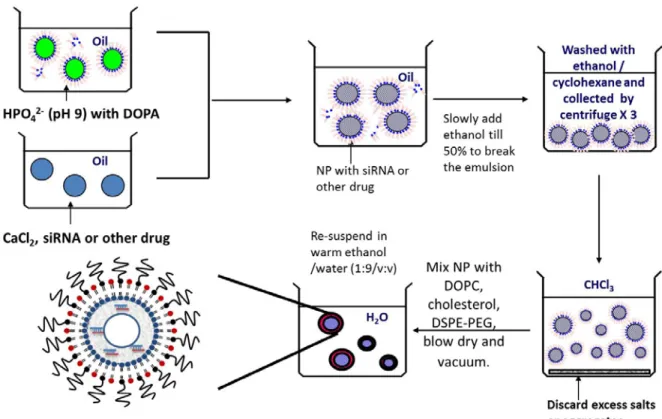
Figure 2.1 Formation of LCP NPs formulation in microemulsion.
2.3 RESULTS
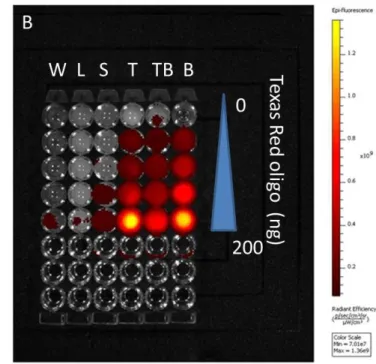
2.2C, significant fluorescent signals could be detected in the tumors, while the brightness of the liver and spleen remained just above the background level. To test whether fluorescence intensity of labeled oligonucleotides is subjected to the microenvironment in which they reside, the liver, spleen and tumors were dissected from un-injected animals and directly injected with fluorescence-labeled oligonucleotides. The ex vivo fluorescence imaging is shown in Figure 2.3A. Minimal signals were detected in the liver and the spleen. In contrast, the tumor showed significant fluorescence. These results suggested that tissue characteristics in the liver and the spleen strongly influences and reduced the fluorescent signals.
(Figure 2.4). These differences should be taken into account in the quantitative analysis of biodistribution data. Texas Red-labeled oligonucleotides exhibited reasonable linearity in each tissue homogenate, including the liver, spleen and tumor, but the attenuation coefficient of these tissues (the slopes in Figure 2.5) were dramatically different. While quantitative comparison in a tissue-specific manner is valid (e.g. liver vs. liver, tumor vs. tumor), it is not appropriate to measure the accumulated amount of the dose by comparing fluorescence intensity between different tissues.
Figure 2.2 Biodistribution of LCP NPs in tumor-bearing mice.
Figure 2.3 Measured fluorescence intensity of Texas Red oligonucleotides.
Figure 2.4 Measured fluorescence intensity of Cy5.5 in tissue homogenate.
(Excitation/emission wavelengths: 650/700 nm)
Figure 2.5 Standard curve generated by quantifying the intensities of known
concentrations of oligonucleotides.
(Excitation/emission wavelengths: 550/600 nm)
2.4 DISCUSSION
absorption, and light scattering. NIR dyes generate less background fluorescence, since auto fluorescence in tissues is mostly excited by near ultraviolet and blue light and emits in the yellow range [105]. Moreover, it has been demonstrated that use of red and NIR probes increases the depth of penetration in mammalian tissues by several orders of magnitude by avoiding the major absorption regions of hemoglobin. However, it is note-worthy that hemoglobin exhibits a broad absorption band. Even though the absorption of hemoglobin is much less intense in the NIR region, its contribution (in particular, by oxyhemoglobin) to the total light attenuation is certainly not negligible for quantitative purposes. Scattering has a weak dependence on wavelength. It arises due to a different relative refractive index at the boundaries between two different structures, such as the extracellular fluid and the cell membrane. Tissues vary greatly in size, component and microstructure; they are optically inhomogeneous. Given the larger size and increased hemoglobin content in the liver and the spleen, it is expected that the light signal would be greatly reduced. These differences may also be attributed to the light absorption by other tissue constituents and to light scattering by lipid membranes and cell fragments. When using fluorescence intensity in optically heterogenous samples for quantitative purposes, careful method development and validation should be performed.
CHAPTER 3
CHARACTERIZATION OF LCP NP FORMULATION
In the present study, the LCP NP formulation (size around 30 nm) was used for two
reasons. First, its unique core-membrane structure allows us to readily modify the surface with
different lipids and various amounts of PEGylation (Figure 3.1). Second, LCP NPs can be easily
purified due to the density difference between the particle and the extra excipient, which permits
accurate surface characterizations (Figure 3.2). In this chapter, we demonstrate that LCP NPs
39
3.1 INTRODUCTION
To date, the characterization of NPs in terms of PEG density is only studied casually with many reports simply using an assumption of complete insertion of the input PEG molecules. To measure the PEG concentration on the surface of NPs accurately, it is necessary remove the unincorporated PEG molecules by filtration or centrifugation based on the difference in size or density. The LCP nanoparticles prepared by the method described in 2.2 contain extra lipids (e.g. DOTAP or DOPC, Cholesterol and DSPE–PEG2000). To determine the accurate concentration of DSPE–PEG2000 on the surface of LCP NPs, sucrose gradient centrifugation was used to separate LCP NPs with extra lipids. Sucrose gradient centrifugation is commonly used in cell biology to separate the cellular organelles or macromolecules based on their density. The technique involves density gradients prepared by altering the sucrose concentration such that the top of the tube contains liquids of the lowest density and the bottom contains those with the greatest. In the presence of centrifugal force, dispersed particles migrate through the gradient until they reach a zone of density that is equal to their own. LCP NPs containing a calcium phosphate core are heavier than particles that only consist of lipids. Sucrose gradients were prepared by superimposing equal volumes of sucrose solutions layer by layer at decreasing concentrations. The LCP NPs containing dense CaP cores banded tightly at a certain position of sucrose solution, while the unassociated lipid was present as a smear at the top, as shown in Figure 3.2.
40
difference in zeta-potential of the NPs with and without PEG is an indication that PEG has coated the surface. We also performed XPS high-resolution carbon 1s scans. XPS is a very powerful surface analytical tool which allows characteristic elemental detection, chemical state identification, and quantification. XPS survey scans are known to be very effective in characterizing the PEG chains that have been grafted onto various solid matrices such as silicon and polystyrene. High resolution C1s scans provide more in-depth information from the characteristic C-O peak, with its intensity directly proportional to the PEG concentration on the surface.
To investigate the conformation of PEG on surfaces of LCP NPs, we employed SANS in situ in water. SANS has emerged as a powerful, noninvasive technique used to characterize the structures of materials on solid and liquid surfaces and interfaces. Importantly, due to their low energies, cold neutrons do not bring any damage on sometimes fragile polymeric samples. SANS is also a bulk probe giving rise to the average polymer conformation over the entire sample. The water fraction inside the polymer layer can also be estimated. Detailed information of SANS is provided in APPENDIX A.
41
Figure 3.2 Schematic illustration of sucrose gradient centrifugation for purification.
3.2 MATERIALS AND METHODS
3.2.1 Materials
42 3.2.2 Experimental animals
All work performed on animals was in accordance with and approved by the University of North Carolina Institutional Animal Care and Use Committee. Pharmacokinetics and biodistribution studies of LCP NPs were performed in normal athymic nude (nu/nu) mice and mice carrying H460 human lung cancer xenografts. Tumors were allowed to grow to a size of around 0.2cm3 before injections.
3.2.3 NP preparations
43 3.2.4 Sucrose gradient centrifugation
The discontinuous sucrose gradient was created with 0.9 mL each of 60% sucrose, 40% sucrose, 20% sucrose and deionized water layered consecutively from bottom to top in 4 ml ultracentrifuge tubes. The mixture containing LCP NPs and extra lipids was applied between 10% sucrose and water. The gradients were centrifuged using a Beckman Coulter SW 60Ti rotor at 168,000g for 4 h at 20°C and then separated into aliquots removed from top to bottom. The fractions were then diluted with ethanol and lysis buffer (0.1% Triton-100 and HCl, pH=2.5) for further measurements. For the SANS experiment, LCP NPs were purified using 2H2O and 2H-sucrose.
3.2.5 Transmission electron microscopy
44 3.2.6 Dynamic light scattering and Zeta potential
The final products, LCP NPs with different lipids grafted to their surface, were diluted with water appropriately. Zeta potential and particle size of the LCP NPs were determined by using a Malvern ZetaSizer Nano series (Westborough, MA).
3.2.7 Fluorescence-labeled lipids analysis
To identify the composition of each faction, Rhodamine-DOPE, DSPE-PEG2000-CF and 3H labeled oligonucleotide were used to label the outer leaflet lipid, PEG2000-DSPE and CaP core, respectively. The LCP NPs were prepared and purified as described above. The fractions were analyzed using a fluorescence spectrometer and liquid scintillation counter.
3.2.8 X-ray photoelectron spectroscopy study
45
characteristic of a PEG chain. All scans of carbon 1s photoelectrons were peak-fitted using software provided with the instrument.
3.2.9 Small angle neutron scattering study
SANS data were collected on the EQ-SANS instrument of the Spallation Neutron Source of Oak Ridge National Laboratory [106]. A sample-to-detector distance of 4m was employed. The instrument was operated in the 30 Hz, frame-skipping mode using a minimum wavelength (λ) of 2.5 Å to produce two bands of neutrons (2.5 Å < λ1 < 6.1 Å and 9.4 Å < λ2 < 13.4 Å). This method provides an effective q-range of 0.005 Å-1 to 0.42 Å-1, and θ is the scattering angle. The sample temperature was controlled by a water bath. Data
46 3.2.10 Statistical analysis
All statistical analyses were performed by a two-tailed student t-test. Data were considered statistically significant when P value was less than 0.05.
3.3 RESULTS
3.3.1 Size, morphology and surface charge of LCP NPs
Characteristics of purified LCP NPs are summarized in Table 3.1. All the NPs were PEGylated at an optimal density of 20% molar ratio of the total outer leaflet lipid. Both LCP-DOTAP and LCP-DOPC NPs had a hydrodynamic diameter of about 30 nm. When the particles were formulated with DOPC as the outer leaflet lipid, the zeta potential was approximately -10 mV. In contrast, when DOTAP was employed, the surface potential became around 15 mV. The slightly positive surface charge might be an indication of PEG modification on the NPs, in contrast to that of pure DOTAP liposomes (~70 mV). At a concentration as high as 20%, the PEG coating is supposed to achieve steric shielding of the NPs’ surface and thus create the “stealth” property [46, 61].
47
Table 3.1 A summary of characteristics of LCP NPs.
Figure 3.3 TEM image of CaP cores. Scale bar indicates 10 μm.
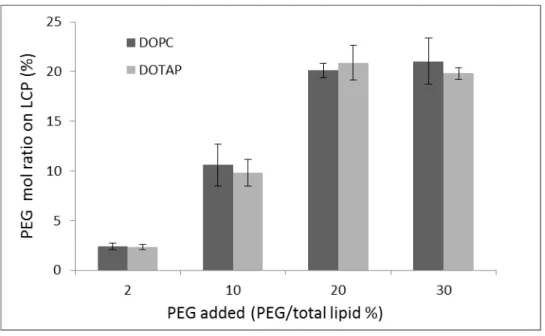
3.3.2 Surface coverage of PEG
48
between the layer of 20% and 40% sucrose, while the unassociated lipids were present as a smear from the top of the gradient to the interface between 20% and water (Figure 3.2). We found that the isolated purified LCP NPs contain around 90% tritium and calcium (by inductively coupled plasma mass spectrometry, ICP-MS). Rhodamine-DOPE, DSPE-PEG2000-CF and trace amounts of tritium were detected in the fractions of lower sucrose concentrations, suggesting that extra lipids could be separated from the dense nanoparticles using this method.
49
Figure 3.2 Quantitative analysis of DSPE-PEG-CF on purified LCP NPs.
50
layer. However, most of the C-O signal comes from the PEG coating and the trend of these observations confirms the presence of the PEGylation on the surface of LCP NPs.
Figure 3.3 High resolution carbon 1s scans of LCP NPs with different amount of PEGylation.
Scale bar indicates 10 μm.
3.3.3 Conformation of surface-grafted PEG
51
been reported that the elevation of temperature leads to a decrease in solubility of PEG in water, resulting in a transition of polymers with PEG side chains in an extended state into PEG chains with a collapsed state [109]. Therefore, the SANS curves of the LCP NPs are expected to differ at different temperatures, as shown in Figure 3.6. The varying size distribution of LCP particle size (judged by TEM micrograph in Figure 3.3) creates difficultly when fitting the whole q range. Therefore, we focused on the largest difference between the SANS data occurring at 10 and 40 oC (q > 0.02 Å-1). Presumably the difference results from the temperature response of the PEGylated lipids on the surface of the LCP. The intensity within a q range of 0.23 and 0.5 Å-1 increases when the sample is at 10 oC due to the extension of PEG chains on the LCP surface.
-52 7
(fixed), (3.9x10⁻⁶ ± 10%) and (6x10⁻⁶ ± 10%) Å-2, respectively. The average radius of the hollow core, Rcore and thickness of CaP, tCaP were initially set to be 35 and 30 Å, respectively, based on the TEM data, while the lipid bilayer thickness (tlip) was constrained in the normal range between 20 and 40 Å. The final, best-fitting parameters of the model for the 10 oC data were solv = 5.5 x 10⁻⁶ Å-2, PEG = 1.85 x 10⁻⁶ Å-2, lip = 4 x 10⁻⁷ Å-2, CaP = 4.5 x 10⁻⁶ Å-2, core = 6.3 x 10⁻⁶ Å-2, tcore = 35.7 Å, tCaP = 31.1 Å, tlip = 25 Å and thickness of hydrated PEG (tPEG) = 8.3 Å.
The same parameters were used to fit the 40 oC data, except for the values of PEG and tPEG, which were allowed to vary freely. As a result, both models agree with the data reasonably well (Figure 3.6). The two facts that the hydrated PEG layer decreased from 8.3 Å to nearly 3.7 Å and that the bilayer becomes slightly thicker (from 25 Å to 21 Å) with an increase in temperature are consistent with the collapsed state of PEG chains. Based on the scattering length densities (SLDs) of the hydrated PEG layer and solvent at 10 oC, the volume fraction of water in the PEG layer is estimated to be ~20%. Since the molecular weight (MW) of PEG is ~2000 g/mol, the radius of gyration (RG) is estimated to be 18 Å [110], resulting in an overlapping concentration (~ ) of 0.174 g/mL, which is less than
53
Figure 3.6 SANS data of the LCP NPs at 10 oC (circles) and 40 oC (triangles).
The solid lines are best fits to both data sets.
54
3.4 DISCUSSION
In this chapter, we demonstrated the ability to formulate a core-membrane structured nanoparticle with full coverage of PEG on the surface. On the basis of fluorescence-labeled PEG analysis, XPS carbon 1s scans, and SANS modeling, a densely grafted, inter- and intra- molecular entangled PEG layer was observed.
Our group [79], and others in the early 1990s [111], demonstrated RES avoidance and long circulation half-life achieved by surface incorporation of PEG in liposomes. This method employs PEG-phospholipids which could by anchored on the lipid membrane by hydrophobic interactions. Due to the amphiphilic nature of the PEG-phospholipids, the degree of surface PEGylation is quite limited; usually less than 5 % if the lipid membrane integrity is to be preserved [61]. However, high density of PEG is necessary to achieve steric shielding of the nanoparticles’ surface and thus create the “stealth” property. The unique core-membrane structure of LCP NPs presents an efficient and robust platform for high density PEGylation. In this formulation, the inner leaflet lipid (DOPA) is known to strongly interact with cations (Ca) in the core and is therefore supported and stabilized by the solid and positively charged core. Owing to this substrate-membrane interaction, the supported bilayer has greater stability than unsupported liposomal bilayers [112, 113] and permits a high amount of incorporated DSPE-PEG2000, a detergent-like surfactant. This platform provides an opportunity to modify the formulation with a high-density PEG coating and explore the impact of a PEG coating on the in vivo behavior of nanoparticle formulation.
55
CHAPTER 4
PHARMACOKINETICS AND BIODISTRIBUTION OF LCP NP
57
4.1 INTRODUCTION
To be useful in vivo, NPs must avoid opsonization and subsequent recognition by macrophages. This can be accomplished through PEGylation [114]. Surface-modification of NPs with PEG has been widely used to prolong the circulation time and improve in vivo performance of various nanoscaled carriers. The success of PEGylation critically depends on the steric stabilization conferred by PEG chains on the surface of the NPs. Stabilization is achieved through the highly hydrophilic and flexible nature of PEG chains, which provide repulsive interactions with biological components in vivo. The ways in which grafted PEG forms a well hydrated barrier layer on the surface, sterically hindering protein adsorption, were thoroughly discussed in Chapter 1.
We have demonstrated that the LCP NP formulation can effectively deliver siRNA [99, 103] to both solid and metastatic tumors. In Chapter 3, we showed that the surface of NPs containing a supported lipid bilayer could be modified with a high amount of PEG (20 mol%). A complete shielding of the NP surface was found with a neutral or slightly positive zeta potential. The data suggest that the NPs with full surface protection may show improved EPR effect, improving solid tumor delivery.
58
density and correlated with the PK and tissue distribution of the modified LCP NPs after intravenous administration. The results of the experiment have revealed some surprising conclusions that are not predicted by existing theories. We believe these findings will benefit the rational design and application of PEG and other hydrophilic polymers for the development of effective drug carrier systems.
4.2 MATERIALS AND METHODS
4.2.1 Materials
22-mer oligonucleotides (sense sequence, 5’-CAAGGGACTGGAAGGCTGGG-3’,) labeled with Texas Red or Cy5.5 Dye (excitation/emission wavelengths of 550/600 nm and 650/700nm, respectively), were purchased from Sigma, Inc. Both Texas Red and 3H-labeled oligonucleotides were used to mimic siRNA. Dioleoylphosphatidylcholine (DOPC), dioleoylphosphatydic acid (DOPA), 1,2-distearoyl-sn-glycero-3-phosphoethanolamine-N-[poly(ethylene glycol)2000] (DSPE-PEG2000) were purchased from Avanti Polar Lipids, Inc. (Alabaster, AL). NCI-H460 human lung cancer cells were obtained from American Type Culture Collection.
4.2.2 Experimental animals
59
Pharmacokinetics and biodistribution studies of LCP NPs were performed in normal athymic nude (nu/nu) mice and mice carrying H460 human lung cancer xenografts.
4.2.3 NPs preparation
LCP NPs were prepared as previously described in the Chapter 2. The formulations were used without further purification.
4.2.4 PK study
PK studies of LCP NPs were performed in normal nude mice and mice carrying H460 human lung cancer xenografts. Tumors were allowed to grow to a size of around 0.2 cm3 before injections. Animals were intravenously injected with in LCP NPs containing 3H labeled oligonucleotide at a dose of 0.25 mg/kg. At selected time points, mice were sacrificed and blood was collected through parallel sampling. The amount of 3H labeled oligonucleotide in the blood was quantified using liquid scintillation counting. Under the assumption that the total blood volume in the mouse is 7% of its body weight, NP concentrations in the blood were calculated.
4.2.5 Tissue distribution study
60
containing 3H labeled oligonucleotide at a dose of 0.25 mg/kg. At selected time points, mice were sacrificed and the heart, liver, spleen, lungs, kidneys and tumors were collected. The tissues were dissolved in NCS Tissue Solubilizer (GE Healthcare, Life Sciences) and the amount of 3H labeled oligonucleotide in the different tissues was quantified using liquid scintillation counting.
4.2.6 Cell-type specific localization by confocal microscopy
Mice were intravenously injected with Texas Red-labeled oligonucleotides contained in different LCP NP formulation four hours before sacrifice and tissue collection. Tissue blocks were immediately frozen in OCT (Tissue-Tek, Dublin, OH) on dry ice, allowing the generation of ten-µm-thick cryosections. The tissue sections were then mounted on Superfrost Plus slides (Fisher Scientific Co., Houston, TX). After a brief rinsing with PBS to remove any surface embedding medium, we completed fixation of the particles with acetone at -20 °C. Then, tissue sections were stained with Alexa Fluor 488 phalloidin (Life Technologies) and mounted in a medium containing DAPI (Vector Lab.). Images were captured using an Olympus FV1000 MPE confocal microscope under three channels: DAPI for nuclei, Alexa Fluor 488 for phalloidin, and Texas Red for oligonucleotide.
4.2.7 Statistical analysis
61
4.3 RESULTS
4.3.1 Blood Clearance
62
Figure 4.1. Pharmacokinetics of LCP NPs in normal and tumor-bearing mice.
Data are plotted as % injected dose vs time (N=4). The outer leaflet lipid is DOPC. PEG concentration is 20% (molar percent of outer leaflet lipids).
4.3.2 Kinetics of tissue distribution
63
showed significant accumulation of the 3H signal (~25% ID and 15% ID, respectively), both in excess of that in the tumor (<5% ID). No significant signal accumulated in the kidney, indicating that the particles do not disintegrate or release the encapsulated cargo in circulation. Despite complete NP PEGylation, substantial amount of accumulation still occurred in the RES organs (liver and spleen). A fairly small percentage of the dose reaches the tumor site. The results also show that blood clearance and tissue distribution kinetics are approximately equal in both tumor-free and tumor-bearing mice.
Figure 4.2 Tissue distribution of LCP NPs as a function of time after administration.
(A: normal mice; B: tumor-bearing mice. N=4) Data are plotted as % injected dose vs time. The outer leaflet lipid is DOPC. PEG concentration is 20% (molar percent of outer leaflet lipids).
4.3.3 Cell-type specific localization in liver and spleen
64
65
Figure 4.3 Cell-type specific localization of LCP NPs in liver (A) and Spleen (B).
66
4.4 DISCUSSION
Despite complete nanoparticle PEGylation, significant accumulation still occurred in the RES organs (liver and spleen); only a minor amount of the dose accumulated in the tumor. The results also show that blood clearance and tissue distribution kinetics are approximately equal in both tumor-free and tumor-bearing mice. This is likely a consequence of the small size of the LCP nanoparticles (~30nm). Extravasation in the liver is plausible because the presence of fenestrae in liver sinusoids, which measure 100 nm in diameter in mice [14]. This condition can be described by a two-compartment model with, as shown in Figure 4.4. Nanoparticle elimination from the central compartment occurred due to RES
uptake and distribution to the peripheral compartment (tissues with discontinuous endotheliums), where Xb, XT and XL are the amount of NPs in blood, tumor and liver, respectively. K10 is the elimination rate constant from the central compartment by RES uptake and K12, 21, 13, 31 are the intercompartmental transfer rate constants. VT and VL are the volume of distribution of tumor and liver, respectively. For simplicity, we are assuming that these processes are all occur in a first-order fashion. The tumor tissue retains NPs due to a lack of lymphatic drainage; consequently, K21 would be negligible compared with other intercompartmental transfer. K10 depends on the properties of the NPs, such as size and surface chemistry, which was discussed in Chapter 1.
67
permeability, and blood flow. Given the limited blood flow through the tumor and its relatively small volume, a highly perfused organ with a discontinuous endothelium, such as the liver, can easily outpace the tumor and thus become the major distribution site.
The significant uptake by the hepatocytes is of great interest to formulation design in biomedical applications due to its importance in many infectious and metabolic disorders. On the other hand, it highlights a potentially important complication in the development of nanoparticles regarding imaging and therapeutic applications in oncology. Recently, there is increasing evidence that small nanoparticles in the size range of 10-30 nm can more effectively penetrate the physiological barriers imposed by tumor vasculature and the interstitial matrix than larger particles [88, 115]. Similarly, avoiding rapid distribution to the liver will be another critical design criterion for future nanoparticle systems targeting tumor sites.
Figure 4.4 Proposed two-compartment PK model in the tumor-bearing mice.
X0 = injected dose; Xb XT XL=concentration in blood, tumor and liver; V =volume of distribution, k10= clearance coefficient;
68
In summary, we have shown that a high density of PEG coating with heavily overlapped and collapsed regime was placed on the surface of LCP NPs. This PEG coating enables delivery to the hepatocytes and avoidance of RES uptake, although whether the hepatocyte uptake is specific to lipid-based nanoparticles is still unknown. This study established a relationship between the physicochemical properties of nanoparticles and their in vivo pharmacokinetics and biodistribution profile, which may provide important
CHAPTER 5
PROTEIN ADSORPTION AND ITS IMPACT ON IN VIVO BEHAVIOR
PK and biodistribution of nanoparticulate carriers are controlled by a complex array of interrelated physicochemical and biological factors. Surface chemistry of NPs has been identified as one of the key determinants of these characteristics. LCP NPs are an effective drug delivery system to both solid and metastatic tumors. The well-defined lipid bilayer-core structure of the LCP NPs allows us to examine the effect of different surface lipids on the in vivo fate of NPs. The PK and biodistribution studies of LCP NPs formulated with DOPC and
70
5.1 INTRODUCTION
In comparison to bulk biomaterials, NPs have an extremely high surface-to-volume ratio. Control of their surface properties is crucial to their in vivo performance. The surfaces of NPs are immediately covered by proteins after they have been injected into the blood. The absorption of proteins to such surfaces confers a new “biological identity” to NPs in the biological milieu, which is what cells, tissues and organs actually “see” when interacting with NPs [67]. This new “bio-nano interface,” created by covering NPs with a complex layer of protein “corona” determines the subsequent cellular/tissue responses and biological consequence [68, 69]. Surface characteristics such as charge, hydrophilicity and curvature dictate the extent and specificity of protein binding [67, 70]. Specific protein binding is one of the key elements that affect biodistribution of the NPs. Indeed, a detailed knowledge of NP-protein interaction is vital for the rational formulation design and optimization of nanoparticles.
71
dodecyl sulfate polyacrylamide gel electrophoresis (SDS-PAGE) and matrix-assisted, laser-desorption ionization, time-of-flight mass spectrometry (MALDI-TOF-MS). The results suggested that the enrichment of apolipoproteins on the surface of LCP-DOTAP NPs might be the explanation of its enhanced liver accumulation. This information is helpful in determining the advantages and disadvantages of the outcome for the various proteins and facilitating development of effective drug carriers.
5.2 MATERIALS AND METHODS
5.2.1 Materials
72 5.2.2 Experimental animals
All work performed on animals was in accordance with and approved by the University of North Carolina Institutional Animal Care and Use Committee. Pharmacokinetics and biodistribution studies of LCP NPs were performed in normal athymic nude (nu/nu) mice and mice carrying H460 human lung cancer xenografts. ApoE-deficient mice (ApoE-/-, stock #002052) and wild type C57BL/6 mice were obtained from Jackson Laboratories (Bar Harbor, ME).
5.2.3 NPs preparation
NPs were prepared as previously described in Chapter 2. The particles were purified using sucrose gradient centrifugation as described in the Chapter 2 to enable the completion of a protein adsorption assay. The formulation was used without further purification in all of the animal studies.
5.2.4 PK study
73
sacrificed for blood collection. Radioactivity was measured using liquid scintillation counting.
5.2.5 Tissue distribution
Biodistribution studies of LCP NPs were performed in normal athymic nude (nu/nu) mice and mice carrying H460 human lung cancer xenografts. Tumors were allowed to grow to a size of around 0.2cm3 before injections. Animals were intravenously injected with in LCP NPs containing 3H labeled oligonucleotide at a dose of 0.25 mg/kg. Four hours after injection, animals were sacrificed for tissue collection. The tissue samples were processed as described in Chapter 4. Radioactivity was measured using liquid scintillation counting.
5.2.6 Cell-type specific localization in liver
Confocal microscopy imaging of the frozen section of liver was conducted as described in Chapter 4.
5.2.7 Determination of the protein corona composition
74
then re-suspended in PBS in a protein loading buffer. Gel electrophoresis was performed at 120V, 400mA for about 60 minutes. The gels were stained in coomassie blue staining and destained overnight in 50% methanol, 10% acetic acid [116, 117].
After the separation of proteins by SDS-PAGE, bands were excised from the gel and digested with trypsin, and the resulting peptide mixtures were separated and analyzed by MALDI-TOF-MS (ABI 4800 MALDI TOF/TOF). Spectra were analyzed by MASCOT software to identify tryptic peptide sequences matched to the NCBI database (http://www.ncbi.nlm.nih.gov/).
5.2.8 In vivo apoE dependency
LCP NPs containing 3H labeled oligonucleotide were administered intravenously via the tail vein at a dose of 0.25 mg/kg into ApoE-deficient mice and wild type C57BL/6 mice, respectively. Four hours after injections, major organs were collected from animals and processed for radioactivity measurements.
5.2.9 Statistical analysis
75
5.3 RESULTS
5.3.1 Blood Clearance
76
Figure 5.1. Pharmacokinetics of LCP NPs with different lipid in normal and
tumor-bearing mice.
Data are plotted as % injected dose vs time (N=4). PEG concentration is 20% (molar percent of outer leaflet lipids).
The data of LCP-DOPC NPs is Figure 4.1. The data was placed here for easy comparison with that of LCP-DOTAP NPs.
5.3.2 Tissue distribution
77
(60% ID versus 30% ID). It is likely that the faster clearance of LCP-DOTAP NPs in the β phase is due to this enhanced uptake by liver.
Figure 5.2 Tissue distribution of LCP NPs with different lipid.
(A: normal mice; B: tumor-bearing mice. N=4) Data are plotted as % injected dose vs time. The outer leaflet lipid is DOPC. PEG concentration is 20% (molar percent of outer leaflet lipids).
5.3.3 Cell-type specific distribution
78
LCP-DOTAP NPs. Only minor amounts of signal were associated with nonparenchymal cells in the liver sinusoids (Figure 5.3B and C). Distribution was generally homogenous throughout the different zones and the liver lobules. Replacement of DOTAP on the NPs with DOPC resulted in markedly reduced hepatocyte uptake (Figure 5.3C).
Figure 5.3 Cell-type specific localization of LCP NPs with different lipid in liver.
DAPI for nuclei, Alexa 488 for phalloidin, and Texas Red for oligonucleotides. DOPC and DOTAP were in the outer leaflet of the wrapping lipid bilayer of LCP NPs, respectively.
5.3.4 Composition of protein corona
79
80
Figure 5.4 SDS-PAGE gel of serum proteins obtained from LCP NP-protein complexes following incubation at different serum concentrations.
81
Table 5.1 Representative proteins associated with LCP-DOTAP NPs with 5% PEG
incubated in 80% serum, as identified by LC MS/MS.
5.3.5 in vivo apoE dependency
82
Figure 5.5 Tissue distribution of LCP NPs in wild-type and apoE−/− mice (N=4).
** indicates p<0.05 Formulations: LCP-DOPC and LCP-DOTAP NPs with 20% PEG.
5.4 DISCUSSION