Impacts of active school design on
school-time sedentary behavior and physical activity:
A pilot natural experiment
Jeri Brittin1,2*, Leah Frerichs3, John R. Sirard4, Nancy M. Wells5, Beth M. Myers5, Jeanette Garcia6, Dina Sorensen7, Matthew J. Trowbridge8, Terry Huang9
1 HDR, Department of Built Environment Research, Omaha, NE, United States of America, 2 University of
Nebraska-Lincoln, College of Architecture, Department of Interior Design, Lincoln, NE, United States of America, 3 University of North Carolina-Chapel Hill, School of Public Health, Department of Health Policy and Management, Chapel Hill, NC, United States of America, 4 University of Massachusetts-Amherst, School of Public Health and Health Sciences, Department of Kinesiology, Amherst, MA, United States of America,
5 Cornell University, College of Human Ecology, Department of Design and Environmental Analysis, Ithaca,
NY, United States of America, 6 University of Central Florida, College of Education and Human Sciences, Department of Educational and Human Services, Orlando, FL, United States of America, 7 VMDO Architects, Charlottesville, VA, United States of America, 8 University of Virginia, School of Medicine, Department of Emergency Medicine, Charlottesville, VA, United States of America, 9 City University of New York, School of Public Health, Graduate Center, New York, NY, United States of America
Abstract
Background
Children spend a significant portion of their days in sedentary behavior (SB) and on average fail to engage in adequate physical activity (PA). The school built environment may influence SB and PA, but research is limited. This natural experiment evaluated whether an elemen-tary school designed to promote movement impacted students’ school-time SB and PA.
Methods
Accelerometers measured SB and PA at pre and post time-points in an intervention group who moved to the new school (n = 21) and in a comparison group experiencing no school environmental change (n = 20). Difference-in-difference (DD) analysis examined SB and PA outcomes in these groups. Measures were also collected post-intervention from an indepen-dent, grade-matched group of students in the new school (n = 21).
Results
As expected, maturational increases in SB were observed. However, DD analysis estimated that the intervention attenuated increase in SB by 81.2±11.4 minutes/day (p<0.001), con-trolling for time in moderate to vigorous physical activity (MVPA). The intervention was also estimated to increase daily number of breaks from SB by 23.4±2.6 (p<.001) and to in-crease light physical activity (LPA) by 67.7±10.7 minutes/day (p<0.001). However, the intervention decreased MVPA by 10.3±2.3 minutes/day (p<0.001). Results of grade-matched independent samples analysis were similar, with students in the new vs. old school spending 90.5±16.1 fewer minutes/day in SB, taking 21.1±2.7 more breaks from SB
a1111111111 a1111111111 a1111111111 a1111111111 a1111111111
OPEN ACCESS
Citation: Brittin J, Frerichs L, Sirard JR, Wells NM,
Myers BM, Garcia J, et al. (2017) Impacts of active school design on school-time sedentary behavior and physical activity: A pilot natural experiment. PLoS ONE 12(12): e0189236.https://doi.org/ 10.1371/journal.pone.0189236
Editor: Jose´ Guilherme Behrensdorf Derraik,
University of Auckland, NEW ZEALAND
Received: May 12, 2017
Accepted: November 21, 2017
Published: December 7, 2017
Copyright:©2017 Brittin et al. This is an open access article distributed under the terms of the Creative Commons Attribution License, which permits unrestricted use, distribution, and reproduction in any medium, provided the original author and source are credited.
Data Availability Statement: All relevant data are
within the paper and its Supporting Information files.
Funding: The work in Virginia was partially
(p<0.001), and spending 64.5±14.8 more minutes in LPA (p<0.001), controlling for time in MVPA. Students in the new school spent 13.1±2.7 fewer minutes in MVPA (p<0.001) than their counterparts in the old school.
Conclusions
This pilot study found that active school design had beneficial effects on SB and LPA, but not on MVPA. Mixed results point to a need for active classroom design strategies to miti-gate SB, and quick access from classrooms to areas permissive of high-intensity activities to promote MVPA. Integrating active design with programs/policies to promote PA may yield greatest impact on PA of all intensities.
Introduction
Physical activity (PA) has profound impacts on children’s current and future health [1], and is positively associated with classroom behavior and learning [2,3]. PA decreases over time in children both prior to and during adolescence [4–11]. It has been shown that children can be sedentary for up to 70% of school time, including physical education class and breaks [12]. Children spend a large proportion of their waking hours in school, and schools are relatively accessible venues for population-based interventions [13]. Therefore, increasing children’s PA at school has become a national focus to address childhood obesity and related diseases. The National Academy of Medicine has emphasized a need to develop high-quality research on the influence of school environments on children’s PA [1].
A number of studies of school built environment characteristics and children’s PA have measured MVPA, with a few also including SB as an outcome [14]. One systematic review con-cluded that provision of activity-oriented facilities, such as gymnasiums and sports fields, was positively associated with PA during recess [15]. Among longitudinal studies addressing school built environment effects on PA, environmental variables have included exterior fea-tures such as gardens [16], playgrounds and outdoor recreation and recess areas [17,18], and the conduciveness of school surroundings for active commuting [18]. A recent playground reconstruction study found that the environmental intervention did not affect MVPA, but increased light PA (LPA) and decreased SB in younger children [19]. Several small-scale longi-tudinal studies have addressed PA and school classroom features intended to reduce students’ time spent sitting. A review of 13 studies concluded that a range of classroom design ap-proaches, including incorporation of stand-biased and ergonomic versus conventional fur-nishings, were effective in reducing students’ daily sitting time by 44–60 minutes [20].
This pilot natural experiment, including pre- and post- intervention measures and mea-sures in a grade-matched comparison group, contributes new findings about the impacts of an elementary school environment that was holistically designed to mitigate SB and promote PA. The aim of this study was to test hypotheses that children exposed to a new activity-promoting school built environment would demonstrate, relative to a comparison group, (1) decreased daily school time in SB and more frequent breaks from SB (i.e., transitions to higher intensity activity) as compared to SB time and breaks in their previous traditional school environment, and (2) increased daily school time in LPA and MVPA compared to time spent in these activity intensity levels in their previous school. We also hypothesized that an independent, grade-matched sample of students in the new school would demonstrate lower daily SB time and
provided by the U.S. Department of Agriculture (USDA) through the Food & Nutrition Service (FNS) People’s Garden pilot program (Project #CN-CGP-11-0047) and by the Cornell University Agricultural Experiment Station (Hatch funds) (#NYC-327- 465) and Cornell Cooperative Extension (Smith Lever funds) through the National Institutes for Food and Agriculture (NIFA) USDA. Additional funding for the New York data came from: Cornell University’s Atkinson Center for a Sustainable Future (ACSF); The College of Human Ecology, Cornell University; The Bronfenbrenner Center for Translational Research (BCTR), Cornell University; and the Cornell Cooperative Extension Summer Intern Program. Funding organizations played no role in the design, implementation, or publication of this study. HDR and VMDO provided support in the form of salaries for JB and DS, respectively, but did not have any additional role in the study design, data collection and analysis, decision to publish, or preparation of the manuscript.
Competing interests: The authors have declared
breaks, and more time in LPA and MVPA, compared to intervention students at baseline in the old school.
Methods
Research design
The quasi-experimental research design included pre and post measurements in an inter-vention group at Virginia elementary schools, and in a comparison group at New York state elementary schools. The comparison group was selected based upon rural location and popula-tion demographics similar to those of the intervenpopula-tion group, as well as age of school facility. The comparison group school facilities were conventional decades-old buildings, similar to the baseline school in the intervention group. The comparison group for this study was part of a control group in a separate study of impacts of school garden installation on PA [16].
In addition, an independent sample of students in the new Virginia elementary school, grade-matched to intervention group students measured at baseline, was included at post-intervention to assess the role of other potential confounding effects in outcome changes over time (Fig 1).
Setting and participants
The intervention and comparison populations both resided in Eastern U.S. rural areas with weather conditions allowing outdoor activities during the periods of data collection. At Buck-ingham County Elementary School, near the town of Dillwyn, VA, 74% of students in the total student population were eligible for the free and reduced price meal (FRPM) program. In the village of Newark, Wayne County, NY, 56% of students were FRPM-eligible at the Kelley Ele-mentary School. In the village of Margaretville, Delaware County, New York, 55% of students were FRPM-eligible at the Margaretville Central School. Both intervention and comparison
Fig 1. Research design and flowchart of participants.
schools included notable proportions of minority students (45%, 23%, and 26% of the total school populations above, respectively).
In May 2012, Virginia intervention group data were collected from one arbitrarily selected 3rdgrade classroom at Dillwyn Elementary School, which was subsequently closed at the end of the school year. These children moved to the newly designed Buckingham County Elemen-tary School in September 2012. In October 2013, approximately 14 months post-occupancy, data were collected from the same children in three 5thgrade Buckingham County Elementary School classrooms. Comparison group data were collected in Wayne and Delaware counties in New York State, first in October and November 2011 in 4thgrade classrooms, and again from the same children in May 2013 in 5thgrade classrooms at the same schools. These schools did not undergo any renovations during the study time period. Data were also collected in October 2013 from an independent sample of Virginia 3rdgraders, in an arbitrarily selected classroom in the new school (Fig 1).
Environmental intervention
The Virginia baseline data collection occurred at the aging Dillwyn Elementary School, which lacked a gymnasium or other indoor PA-dedicated areas. The facility, a single story structure of 25,246 gross square feet (GSF), was insufficiently sized to accommodate the student popula-tion, and trailers supplemented classroom space. The new Carter G. Woodson Education Complex, containing the Buckingham County Elementary School, a two-story structure of 134,015 GSF, was more than 5 times larger and encompassed complete renovation of two pre-viously vacant facilities as well as new construction. Given the shared interest of the architects and school leadership in the opportunity to create a health-promoting school, the architects engaged with public health researchers to design and implement an evaluation in conjunction with the architectural project. We have discussed the challenges and benefits of this inter-disci-plinary collaboration elsewhere [14,21]. Design decisions for the new facility drew upon the
Physical Activity Design Guidelines for School Architecture[14]. Outdoor classrooms, gardens, nature trails, and other landscape amenities were designed to provide active learning opportu-nities. The facility also included gymnasia, playgrounds, and two large sports fields. The cen-tral locations of shared areas such as the Dining Commons and Music and Art Studios were intended to promote walking during the school day. In order to support desirable SB accumu-lation patterns, classrooms were amply sized to include activity areas and to afford space for movement during class time, with an average of 810 square feet per classroom, or nearly 34 square feet per student. Classroom spaces were outfitted with mobile and dynamic furniture, including height-adjustable chairs that tip, rock, and accommodate forward- or backward-fac-ing sittbackward-fac-ing positions, sit-to-stand mobile and surface angle adjustable tables for all students. In addition, a mobile screen, stools (footrest and seating, including “wiggle” stools with rounded bottoms), soft seating, and beanbags were made available in each classroom. Specification of dynamic furniture was intended to facilitate children’s natural inclinations to fidget, and to discourage bouts of static sitting. Mobile furnishing afforded many options in classroom layout and group configurations. Further details and illustrations of the intervention school design have previously been published [14].
Accelerometry procedures and data processing
data processing conformed to accepted standards [23], and used ActiLife v.6.11.7 software (ActiGraph Corporation, Pensacola, FL). At each data collection time point, Virginia children wore accelerometers for 5–7 consecutive days including school and home time, and New York children for 3 consecutive days during school time. In this study, all data were filtered for school days and times only, and the valid day definition was set to this pre-set length of the school day for each location. Thus school wear time differed by school, but was consistent across all students within a school. A valid day was defined specifically as the total daily possi-ble wear time of 420 minutes in Buckingham County, VA, 300 minutes in Delaware County, NY, and 360 minutes in Wayne County, NY. Non-wear time definition was 30 consecutive minutes of zero activity counts, and minimum number of valid wear days was three. No non-wear time was identified in the data sets. The non-wear time variable was included in statistical models, but was non-significant. Evenson et al. (2008) cut points defined SB, and light, moder-ate, and vigorous activity categories as 0–100 counts per minute (CPM), 101–2295 CPM, 2296–4011 CPM, and 4012+ CPM respectively [24,25]. Minimum length of a sedentary bout was 1 minute. Sixty-second epochs were used in processing the accelerometer data.
Measures
Mean outcome measures from ActiLife-scored accelerometry data were as follows: number of daily sedentary bouts, average length of sedentary bout (natural log-transformed), number of daily breaks from SB, minutes of SB per day, minutes of LPA per day, and minutes of MVPA per school day. We also performed calculations of metabolic equivalent of task minutes (MET-mins) using the midpoint of 2.25 METS (range of 1.5 to 3.0) for LPA, and the midpoint of 6.0 METS (range of 3.0 to 9.0) for MVPA.
Statistical analysis
Adequate distributional normality of variables or their natural log-transformed values were confirmed with absolute values of skewness and kurtosis<1. Initial paired-sample t-tests, and then linear mixed models controlling for gender and a binary race/ethnicity variable (minority or white/non-Hispanic), were run to assess within-subject changes in outcomes over time for the intervention and comparison groups separately. Then, difference-in-difference (DD) anal-yses were conducted to examine net effect of the environmental intervention on SB and PA. The DD method is commonly used in natural experiments to compare change in the outcome in the intervention versus comparison group, under the assumption that the differences between groups would have remained constant under no treatment [26]. Thus, linear mixed models were used to estimate the effect of the intervention by examining the interaction term of time (baseline, follow-up) and group (intervention, comparison), controlling for gender, race/ethnicity, and wear time. In addition, for other outcomes, time in MVPA was included in models to estimate effect sizes that were independent of MVPA.
To assess other potential confounding effects, linear models were used to estimate differ-ences in outcomes between the independent samples of grade-matched students in the old/ baseline and new/intervention Virginia schools, controlling for gender, race/ethnicity, and time in MVPA.
Statistical analyses were conducted with SAS v.9.4 software (SAS Institute, Cary, NC).
Human subjects review
the New York State student samples, the Cornell University IRB deemed the school-time-only protocol exempt, and did not require parental consent or student assent [16].
Results
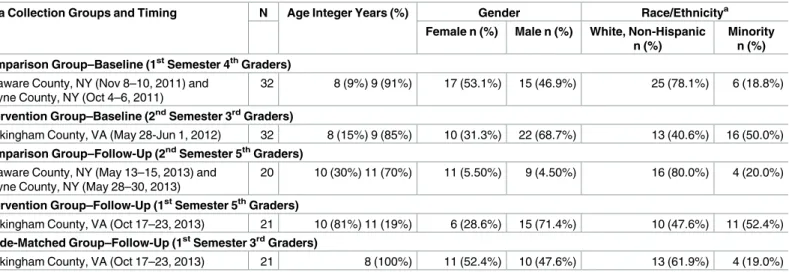
There was similar loss to follow-up in the intervention and comparison groups (baseline/fol-low-up intervention group N = 32/21; comparison group N = 32/20), due primarily to stu-dents’ moves to other communities. The Virginia intervention group included a higher proportion of males (70%) versus females, while the New York state comparison group was more gender-balanced (45% male). Age ranges were similar between the two groups, with a one semester offset in data collection timing and same follow-up interval timing. Samples were 52% minority in Virginia, and 10% minority in New York, due to classroom proportions vary-ing from those of the school populations. The independent sample of Virginia 3rdgraders in the new school (n = 21) was balanced by gender (48% male), and had 20% minority represen-tation (Table 1).
School-time sedentary behavior
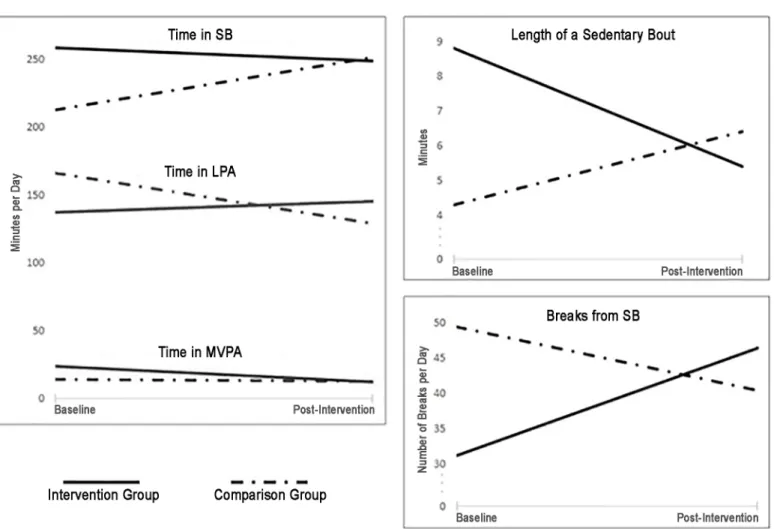
In all groups at both baseline and follow-up, mean sedentary time represented more than half (50.7%-63.1%) of the school day. At baseline, the Virginia intervention group had higher time in SB than the New York state comparison group. Post-intervention, the intervention group had similar or lower SB measures versus the comparison group (Fig 2). Separate linear mixed models for each group indicated that change in SB time in the intervention group was non-sig-nificant (-13.3±9.0 minutes/day,p= 0.154), and that SB time increased in the comparison group (46.7±8.4 minutes/day,p<0.001) as expected with age.
Accounting for the baseline between-group difference, DD analyses estimated the interven-tion’s net effects to decrease SB time by 81.2±11.4 minutes/day (p<0.001), to decrease average length of a sedentary bout (estimate based on log-transformed variable,p<0.001), and to increase daily number of breaks in SB by 23.4±2.6 (p<0.001) (Table 2), all controlling for
Table 1. Sample demographics.
Data Collection Groups and Timing N Age Integer Years (%) Gender Race/Ethnicitya
Female n (%) Male n (%) White, Non-Hispanic n (%)
Minority n (%) Comparison Group–Baseline (1stSemester 4thGraders)
Delaware County, NY (Nov 8–10, 2011) and Wayne County, NY (Oct 4–6, 2011)
32 8 (9%) 9 (91%) 17 (53.1%) 15 (46.9%) 25 (78.1%) 6 (18.8%)
Intervention Group–Baseline (2ndSemester 3rdGraders)
Buckingham County, VA (May 28-Jun 1, 2012) 32 8 (15%) 9 (85%) 10 (31.3%) 22 (68.7%) 13 (40.6%) 16 (50.0%)
Comparison Group–Follow-Up (2ndSemester 5thGraders)
Delaware County, NY (May 13–15, 2013) and Wayne County, NY (May 28–30, 2013)
20 10 (30%) 11 (70%) 11 (5.50%) 9 (4.50%) 16 (80.0%) 4 (20.0%)
Intervention Group–Follow-Up (1stSemester 5thGraders)
Buckingham County, VA (Oct 17–23, 2013) 21 10 (81%) 11 (19%) 6 (28.6%) 15 (71.4%) 10 (47.6%) 11 (52.4%)
Grade-Matched Group–Follow-Up (1stSemester 3rdGraders)
Buckingham County, VA (Oct 17–23, 2013) 21 8 (100%) 11 (52.4%) 10 (47.6%) 13 (61.9%) 4 (19.0%)
aBlack/African-American, Hispanic/Latino, and Other/Mixed Race were combined into one Minority category for analysis. The Intervention group was 47.6% Black/African-American and 4.8% Hispanic/Latino. The Comparison group was 10.0% Black/African-American and 10.0% Hispanic/Latino. Some race/ethnicity data was not reported.
wear time and time in MVPA. Subsequent analyses including interaction terms of MVPA with group (intervention, comparison) and time (baseline, follow-up) found that change in MVPA did not explain changes in these sedentary pattern variables.
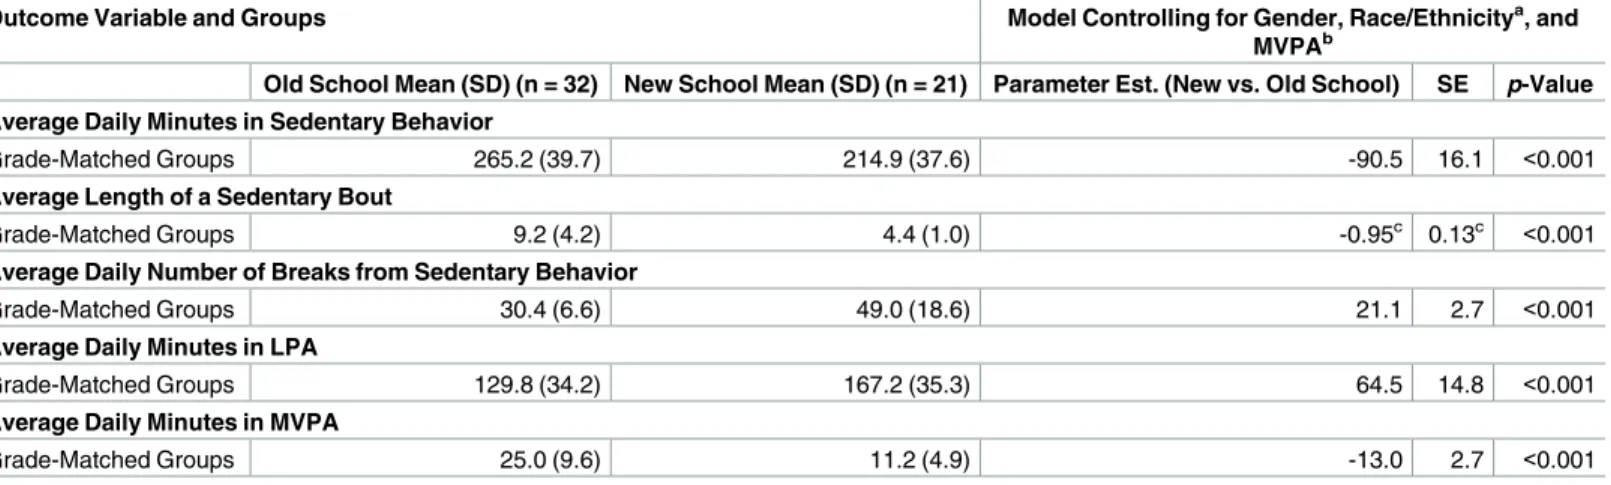
Third graders in the new Virginia school spent, on average, 90.5±16.1 minutes less daily time in SB than their same-grade counterparts in the old school environment (p<0.001), and had shorter sedentary bouts (estimate based on log-transformed variable,p<0.001) and 21.1±2.7 more daily breaks in SB (p<0.001) (Table 3), controlling for time in MVPA.
School-time physical activity
At baseline, the intervention group spent less daily time in LPA and more time in MVPA than the comparison group. Post-intervention, the intervention group spent more daily time in LPA, and similar time in MVPA versus the comparison group (Fig 2). Separate linear mixed models estimated change in LPA time as non-significant in the intervention group (14.1±9.2 minutes/day,p= 0.138), and showed a decrease in comparison group LPA time (-36.5±7.9 minutes/day,p<0.001).
Accounting for between-group baseline differences, DD analyses estimated net effects of the intervention to increase time in LPA by 67.7±10.7 minutes/day (p<0.001), controlling for daily wear time and time in MVPA, and to decrease time in MVPA by 10.3±2.3 minutes/day
Fig 2. Baseline and post-intervention outcomes of intervention and comparison groups.
Table 2. Difference-in-difference (DD) estimates of the impact of school architecture intervention effects on sedentary behavior and physical activity.
Outcome Variable Model Controlling for Gender, Race/Ethnicitya, and Time in MVPAb
Parameter Estimate SE p-Value
Daily Minutes in Sedentary Behavior
Group (Ref: Comparison) 142.4 15.1 <0.001
Time (Ref: Baseline) 27.7 7.4 <0.001
Group*Time (DD effect) -81.2 11.4 <0.001
Average Length of a Sedentary Bout
Group (Ref: Comparison) 1.02c 0.15c <0.001
Time (Ref: Baseline) 0.35c 0.07c <0.001
Group*Time (DD effect) -1.08c 0.11c <0.001
Average Daily Number of Breaks from Sedentary Behavior
Group (Ref: Comparison) -9.5 3.5 0.008
Time (Ref: Baseline) -6.2 1.7 0.006
Group*Time (DD effect) 23.4 2.6 <0.001
Average Daily Minutes in LPA
Group (Ref: Comparison) -39.2 14.5 0.009
Time (Ref: Baseline) -27.6 7.0 0.002
Group*Time (DD effect) 67.7 10.7 <0.001
Average Daily Minutes in MVPA
Group (Ref: Comparison) 10.9 3.6 0.004
Time (Ref: Baseline) -2.3 1.6 0.224
Group*Time (DD effect) -10.3 2.3 <0.001
a
Race/ethnicity a dichotomous variable with values White/Non-Hispanic or Minority. b
Estimates and p-values from linear mixed models of outcomes with time (baseline, follow-up), controlling for differences in accelerometer in-school wear time, gender, race/ethnicity, and time in MVPA for other outcomes.
c
Based on natural log transformed variable values.
https://doi.org/10.1371/journal.pone.0189236.t002
Table 3. Grade-matched independent samples differences in sedentary behavior and physical activity.
Outcome Variable and Groups Model Controlling for Gender, Race/Ethnicitya, and
MVPAb
Old School Mean (SD) (n = 32) New School Mean (SD) (n = 21) Parameter Est. (New vs. Old School) SE p-Value Average Daily Minutes in Sedentary Behavior
Grade-Matched Groups 265.2 (39.7) 214.9 (37.6) -90.5 16.1 <0.001
Average Length of a Sedentary Bout
Grade-Matched Groups 9.2 (4.2) 4.4 (1.0) -0.95c 0.13c <0.001
Average Daily Number of Breaks from Sedentary Behavior
Grade-Matched Groups 30.4 (6.6) 49.0 (18.6) 21.1 2.7 <0.001
Average Daily Minutes in LPA
Grade-Matched Groups 129.8 (34.2) 167.2 (35.3) 64.5 14.8 <0.001
Average Daily Minutes in MVPA
Grade-Matched Groups 25.0 (9.6) 11.2 (4.9) -13.0 2.7 <0.001
a
Race/ethnicity a dichotomous variable with values White/Non-Hispanic or Minority. b
Estimates and p-values from linear models of outcomes with group, gender, race/ethnicity, and time in MVPA for other outcomes. c
Based on natural log transformed variable values.
(p<0.001) (Table 2), controlling for daily wear time. This additional 67.7 minutes of LPA equated to 152.3 metabolic equivalent of task minutes (MET-min), more than offsetting the reduction in MVPA of 10.3 minutes or 61.8 MET-min.
The 3rd-grade independent sample in the new school spent on average 64.5±14.8 more daily minutes in LPA (p<0.001), controlling for time in MVPA, and 13.0±2.7 fewer daily minutes in MVPA, compared to their same-grade counterparts in the old school (p<0.001) (Table 3).
Discussion
This pilot natural experiment with a holistic movement-oriented school built environmental intervention used both longitudinal within-subject and grade-matched independent samples analyses to evaluate intervention effects on students’ SB and PA during school time. The study contributes to a limited body of evidence about the impact of the school built environment on students’ SB and PA, with a research design that facilitates a degree of reasonable causal infer-ence. Results confirmed previous research findings that, on average, children spend a majority of the school day sedentary. DD analyses revealed that the intervention prevented expected maturational SB increases and LPA decreases, and same-grade samples analysis showed improved SB accumulation patterns and higher LPA time in the new school environment. Contrary to expectations, however, the intervention decreased daily time in MVPA, although overall MET-mins increased. Analyses also showed that changes in time in MVPA did not explain changes in SB patterns.
Much of the evidence pertaining to children’s PA, weight status and cardio-metabolic health has focused on moderate-to-vigorous physical activity (MVPA), given its well-docu-mented associations with health indicators, and the U.S. recommendation that children spend at least 60 minutes per day in MVPA [27–29]. Numerous studies have also addressed impacts of sedentary behavior (SB) on children’s health, but its influence, independent of MVPA, has not been fully resolved. While one systematic review concluded that reductions in SB corre-lated to lower health risk in 5–17 year-old youth [30], a meta-analysis of pooled youth accel-erometry data concluded that MVPA was associated with better cardio-metabolic risk factors regardless of time in SB [31]. Other subsequent reviews called for more quality evidence to document MVPA-independent associations of patterns and volumes of child and adolescent SB with health indicators [32], and concluded that evidence for a causal relationship between SB and biomedical and mental health was generally unconvincing due to inconsistent or null findings [33,34]. Therefore, the clinical relevance of changes in SB found in this study remains unclear.
Classrooms, where students typically spend the most time, can be considered as one level of environmental intervention. The intervention effects of reducing time in SB and increasing frequency of transition between SB and higher intensity activity could be related to classroom design that provided dynamic furniture, ample space for activity areas and moving around the classroom, and potential to stand while working, supporting classroom-based findings from previous studies [20]. Anecdotally, the researchers were told that many intervention school teachers designed interactive curricula and activities made possible by the new classroom design and flexible and mobile furnishings, which may have worked in synergy with built envi-ronment features to improve SB outcomes.
Results may have been influenced by school-level changes, and specifically the larger size of the new school building and campus. Research has documented positive school and campus size and PA associations in slightly older students [35]. However, many teachers in the inter-vention school expressed dissatisfaction with long walking distances and time required to reach daily destinations such as recess areas. At a pace required to keep young children together, such walking could have contributed to time in LPA. However, time spent walking may have unintentionally cut into scheduled times for higher-intensity activities. Smaller, more dispersed, high-intensity activity areas may be a worthwhile school design opportunity.
It has been established that children across age groups are more physically active outdoors versus indoors [36–38]. Therefore, school design should consider quick outdoor access to pro-mote moderate-to-vigorous intensity activities that are prohibited in most areas of the school interior. Given baseline MVPA measures, it is possible that the Virginia sample was unusually active compared to the school population mean at that time. The baseline classroom was in a temporary trailer on the school site that provided very quick access to outdoor and recess areas. In the new school, the classroom-to-playground route was more than twice as long and mostly inside. Given a school policy of ‘speeding tickets’ for running in the building, these dif-ferences in distances could have impacted both LPA and MVPA.
This study has several limitations that should be considered. Although sample sizes were small, they did provide adequate statistical power to detect highly significant within-subject changes and between-group differences. Results may not necessarily generalize to dissimilar populations, and cross-study comparisons should take into account this study’s methodologi-cal choices, such as school-time only outcome measures and 60-second epoch length. These data and analyses provided no inferences about potential impacts on SB or PA outside of school time, and it is possible that MVPA was underestimated due to intensity averaging across 60-second epochs [39]. Although this epoch length has been common in the literature, there has been a recent trend toward use of shorter epoch lengths in children to better capture short spikes of high-intensity activity [23,40]. In addition, body mass index (BMI) data were not made available, and therefore were not included in statistical models. Actual time spent in recess and PE was also not measured, and specific details of adherence to these and other pro-grammatic interventions may be important to include in future studies. As the intervention was a holistic school built environmental change, it was not possible to analyze individual effects of particular environmental variables quantitatively. A further limitation of the study is that, without randomization, regression to the mean cannot be entirely ruled out as a potential concern. However, several outcomes clearly and consistently changed from less to more favor-able in the intervention vs. comparison group, mitigating concern about trend toward the mean. In addition, results were consistent in the grade-matched independent samples compar-ison. Interventions in the built environment are difficult to randomize, and a strength of this study was the use of a similar comparison group, with additional same-grade independent samples analyses to identify potential threats to internal validity.
Conclusion
more representative samples, and employ school/cluster randomization to produce stronger causal evidence. Such studies may also evaluate impacts of coordinated built environment and programmatic interventions intended to maximize use of active school environmental affor-dances in child and youth populations.
Supporting information
S1 File. SAS dataset contents.
(DOCX)
S2 File. SAS dataset.
(SAS7BDAT)
Acknowledgments
The authors sincerely thank the administrators, teachers, staff, students, and parents at the following schools for their support and participation in this research: Buckingham County Elementary School, Carter G. Woodson Education Complex, Buckingham County, Virginia; Margaretville Central School, Delaware County, New York; and Kelley School, Wayne County, New York. Thanks also go to Mohammad Siahpush, PhD and Kendra Schmid, PhD for input on data analyses, and to Debra Romberger, MD for helpful feedback on manu-script drafts.
Author Contributions
Conceptualization: Jeri Brittin, Leah Frerichs, John R. Sirard, Nancy M. Wells, Beth M.
Myers, Jeanette Garcia, Dina Sorensen, Matthew J. Trowbridge, Terry Huang.
Data curation: Jeri Brittin, Leah Frerichs, John R. Sirard, Nancy M. Wells, Beth M. Myers,
Jeanette Garcia.
Formal analysis: Jeri Brittin, Leah Frerichs, John R. Sirard, Jeanette Garcia.
Funding acquisition: Nancy M. Wells, Matthew J. Trowbridge, Terry Huang.
Investigation: Jeri Brittin, Leah Frerichs, John R. Sirard, Nancy M. Wells, Beth M. Myers,
Jeanette Garcia.
Methodology: Jeri Brittin, Leah Frerichs, John R. Sirard, Nancy M. Wells, Matthew J.
Trow-bridge, Terry Huang.
Project administration: Jeri Brittin, Leah Frerichs, Nancy M. Wells, Beth M. Myers, Dina
Sor-ensen, Terry Huang.
Resources: Nancy M. Wells, Matthew J. Trowbridge, Terry Huang.
Supervision: Nancy M. Wells, Terry Huang.
Validation: Jeri Brittin, Leah Frerichs, Jeanette Garcia, Terry Huang.
Visualization: Jeri Brittin, Leah Frerichs.
Writing – original draft: Jeri Brittin.
Writing – review & editing: Jeri Brittin, Leah Frerichs, John R. Sirard, Nancy M. Wells, Beth
References
1. Institute of Medicine (US). Committee on Physical Activity and Physical Education in the School Envi-ronment. Educating the Student Body: Taking Physical Activity and Physical Education to School. Washington, DC: National Academies Press; 2013.
2. Carlson JA, Engelberg JK, Cain KL, Conway TL, Mignano AM, Bonilla EA, et al. Implementing class-room physical activity breaks: Associations with student physical activity and classclass-room behavior. Prev Med 2015; 81:67–72.https://doi.org/10.1016/j.ypmed.2015.08.006PMID:26297105
3. Tomporowski PD, Lambourne K, Okumura MS. Physical activity interventions and children’s mental function: an introduction and overview. Prev Med 2011; 52:S3–S9.https://doi.org/10.1016/j.ypmed. 2011.01.028PMID:21420981
4. Allison KR, Adlaf EM, Dwyer JJ, Lysy DC, Irving HM. The decline in physical activity among adolescent students: A cross-national comparison. Canadian Journal of Public Health/Revue Canadienne de San-te’e Publique 2007:97–100.
5. Basterfield L, Adamson AJ, Frary JK, Parkinson KN, Pearce MS, Reilly JJ, et al. Longitudinal study of physical activity and sedentary behavior in children. Pediatrics 2011; 127(1):e24–30.https://doi.org/10. 1542/peds.2010-1935PMID:21173005
6. Francis SL, Morrissey JL, Letuchy EM, Levy SM, Janz KF. Ten-year objective physical activity tracking: Iowa Bone Development Study. Med Sci Sports Exerc 2013; 45(8):1508–1514.https://doi.org/10.1249/ MSS.0b013e31828b2f3aPMID:23470296
7. Hallal PC, Andersen LB, Bull FC, Guthold R, Haskell W, Ekelund U, et al. Global physical activity levels: Surveillance progress, pitfalls, and prospects. Lancet 2012; 380(9838):247–257.https://doi.org/10. 1016/S0140-6736(12)60646-1PMID:22818937
8. Nader PR, Bradley RH, Houts RM, McRitchie SL, O’Brien M. Moderate-to-vigorous physical activity from ages 9 to 15 years. JAMA 2008; 300(3):295–305.https://doi.org/10.1001/jama.300.3.295PMID:
18632544
9. Pindus DM, Cumming SP, Sherar LB, Gammon C, e Silva MC, Malina RM. Maturity-associated varia-tion in physical activity and health-related quality of life in British adolescent girls: Moderating effects of peer acceptance. Int J Behav Med 2014; 21(5):757–766. PMID:25356455
10. Trost SG, Pate RR, Sallis JF, Freedson PS, Taylor WC, Dowda M, et al. Age and gender differences in objectively measured physical activity in youth. Med Sci Sports Exerc 2002; 34(2):350–355. PMID:
11828247
11. Troiano RP, Berrigan D, Dodd KW, Maˆsse LC, Tilert T, McDowell M. Physical activity in the United States measured by accelerometer. Med Sci Sports Exerc 2008; 40(1):181.https://doi.org/10.1249/ mss.0b013e31815a51b3PMID:18091006
12. Nettlefold L, McKay HA, Warburton DE, McGuire KA, Bredin SS, Naylor PJ. The challenge of low physi-cal activity during the school day: At recess, lunch and in physiphysi-cal education. Br J Sports Med 2011 Aug; 45(10):813–819.https://doi.org/10.1136/bjsm.2009.068072PMID:20215489
13. Institute of Medicine (US). Committee on Accelerating Progress in Obesity Prevention, Glickman D. Accelerating Progress in Obesity Prevention: Solving the Weight of the Nation. Washington, DC: National Academies Press; 2012.
14. Brittin J, Sorensen D, Trowbridge M, Lee KK, Breithecker D, Frerichs L, et al. Physical activity design guidelines for school architecture. PLoS One 2015; 10(7):e0132597.https://doi.org/10.1371/journal. pone.0132597PMID:26230850
15. Ridgers ND, Salmon J, Parrish A, Stanley RM, Okely AD. Physical activity during school recess: A sys-tematic review. Am J Prev Med 2012; 43(3):320–328.https://doi.org/10.1016/j.amepre.2012.05.019
PMID:22898126
16. Wells NM, Myers BM, Henderson CR. School gardens and physical activity: A randomized controlled trial of low-income elementary schools. Prev Med 2014; 69:S27–S33.https://doi.org/10.1016/j.ypmed. 2014.10.012PMID:25456803
17. Stratton G, Mullan E. The effect of multicolor playground markings on children’s physical activity level during recess. Prev Med 2005; 41(5–6):828–833.https://doi.org/10.1016/j.ypmed.2005.07.009PMID:
16137756
18. Toftager M, Christiansen LB, Ersbøll AK, Kristensen PL, Due P, Troelsen J. Intervention effects on ado-lescent physical activity in the multicomponent SPACE study: A cluster randomized controlled trial. PLoS One 2014; 9(6):e99369.https://doi.org/10.1371/journal.pone.0099369PMID:24921948 19. Hamer M, Aggio D, Knock G, Kipps C, Shankar A, Smith L. Effect of major school playground
20. Hinckson E, Salmon J, Benden M, Clemes SA, Sudholz B, Barber SE, et al. Standing classrooms: research and lessons learned from around the world. Sports Med 2016; 46(7):977–987.https://doi.org/ 10.1007/s40279-015-0436-2PMID:26626071
21. Huang TT, Sorensen D, Davis S, Frerichs L, Brittin J, Celentano J, et al. Healthy eating design guide-lines for school architecture. Preventing Chronic Disease 2013; 10.
22. Robusto KM, Trost SG. Comparison of three generations of ActiGraph activity monitors in children and adolescents. J Sports Sci 2012; 30(13):1429–1435.https://doi.org/10.1080/02640414.2012.710761
PMID:22857599
23. Cain KL, Sallis JF, Conway TL, Van Dyck D, Calhoon L. Using accelerometers in youth physical activity studies: A review of methods. J Phys Act Health 2013; 10(3).
24. Evenson KR, Catellier DJ, Gill K, Ondrak KS, McMurray RG. Calibration of two objective measures of physical activity for children. J Sports Sci 2008; 26(14):1557–1565.https://doi.org/10.1080/
02640410802334196PMID:18949660
25. Trost SG, Loprinzi PD, Moore R, Pfeiffer KA. Comparison of accelerometer cut points for predicting activity intensity in youth. Med Sci Sports Exerc 2011 Jul; 43(7):1360–1368.https://doi.org/10.1249/ MSS.0b013e318206476ePMID:21131873
26. Meyer BD. Natural and quasi-experiments in economics. J Bus Econ Stat 1995; 13(2):151–161.
27. Physical Activity Guidelines Advisory Committee. Physical Activity Guidelines Advisory Committee Report, 2008. Washington, DC: US Department of Health and Human Services 2008;A1–H14.
28. Anderson PM, Butcher KF. Childhood Obesity: Trends and Potential Causes. The Future of Children 2006; 16(1):19–45. PMID:16532657
29. Kwon S, Burns TL, Levy SM, Janz KF. Which contributes more to childhood adiposity-high levels of sedentarism or low levels of moderate-through-vigorous physical activity? The Iowa Bone Development Study. J Pediatr 2013; 162(6):1169–1174.https://doi.org/10.1016/j.jpeds.2012.11.071PMID:
23305957
30. Tremblay MS, LeBlanc AG, Kho ME, Saunders TJ, Larouche R, Colley RC, et al. Systematic review of sedentary behaviour and health indicators in school-aged children and youth. Int J Behav Nutr Phys Act 2011; 8(1):98.
31. Ekelund U, Luan J, Sherar LB, Esliger DW, Griew P, Cooper A, et al. Moderate to vigorous physical activity and sedentary time and cardiometabolic risk factors in children and adolescents. JAMA 2012; 307(7):704–712.https://doi.org/10.1001/jama.2012.156PMID:22337681
32. Cliff DP, Hesketh K, Vella SA, Hinkley T, Tsiros MD, Ridgers ND, et al. Objectively measured sedentary behaviour and health and development in children and adolescents: Systematic review and meta analy-sis. Obesity Reviews 2016; 17(4):330–344.https://doi.org/10.1111/obr.12371PMID:26914664 33. Ekris E, Altenburg T, Singh A, Proper K, Heymans M, Chinapaw M. An evidence update on the
prospec-tive relationship between childhood sedentary behaviour and biomedical health indicators: a systematic review and meta analysis. Obesity Reviews 2016; 17(9):833–849.https://doi.org/10.1111/obr.12426
PMID:27256486
34. Suchert V, Hanewinkel R, Isensee B. Sedentary behavior and indicators of mental health in school-aged children and adolescents: A systematic review. Prev Med 2015; 76:48–57.https://doi.org/10. 1016/j.ypmed.2015.03.026PMID:25895839
35. Cradock AL, Melly SJ, Allen JG, Morris JS, Gortmaker SL. Characteristics of school campuses and physical activity among youth. Am J Prev Med 2007 08; 33(2):106–113.https://doi.org/10.1016/j. amepre.2007.04.009PMID:17673097
36. Baranowski T, Thompson WO, Durant RH, Baranowski J, Puhl J. Observations on physical activity in physical locations: Age, gender, rthnicity, and month effects. Res Q Exerc Sport 1993; 64(2):127–133.
https://doi.org/10.1080/02701367.1993.10608789PMID:8341835
37. Skala KA, Springer AE, Sharma SV, Hoelscher DM, Kelder SH. Environmental characteristics and stu-dent physical activity in PE class: Findings from two large urban areas of Texas. J Phys Act Health 2012 05; 9(4):481–491. PMID:21934165
38. Klesges RC, Eck LH, Hanson CL, Haddock CK, Klesges LM. Effects of obesity, social interactions, and physical environment on physical activity in preschoolers. Health Psychol 1990; 9(4):435–449. PMID:
2373068
39. Aibar A, Chanal J. Physical Education: The effect of epoch lengths on children’s physical activity in a structured context. PLoS One 2015 Apr 13; 10(4):e0121238.https://doi.org/10.1371/journal.pone. 0121238PMID:25874641