THE EFFECT OF A TWO-WEEK LOWER BODY RESISTANCE TRAINING PROTOCOL ON AEROBIC CAPACITY (VO2PEAK) IN SEDENTARY MIDDLE-AGED FEMALES
Chad William Wagoner
A thesis submitted to the faculty of the University of North Carolina at Chapel Hill in partial fulfillment of the requirement for the degree of Master of Arts in the Department of Exercise and
Sport Science (Exercise Physiology).
Chapel Hill 2016
Approved by:
Claudio L. Battaglini
Erik D. Hanson
© 2016
ABSTRACT
Chad William Wagoner: The Effect of a Two-Week Lower Body Resistance Training Protocol on Aerobic Capacity (VO2peak) in Sedentary Middle-Aged Females
(Under the direction of Claudio L. Battaglini)
ACKNOWLEDGEMENTS
TABLE OF CONTENTS
LIST OF TABLES ...VIII LIST OF FIGURES ...IX LIST OF ABBREVIATIONS ...X Chapter
I. INTRODUCTION ...1
Purpose Statement ...4
Research questions ...5
Hypotheses ...5
Operational Definitions ...6
Delimitations ...7
Assumptions ...7
Limitations ...8
Significance of study ...8
II. REVIEW OF LITERATURE ...10
Physiological effects of aging, disuse, and disease on skeletal muscle ...10
Skeletal muscle and functional capabilities; effects of resistance training ....18
Skeletal muscle and aerobic capacity; effects of resistance training ...22
Overview of neuromuscular physiology ...26
Subjects ...34
Instrumentation ...36
Procedures ...37
Data Analysis ...44
IV. RESULTS ...45
Subjects ...45
Training Effects ...46
Relationship Between VO2peak and Muscular Strength/Activation ...47
Exploratory Analyses ...49
V. DISCUSSION ...51
Overview ...51
Cardiopulmonary Capacity ...52
Muscle Strength, Activation, and Size ...56
Relationships between VO2peak and Peak Torque / Activation ...59
Exploratory Analyses ...61
Conclusions ...63
Future Research ...64
APPENDIX 3.1 STUDY BROCHURE: ...65
APPENDIX 3.2: PRE-ASSESSMENT GUIDELINES ...66
APPENDIX 3.3: PHYSICAL ACTIVITY READINESS QUESTIONNAIRE ...67
APPENDIX 3.4: MEDICAL HISTORY QUESTIONNAIRE ...68
APPENDIX 3.5: DATA COLLECTION SHEET ...72
LIST OF TABLES
LIST OF FIGURES
Figure 1 (Study Timeline) ...35
Figure 2 (VO2peak Changes v. Changes in VL Torque Relationship) ...48
Figure 3 (VO2peak Changesv. Changes in EMG Amplitude Relationship) ...48
Figure 4 (VO2peak Change / VO2 @ VT Change Association) ...50
Figure 5 (Post Weight / VO2peak Correlation) ...50
LIST OF ABBREVIATIONS 1-RM One Repetition Maximum
BM Body Mass
BP Blood Pressure
cm Centimeter
CPET Cardiopulmonary Exercise Test CSA Cross-Sectional Area
EKG Electrocardiogram EMG Electromyography
HR Heart Rate
kg Kilogram
PAR-Q Physical Activity Readiness Questionnaire
PT Peak Torque
RPE Rate of Preceived Exertion
US Ultrasonography
Ve Minute Ventilation VL Vastus Lateralis VT Ventilatory Threshold
CHAPTER 1
INTRODUCTION
Sarcopenia can be defined as the loss of skeletal muscle as a result of the aging process (Roubenoff & Hughes, 2000). Studies have shown that a decrease in skeletal muscle mass can occur as early as 30 years old with the greatest decline be observed between the ages of 50 to 69 years old (Frontera, Hughes, Lutz, & Evans, 1991). It is well documented within the literature that muscle mass and strength continue to decline as individuals continue to age (W. J. Evans & Campbell, 1993). However, sarcopenia has been shown to be accelerated not only by aging, but also by sedentary lifestyles and disease (W. J. Evans, 2010). Specifically, it has been established that those whom do not participate in physical activity on regular basis have less skeletal muscle mass (W. J. Evans, 1995) and are more susceptible to decreased functional capabilities
(Roubenoff & Hughes, 2000). Those who are diagnosed with illnesses, such as cancer, often suffer from “cachexia” (Fox, Brooks, Gandra, Markus, & Chiou, 2009), which is “a complex metabolic syndrome associated with underlying illness and characterized by loss of muscle with or without loss of fat mass” (W. J. Evans et al., 2008). Similar to inactivity, cachexia is
considered an underlying contributor to sarcopenia (Rolland, Abellan van Kan, Gillette-Guyonnet, & Vellas, 2011).
improved functional ability as shown by reduced rate of perceived exertion (RPE) during post-intervention testing of functional tasks (Hartman, Fields, Byrne, & Hunter, 2007) and faster times in a 5-Chair Stand test (Hanson et al., 2009). Similarly, in order to attenuate the loss of skeletal muscle, physical activity, specifically resistance training, can assist in this process leading to enhanced ease of daily activities and prevention of diseases such as diabetes,
osteoporosis, and obesity (Rogers & Evans, 1993). In addition to its relationship with functional tasks, loss of muscle mass is considered a limiting factor in aerobic capacity, as seen by
significantly lower VO2peak values from cardiopulmonary exercise tests (CPET) (Fleg & Lakatta, 1988). Strong relationships have been reported in terms of the decline in leg strength and leg muscle mass in relation to VO2peak values in sedentary males and females (Neder, Nery, Silva, Andreoni, & Whipp, 1999). With this relationship in mind, recent studies have sought out to determine the mechanism behind it. General consensus shows that the atrophy that occurs with aging, disuse, and disease results in the lower limbs not being able to generate enough force to withstand the resistance of the cycle ergometer (Neder et al., 1999). As a result, the CPET is concluded prematurely, producing a VO2peak value that is not necessarily an accurate
representation of the individual’s peak cardiopulmonary capacity, bringing into question the aerobic exercise intensities that are prescribed based off this value.
Plyley, 1997). Furthermore, post-intervention one-repetition maximum (1-RM) scores from lower body exercises such as leg press, leg curl, and leg extensions have been reported to be strongly correlated with VO2peak scores, displaying a significant relationship between resistance training and aerobic capacity in inactive elderly males and females (Vincent, Braith, Feldman, Kallas, & Lowenthal, 2002). In females alone, robust correlations have been reported when taking leg muscle mass (LMM) into account and comparing it to VO2peak values as aging occurs (Neder et al., 1999). Indeed, the studies elicit a valid relationship between resistance training and its influence on aerobic capacity; However, the length of intervention for these studies fall between as little of eight weeks to as long as six months. They are ultimately examining the influence of physical hypertrophic characteristics of trained skeletal muscle, such as cross-sectional area (CSA) on VO2peak rather than neuromuscular adaptations that has been reported to occur as early as 2 weeks of resistance-training (Moritani & deVries, 1979).
of resistance training increased both 1-RM scores on a leg press exercise as well as maixmal oxygen uptake values in college-aged females (Kim, Dear, Ferguson, Seo, & Bemben, 2011). An important limitation of this study was that maximal oxygen uptake values were estimated based off of submaximal cardiopulmonary testing. With this in mind, we are unaware of any studies that have observed the impact of short-tetm resistance training on changes in aerobic capacity in an older population of sedentary females. As noted by Neder et al. (1999), there is an inability to produce force on a cycle ergometer during a CPET test by sedentary females. In turn, this
premature cessation of a CPET on a cycle ergometer may produce a oxygen uptake value that may not accurately represent their true aerobic capacity due to muscular weakness in the lower
extremities. This also may be the case observed in women with breast cancer due to their low
levels of physical activity during and post treatment, which stimulated the development of this
current study. The results of this study in apparently healthy sedentary women with similar ages
as those women with breast cancer may prove that this reduced muscular capacity impact oxygen
uptake assessment on a cycle ergometer and can potentially be attenuated with short term
resistance training. If proven correct, this attenuation of muscular weakness may implicate more
accurate assessments of cardiopulmonary capacity and thus improving our ability to prescribe
cycling exercise for sedentary more accurately.
Purpose Statement
the relationship between changes in VO2peak and muscular peak torque/activation from baseline to the completion of the two-week resistance training protocol.
Research Questions
RQ1. Will two weeks of lower body resistance training elicit greater VO2peak responses from to pre to post-training in sedentary middle-aged females?
RQ2. Will two weeks of lower body resistance training elicit greater peak torque values of the VL in sedentary middle-aged females post-training?
RQ3. Will two weeks of lower body resistance training elicit greater activation of the VL from pre to post-training?
RQ4. Will two weeks of lower body resistance training greater muscle size of the VL in sedentary middle-aged females?
RQ5. Is there an association between the changes in VO2peak values from pre to post training with the changes in peak torque values from pre to post training?
Hypotheses
H1: Subjects will elicit greater VO2peak values from pre to post-training as a result of the two-week lower body resistance training protocol.
H2: Subjects will elicit significantly greater torque as a result of neuromuscular adaptations in comparison to pre-training values.
H3: Subjects will exhibit greater VL muscle activation in comparison to pre-tests values.
H5: VO2peak and peak torque/EMG amplitude values from pre to post testing will elicit a strong positive relationship.
Operational Definitions
• Sedentary: Classified as not having participated in regularly scheduled exercise more than
once a week for the previous 6 months.
• CSA: The area of the VL that represents the muscle size as determined by cross-sectional
ultrasound scans.
• Familiarization: Session that occurs two days prior to the pre-testing session in order to
familiarize the subjects with protocols being implemented and equipment being used.
• Pre-Training: Events that occur before the resistance training protocol of two-weeks. This
includes the initial screening / familiarization session as well as the second visit (pre-testing session).
• Post-Training: Events that occur at least two days after the two weeks of resistance training
has been completed (i.e., post-testing session).
• VO2peak: A subject’s highest volume of oxygen consumption attained during a graded
cardiopulmonary exercise test (CPET).
• 1-RM: one repetition maximum; exercise used to assess the maximum amount of weight that
can be lifted with proper form one time.
• EMG: Technique used to assess and evaluate the activation of the VL via electrical signals
• Peak Torque: The greatest amount of torque produced during the isokinetic load range in leg
extension muscle action at 60°/second.
• Learning Effect: Phenomenon that occurs after the initial testing session; i.e., subjects know
what to expect the second time and greater changes are observed.
Delimitations
• All subjects will be female between 35-65 years of age.
• All subjects will not have regularly participated in any exercise program for the past 6
months prior to the study, deeming them as sedentary.
• All subjects will be familiarized with facilities, exercises, and testing protocols being used
prior to taking baseline measurements in order to reduce the learning effect.
• All subjects will be recruited from the central North Carolina area via flyer, email, face to
face, and phone call.
• All subjects will be cleared by a physician for exercise participation prior to participating in
the study.
Assumptions
• All subjects will follow the pre-assessment guidelines prior to testing sessions. • All subjects will give their maximal effort during testing sessions.
• Subjects will not participate in any other forms of exercise or diet while participating in the
study.
Limitations
• The results of this study may only apply to those whom are women, sedentary, apparently
healthy and between the ages of 35-65 years old. Results may not be applied to females of all ages and males.
• It is possible that subjects will not adhere to pre-assessment guidelines entirely as researchers
will not be with them during the hours prior to testing.
• Due to the selected age range and gender, menstrual cycle could affect study results in those
whom were pre-menopausal.
Significance of the Study
This study will assist fitness professionals in providing a short-term protocol that will help elicit a more accurate VO2peak response assessed on a cycle ergometer in order to prescribe aerobic exercise of different intensities. No study has ever looked at a resistance training protocol this short while simultaneously testing its relationship on the cardiopulmonary system. Most studies of this nature have looked at the effects of resistance training on aerobic capacity on more of a long term basis, but rather leg muscle mass (LMM), cross sectional area (CSA), and strength values from 1-RM. Further, it is of interest to utilize this protocol, or one of similar nature, in other populations as well, such as breast cancer patients. Despite a paucity of data, a common occurrence during a CPET for most patients undergoing cancer treatment is a cessation of the graded exercise bout due to the inability of the lower limbs to produce enough force to withstand the resistance on the cycle ergometer, rather than truly maxing out their
sedentary females and breast cancer patients are similar in terms of their anthropometric
characteristics and cardiopulmonary capacities. For these reasons, the present study has initially
chosen to pilot this protocol in sedentary females with hopes of continuing to implement in a
CHAPTER II
REVIEW OF LITERATURE
For organizational purposes, Chapter II was divided into the following sections:
SECTION I. Physiological effects of aging, disuse, and disease on skeletal muscle; SECTION II. Skeletal muscle and functional capabilities; effects of resistance training; SECTION III. Skeletal muscle and aerobic capacity; effects of resistance training; SECTION IV. Overview of
neuromuscular physiology; SECTION V. Short-term adaptations to resistance training. Results discussed from the articles within this section have been selected to provide a history and proper rationale for the study at hand.
Physiological effects of aging, disuse, and disease on skeletal muscle Aging
With aging comes the inevitable loss of skeletal muscle mass. It has been estimated that by the age of 65, individuals will have lost up to 25 to 30% of their skeletal muscle mass as a result of the natural aging process, contributing to losses of strength and functional ability (Brooks, Fahey, & Baldwin, 2005). Specifically, Frontera et al. (1991) were able to show
skeletal muscle mass are more prone to become diagnosed with sarcopenia. Sarcopenia can be defined as a loss of muscle mass (degree of muscle impairment) large enough to significantly hinder one’s ability to perform physical and functional tasks (Rolland et al., 2011). It has been hypothesized that both muscle atrophy and hypoplasia, the loss of muscle fibers, play a role in this aging process of losing skeletal muscle (Brooks et al., 2005). Additionally, further
mechanisms that have been reported to contribute to skeletal muscle loss include motor unit remodeling (Doherty, Vandervoort, Taylor, & Brown, 1993) and a dropout of the alpha motor neuron (W. F. Brown, 1972). These concepts, as well as supplementary contributors to the age-related loss of skeletal muscle, will be discussed in detail within this section.
Research as early as 1972 has been conducted in order to formulate a reason as to why individuals lose skeletal muscle mass as a result of aging. W. F. Brown (1972) was one of the first studies to establish that older individuals exhibited a significantly lower amount of motor units for a given muscle when contracted. The explanation for the loss of motor units was not discovered. However, it was apparent that with increasing age, a significant drop in motor units was observed in the thenar muscle for individuals at 60 years of age and above (W. F. Brown, 1972). Other early studies, such as Lexell, Henriksson-Larsen, Winblad, and Sjostrom (1983), set out to provide an explanation for skeletal muscle loss from a different perspective. Specifically, Lexell et al. (1983) chose to examine the vastus lateralis of young and older men with a
skeletal muscle loss was highly associated with the loss of Type II fibers, Lexell et al. (1988) was able to show through cross-sectional analysis that muscle fiber size was poorly associated with muscle cross-sectional area, whereas the numbers of muscle fibers was highly associated. Doherty et al. (1993) was able to take these two theories and ultimately connect them to provide a plausible explanation for the age-associated loss of skeletal muscle. With the use of spike-triggered averaging, Doherty et al. (1993) was able to determine that not only did older
individuals provide a lower value for the estimated number of motor units in the biceps, but they also noticed a remodeling of the alpha motor unit. Essentially, with aging, Type II motor units (alpha I) are reinnervated into forming Type 1 motor units (alpha II), causing Type 1 muscle fibers to continuously become activated and Type II muscle fibers dropping out due to their inactivation (Brooks et al., 2005). Overall, there is a multitude of factors that contribute to the loss of skeletal muscle mass with aging. Older individuals seem to have a dropout or a
remodeling of alpha motor neurons that lead to a decreased activation of Type II muscle fibers. This decreased activation leads to a drop out of Type II muscle fibers as a whole or even an inhibition of contractile properties due to intramuscular fat and connective tissue accumulation within the skeletal muscle (Lexell et al., 1988).
With the physiological mechanisms underlying skeletal muscle loss established, more recent literature has set out to establish the trend of decreased strength with age and its
that older individuals were still able to fully activate their muscle, indicating that the loss of strength did not appear to occur as a result of an inhibition of the central nervous system. Rather, it was a peripheral issue. Specifically, the results indicate that age-related muscle weakness may be more related to the number of muscle fibers present as well as the majority of these muscle fibers being of the Type 1 category (Rice, Cunningham, Paterson, & Lefcoe, 1989). Similarly, V. A. Hughes et al. (2001) examined knee extensor strength through isokinetic testing at 60°/sec while simultaneously observing muscle mass through creatinine excretion over a period of 10 years. Results of the study indicated that as age increased, strength of the knee extensors significantly decreased, muscle mass of the knee extensors was positively related to changes in knee extensor strength, and females had a larger percent change in strength in the lower body than did males (V. A. Hughes et al., 2001). Not only does this study back up the claims that the age-related muscle size is strongly correlated with the age-related strength loss; but it seems as if females experience a greater decrease, putting them at a greater risk of developing sarcopenia and functional impairment. With these studies in mind, the trend of losing skeletal muscle mass and strength with the aging process alone is well established. However, issues such as sedentary lifestyles and disease can, in essence, accelerate the loss of the skeletal muscle and strength.
Disuse / Sedentary Lifestyle
inactivity plays a significant role in the loss of muscle mass and strength. Decreased physical activity resulting in sedentary lifestyles and disuse of skeletal muscle typically produce muscular adaptations of muscle cross sectional area and muscle fiber reductions (Brooks et al., 2005). Kasper, White, and Maxwell (1990) were able to show a significant decrease in overall muscle mass and fiber cross sectional area in the soleus muscle during a period hind-limb suspension. Indeed, this study was completed in animals. However, the results of the study provided a good indication about the influence of reduced physical activity on skeletal muscle.
Lack of physical activity and sedentary lifestyles have been shown to be strongly associated with an increase in mortality rate in older men (Hakim et al., 1998). Hakim et al. (1998) were able to show that older men whom walked less than one mile per day were nearly twice as likely to experience an earlier onset of mortality. Additionally, Hakim and associates discovered that of those who did experience mortality at an earlier stage in life, 13.4% of those died of cancer.
Despite the significant association provided, the section at hand is focused on the
compared to males (Rantanen, Era, & Heikkinen, 1997). With the use of validated physical activity scales, handgrip dynamometry, and isometric / isokinetic strength testing, Rantanen et al. (1997) provided data that indicated a greater loss of strength in inactive females when compared to inactive males during post testing. Moreover, baseline data provided significant correlations between strength scores and activity levels of females. Specifically, those that started the study classified as “sedentary” produced lower strength scores at baseline than did the females that started the study classified as “active” (Rantanen et al., 1997). Similarly, Kostka, Rahmani, Berthouze, Lacour, and Bonnefoy (2000) were able to provide evidence for strong links between physical activity and muscle function, specifically, quadriceps strength. For example, increased quadriceps power, as obtained by dynamometry, was seen in those whom were regularly
engaged in sports activity, as gauged through completion of a questionnaire (Kostka et al., 2000). In addition, lack of muscle mass has been shown in women who were considered to not have been regularly engaged in physical activity, ultimately leaving them prone to issues such as osteopenia and osteoporosis (Walsh, Hunter, & Livingstone, 2006).
Regardless of gender, the evidence appears convincing that lifestyle choice plays a significant role in the loss of muscle strength and muscle mass in addition to the natural aging process. This phenomenon appears to have a greater impact on females as well. As briefly
Cancer: Effects on skeletal muscle loss and strength
Cancer patients undergoing treatment (chemotherapy, radiation, etc.) occasionally experience excessive weight loss. For many professionals within the oncology field, this excessive weight loss is termed “cachexia”. Cachexia has been said to occur by many proposed mechanisms such as energy intake and substrate metabolism (K. C. Fearon & Moses, 2002). However, only until recently has there been a definition that is widely accepted among the medical community. Ultimately, cachexia can be defined as “a multifactorial syndrome characterized by an ongoing loss of skeletal muscle mass that cannot be fully reversed by conventional nutritional support and leads to progressive functional impairment” (K. Fearon et al., 2011). Additionally, the loss of skeletal muscle mass can occur with or without the loss of fat mass (K. Fearon et al., 2011). The loss of skeletal muscle during cancer treatment remains an important issue today due to its relation with morbidity. It is a prominent cause of cancer reoccurrence as well as mortality (K. C. Fearon & Moses, 2002). In the last decade, researchers have sought out the specific mechanisms behind the occurrence of cachexia in order to develop counter-acting protocols to prevent the significant loss of skeletal muscle mass, and in the same context, skeletal muscle strength.
A review by Costelli and Baccino (2003) indicated that a potential mechanism behind cachexia in cancer patients is the Ubiquitin-Proteasome System, in which proteins are broken down. The authors claimed that it is likely that this system holds primary responsibility over the onset of cachexia due to its enhancement in response to cancer. Despite this, more recent
Battaglini, Hackney, and Goodwin (2012) have proposed a hypothetical model entitled Exercise Anti-Cachectic Hypothetical (EACH) in order to demonstrate this process. The model depicts the role of exercise training on skeletal muscle through the up-regulation of anti-inflammatory cytokines as well as androgenic hormones as an acute response. The up-regulation that occurs has induced protein synthesis within the skeletal muscle and has inhibitory effects on pro-inflammatory cytokines that often rise as a result of cancer and cause sarcopenia, decreased quality of life, and increased morbidity. This model is supported by observing these responses to exercise training in breast cancer patients (C. Battaglini et al., 2007) and leukemia patients (C. L. Battaglini et al., 2009).
With the mechanism behind cachexia now widely accepted, it is important to recognize that along with muscle mass, cancer can repress muscular strength as well, which can hinder functional capabilities and quality of life of the patients. Monga et al. (1997) examined the neuromuscular fatigue in prostate cancer patients undergoing radiation therapy via isokinetic and isometric strength testing. Despite the statistical procedures indicating non-significant
comorbidity (Vardar-Yagli et al., 2015). This study displayed the importance of remaining physically active for breast cancer patients. Not only did being physically active elicit greater strength scores, it left the patients at a lower risk of comorbidity. By training, breast cancer patients can increase their strength and attenuate the risk of developing other diseases as well as the reoccurrence of the breast cancer itself.
Skeletal muscle and functional capabilities; effects of resistance training Functional Ability
With the loss of skeletal muscle mass and strength, early to recent literature have
discovered significant associations between this epidemic and the ability to perform activities of daily living (i.e., functional tasks). Functional tasks include, but are not limited to, carrying groceries, standing up from a chair, and walking. Sarcopenia and its influence on functional ability has been an area of interest to many researchers. With the assistance of the NHANES III study to determine functional impairment, Janssen, Heymsfield, and Ross (2002) discovered that those deemed with Class II sarcopenia, as determined by bioelectrical impedance, were strongly associated and more likely to develop the inability to perform functional tasks. Additionally, more recent research has exhibited that those with sarcopenia elicit slower gait and walking speeds (Tanimoto et al., 2013). Given that resistance training can diminish or even reverse the effects of sarcopenia, it would be ideal to suggest that older and sedentary individuals should participate in resistance training programs to attenuate the risk of functional impairment (Frontera, Meredith, O'Reilly, Knuttgen, & Evans, 1988).
have been displayed in earlier literature (M. Brown, Sinacore, & Host, 1995). M. Brown et al. (1995) were able to show that older individuals whom acquired lower overall muscle strength in the lower limbs, produced greater time trials in order to complete 5 chair stands and produced slower gait speeds. M. A. Hughes, Myers, and Schenkman (1996) found similar results in the chair rise and strength measures in older individuals when compared to younger participants. It’s apparent that with a reduction in isometric strength in the lower limbs, the ability to rise from a chair becomes increasingly difficult and almost impossible for some individuals (M. A. Hughes et al., 1996). Older individuals lose their ability to generate the strength and power required for this task. Some literature even claims that muscle power, rather than muscle strength, is the main contributing factor to this decreased functional ability (Foldvari et al., 2000). The reasoning behind this involves the idea that most functional tasks involve the ability to generate force at a greater velocity, rather than just generating force in itself (Bassey et al., 1992). Foldvari et al. (2000) discovered through regression analyses that older individuals that produced lower peak power outputs on the leg press were also more prone to functional disability. Peak power output was the only variable, besides physical activity, that was an independent predictor of functional disability. Overall, the impact that skeletal muscle mass/strength loss has on functional ability is detrimental. However, attenuations can be accomplished with proper training
Effects of resistance training (Functional Ability)
other than aerobic capacity. In the elderly, strength gains and increases in the cross-sectional area of elbow flexors and leg extensors have been observed simultaneously in response to 12 weeks of resistance training (A. B. Brown, McCartney, & Sale, 1990). Indeed, the cited study was conducted in elderly males. However, middle-aged women, both pre and post menopausal, have experienced positive adaptations to resistance training in forms of increased upper and lower body strength and improved body composition with 8 to 12 weeks of training (Benton, Kasper, Raab, Waggener, & Swan, 2011; Kemmler, Lauber, Engelke, & Weineck, 2004). Similarly, in response to a training program consisting of both aerobic and resistance training, breast cancer patients have been reported to significantly improve both body composition and muscular strength (C. Battaglini et al., 2007).
With it well established that resistance training can improve muscular strength in both aging populations (middle-aged and elderly) and diseased populations such as cancer, the influence that it has on functional capabilities in these same populations has become an
important area of research. Functional tasks such as stair climbs, chair stands, and walking have been examined in accordance with resistance training programs to examine the effect that the training has on these activities of daily living. Additionally, studies have implemented different training protocols and have observed similar improvements in task such as chair stands and various walking tests (Hanson et al., 2009; Henwood & Taaffe, 2006; Pinto et al., 2014). Hanson et al. (2009) put participants through 22 weeks of resistance training. As a result, both sedentary males and females collectively improved upon their functional capabilities. Hanson and his associates reported significant improvements in the rapid walk, get up and go, and 5-chair stands functional tests. In a study conducted by Henwood and Taaffe (2006), participants were
press, leg curls, leg extensions, rows, and bicep curls. Post-training, it was observed that the participants had significantly improved on their functional capabilities, which was observed through the completion of a chair rise exercise. Further, the stair climb ability of the participants was approaching significance during post-testing. Similarly, Pinto et al. (2014) was able to see improvements in functional capabilities, as measured by 30-second sit to stands and 8-foot up and go tests, in as little as 6 weeks of resistance training. It should be noted that this took place in sedentary females, a similar population as to what the current study will be looking at.
Skeletal muscle and aerobic capacity; effects of resistance training Aerobic Capacity
Age-related declines in aerobic capacity, regardless of training status, have been well documented within past literature as indicated by a meta-analysis published by Fitzgerald, Tanaka, Tran, and Seals (1997). This decline is similar to that of the age-related loss of skeletal muscle mass and strength. The inhibitory influence that skeletal muscle mass/strength loss has on an individual’s aerobic capacity includes the inability to produce the amount of force required to withstand the resistance on during a cardiopulmonary exercise test (CPET) (Neder et al., 1999). Ultimately, this results in an earlier cessation of the test and VO2peak values that are not
With Fleg and Lakatta (1988) establishing this relationship between skeletal muscle and aerobic capacity, more recent literature has made good use of advances in technology to further examine the relationship. Specifically, studies have observed reductions in lean mass in
accordance with aerobic capacity with more reliable body composition methodology, such as skinfolds (Jackson et al., 1995), underwater weighing (Toth, Gardner, Ades, & Poehlman, 1994), and DEXA scans (Proctor & Joyner, 1997). Additionally, researchers have been able to examine the influence that physical activity and disease has on this relationship. Ultimately, multiple researchers have been able to establish a “cascade of events” that leads to this reduction in aerobic capacity. As aging occurs, reductions are observed physical activity. The reduction in physical activity, as we know from recent literature previously discussed, accelerates the reduction in lean mass, which in turn reduces an individual’s aerobic capacity (Jackson et al., 1995). Proposed mechanisms include the inability of the quadriceps to produce an optimal power output when compared to reductions in aerobic capacity (Kostka et al., 2000). In diseased
individuals, such as those with chronic heart failure, bed rest during treatment and recovery decreases their lean muscle mass where similar associations have been observed in measured VO2peak values as with healthy individuals with decreased muscle mass (Cicoira et al., 2001; Mancini et al., 1992). Declines in aerobic capacity with age and physical activity level have been well established. This relationship has lead researchers on a path to attenuate this decline with not aerobic training, but with resistance training.
Effects of resistance training (Aerobic Capacity)
reported mixed results (Keeler, Finkelstein, Miller, & Fernhall, 2001). For instance, O'Bryant, Byrd, and Stone (1988) took a group of college-aged males and tested the impact that periodized resistance training had on endurance performance variables on a cycle ergometer, specifically power output. The researchers discovered, that along with increases in strength, the participants significantly increased their power output on the cycle ergometer (O'Bryant et al., 1988). Even though this study did not specifically look at the VO2 of the individuals, its results helped establish a relationship between resistance training and endurance performance. Similarly, studies in years to follow examined parallel relationships such as the effects of weight training on walking endurance, whose results were analogous to those of O’Bryant et al., (1988) (Ades, Ballor, Ashikaga, Utton, & Nair, 1996).
With it well established that aerobic capacity declines with aging, and their initial weight training studies in older men providing evidence that resistance training does indeed improve the overall size of skeletal muscle as well as functionality of the individual, Frontera, Meredith, O'Reilly, and Evans (1990) set out to explore how resistance training impacted the aerobic capacity (VO2peak) of older men. As one of the first and most highly cited studies on this particular subject matter, Frontera et al. (1990) discovered that resistance training did indeed have a significant and positive impact on VO2peak in older men. In particular, participants were assigned to 12 weeks of resistance training. Muscle fiber area was assessed by muscle biopsy and VO2peak was assessed by cycle ergometry. As a result of resistance training, not only did absolute VO2peak increase from pre to post, but positive correlations between activity of the vastus lateralis and VO2peak were observed, leading the researchers to conclude that with aging, resistance
As a result of Frontera et al. (1990) findings, many other researchers have commenced on researching the same relationship, but in different populations. Vincent et al. (2002) examined this relationship between resistance training and aerobic capacity in elderly males and females, rather than just elderly males. In their study, Vincent et al. (2002) studied the effects of high-intensity resistance training and low-high-intensity resistance training on aerobic capacity. Results indicated that both high and low intensity resistance training significantly improved VO2peak with no differences between the two groups (Vincent et al., 2002). Ultimately, the study indicated that regardless of resistance training type, a positive influence can still be observed in VO2peak in both male and female elderly individuals. The previous study combined the results of both males and females. However, it is important to know how females’ VO2peak will respond to resistance training alone. Ferketich, Kirby, and Alway (1998) did just that by exposing elderly females to a combined training program of resistance and aerobic training. Despite the combination of training, the participants produced greater increases in strength and VO2peak post-training when compared to the endurance only group and control group (Ferketich et al., 1998).
More recent research has explored the effects of resistance training on VO2peak in special female populations such as those whom are postmenopausal and breast cancer patients.
Postmenopausal participants have been reported to significantly improve aerobic capacity in response to both high intensity resistance training as well as circuit weight training (Brentano et al., 2008). Those with breast cancer have reported similar results, despite participating in a resistance-training program combined with walking (Rahnama, Nouri, Rahmaninia, Damirchi, & Emami, 2010). These results show that there is indeed a relationship between VO2peak and
important. With many studies indicating that strength training can increase VO2peak in similar populations (female, sedentary, breast cancer), resistance training comes across as a viable method to help improve the accuracy of aerobic exercise prescription. However, the studies discussed in this section contain training protocols that last from 8 weeks to as long as 24 weeks. To exercise professionals wanting to prescribe aerobic exercise, a protocol of these lengths is time consuming and not efficient. Early research has reported strength gains in response to resistance training as early as 2 weeks, without increases in cross-sectional area indicating an increased efficiency in neuromuscular aspects of skeletal muscle (Moritani & deVries, 1979). With this in mind, it is logical to test this relationship with a shorter protocol targeting
neuromuscular adaptations to increase VO2peak on a cycle ergometer. Before short-term adaptations to resistance training are discussed, an overview on neuromuscular physiology is provided.
Overview of Neuromuscular Physiology
charged. This is the opposite charge of the membrane when it is at rest. The physiological mechanism that brings about an action potential is a product of the membrane’s increased permeability for Na rather than K (Brooks et al., 2005). This has also been referred to as the “all or nothing principle”. Ultimately, as the membrane’s permeability for Na increases, at a certain point a threshold is reach. At this point, a point of excitability occurs inside the muscle cell due to a rapid influx of Na. As a result of the rapid influx, an action potential is generated.
Action potentials are brought about by excitatory post-synaptic potentials (EPSP) and inhibited by inhibitory post-synaptic potentials (IPSP). Excitatory post-synaptic potentials involve the release of acetylcholine. Acetylcholine increases the membrane potential’s
permeability for Na, gradually getting it closer to the voltage threshold where an action potential will always take place. The excitatory events can occur via spatial or temporal summation. Spatial summation involves EPSP’s nerve endings surrounding a single soma and releasing an abundance to neurotransmitter to bring about and action potential; whereas temporal summation involves a repeated stimulation of a pre-synaptic nerve ending to bring about an action potential (Brooks et al., 2005). Once the action potential takes place, it only lasts about close to 1
millisecond (Brooks et al., 2005). The rapid inhibition is a result of inhibitory post-synaptic potentials increasing the muscle cell’s permeability for chlorine (Cl), decreasing the cell’s membrane potential.
calcium channels within the plasma membrane open, resulting in the release of acetylcholine, which in turn results in the passing of Na and K passing through the newly opened channels. With the passing of these ions, depolarization of the motor end plate occurs. This can also be termed the “end plate potential”. As the motor end plate is depolarized, an excitatory response from the plasma membrane results and the action potential is then sent via the t-tubules to the muscle fibers to elicit a contraction.
Once the action potential reaches the skeletal muscle fibers, another series of events, primarily mechanical, occurs to elicit the power produced from the single action potential / muscular contraction. This can be termed the Excitation Contraction Coupling Process. After the action potential has reached the motor end plate, calcium is released into the sarcoplasm via the sarcoplasmic reticulum. The released calcium then acts upon the contractile protein troponin, resulting in another contractile protein, tropomyosin, relocating off of actin protein molecules, exposing the binding sites for myosin proteins. Myosin heads then bind to actin forming
crossbridges. These newly formed crossbridges then pull on each other and create power strokes as a result of ATPase isoforms hydrolyzing adenosine triphosphate (ATP) to power the
contraction. This process continues as long as ATP and calcium is present, and calcium is present as long as action potentials continue to be sent down the t-tubules.
As stated earlier, motor neurons carry the action potentials to the skeletal muscle fibers. And alpha motor neuron and all the muscle fiber it innervates can be classified as a motor unit (Brooks et al., 2005). Alpha motor neurons are classified as alpha I and alpha II. Alpha I motor neurons are typically seen in fast twitch muscle fibers. Their characteristics include fast
the opposite of alpha I motor neurons. Alpha II motor neurons have a slow conduction velocity, low recruitment threshold, high fatigue resistance, and they are smaller. In terms of the order of recruitment, motor neurons are typically recruited based on the amount of effort it takes to recruit one. In other words, easier motor neurons are recruited first. The easier of the two types are alpha II motor neurons. This can easily be described as the Size Principle. The Size Principle states that smaller motor neurons will be recruited first because they are easier to bring about (Brooks et al., 2005). With that said, it can be inferred that alpha II motor neurons are recruited followed by alpha I.
Short Term Adaptations to Resistance Training
It has been well established within past literature that neuromuscular adaptations play the primary role in initiating strength gains in response to a resistance-training regimen (Hakkinen, Pakarinen, & Kallinen, 1992; Moritani & deVries, 1979). The earliest and most commonly cited study that represents this physiological mechanism is that of Moritani and deVries (1979). In their study, males and females were subjected to eight weeks of isotonic resistance training of the elbow flexors. Throughout the eight weeks, strength and hypertrophy measurements were taken every two weeks. The first two testing sessions (weeks 2 and 4) showed significant increases in strength and muscle activation. However, there were not significant increases in the size of the elbow flexor muscles. From this data, Moritani and deVries (1979) were able to conclude that the primary mechanism behind early strength gains (weeks 2 and 4) were primarily due to the enhancement of neuromuscular recruitment. Further, specifically in females, similar results have been reported just after two weeks of resistance training (Hakkinen et al., 1992). In their study, Hakkinen et al. (1992) had female subjects participate in three weeks of resistance training. Isometric EMG measurements were completed after the second and third of week training. Indeed, Hakkinen et al. (1992) observed significant increases in force production and EMG after the third week of training; however, they also reported a significant increase after the second week of training as well. Based on these earlier conducted studies, strength gains early on in resistance training programs do indeed occur. Additionally, they can occur very rapidly; in as little as two weeks as reported by the two previously discussed studies.
more compelling aspect of the debate regarding short-term adaptations in response to resistance training falls under studies that have reported increases in force production with as little as two to three days of resistance training (Cramer, Stout, Culbertson, & Egan, 2007; Prevost, Nelson, & Maraj, 1999). Prevost et al. (1999) was able to show increases in torque production with two days of fast velocity isokinetic training on the knee extensors. Male participants were introduced to two days of training consisting of three sets of ten repetitions at a slow velocity (0.52 rad/s) and a fast velocity (4.17 rad/s). Despite the authors finding no significance in increases in mean torque at slow velocities, they did however discover that mean torque production to fast
velocities significantly improved after training. In fact, Prevost et al. (1999) reported that the significant increases were similar to other studies that implemented longer training protocols. Given that these results are similar to data from studies of longer protocols, it can be inferred that neural adaptations play a vital role in the ability to generate torque. Furthermore, Cramer et al. (2007) was able to produce similar results with a similar study protocol with added creatine supplementation. Isokinetic leg extensions were performed at slow and fast velocities for both the supplement and control group. Results indicated that there were significant increases in peak torque for both groups, whereas the difference between the groups was not significant (Cramer et al., 2007). The data from this study indicated that three days of isokinetic resistance training on the leg extensors is sufficient to elicit smaller, but significant, strength gains, regardless of creatine supplementation.
as to how they were truly produced from the study protocol. The one study that has examined short-term resistance training adaptations in response to traditional resistance training while simultaneously investigating the protocol’s influence on aerobic capacity in females was
conducted by Kim et al. (2011). In this study, college-aged females (sedentary) were subjected to four weeks of resistance training consisting of leg press and chest press exercises. Post-testing revealed that the training program brought about significant increases in the leg press exercises as well as VO2peak values for the subjects (Kim et al., 2011). Overall, based on recent literature, there seems to be a potential relationship between short-term adaptations to resistance training and an individual’s aerobic capacity. With the study at hand, we have chosen a gender, age range, and delimited to sedentary individuals in order to have the best chance possible of
CHAPTER III
METHODOLOGY Subjects
Eighteen subjects were recruited for this single arm, repeated measures study. All recruited subjects were assigned to the intervention group. Recruitment for the study was
completely voluntary, as subjects were made aware of the project via flyers, emails, phone calls, and face-to-face interaction with research team members. Recruitment sites included areas that fell within that of central North Carolina. Approval from the Institutional Review Boards in Exercise and Sport Science and School of Medicine (Biomedical) at UNC-Chapel Hill was obtained before commencing with the recruitment of subjects.
All subjects participating in the study were between 35 to 65 years of age and sedentary. The sedentary nature of the participants was determined by not having participated in regularly scheduled exercise more than once a week for at least six months prior to beginning the study. Interested subjects were enrolled in the study if they presented no cardiopulmonary and musculoskeletal disease that would preclude their participation in any aspect of the study as determined by a physician physical evaluation. Subjects were screened for exclusion based upon the criteria presented by the American College of Sports Medicine (ACSM) as contraindications to exercise testing (Pescatello & American College of Sports, 2014).
ultrasound assessment, familiarization of testing procedures described below, and 1-RM
assessment. Visit two included the pre-intervention testing procedures of the VO2peak assessment
and the isokinetic EMG assessment of the VL, respectively. The next six visits took place over the course of two weeks with 48 to 72 hours separating each visit. These sessions made up the two weeks of lower body resistance training. The ninth and final visit included the
post-intervention testing sessions of the ultrasound assessment, VO2peak assessment, and the isokinetic
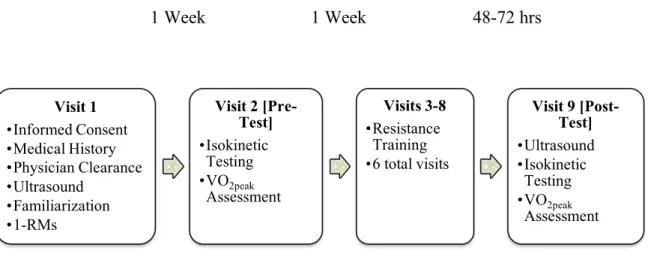
EMG assessment of the VL, respectively. Figure 1 provides a visual timeline of the visits described above.
Figure 1. Study Timeline
Visit 1 •Informed Consent •Medical History •Physician Clearance •Ultrasound •Familiarization •1-RMs
Visit 2 [Pre-Test] •Isokinetic Testing •VO2peak Assessment Visits 3-8 •Resistance Training •6 total visits
Visit 9 [Post-Test] •Ultrasound •Isokinetic Testing •VO2peak Assessment
Instrumentation
Anthropometric / Screening
Height was measured to the nearest 0.1 cm via a Portable stadiometer (Perspective Enterprises, Portage, MI USA), and mass was measured to the nearest 0.1 kg via a mechanical scale (Detecto, Webb City, MO USA). Ultrasound (US) images to assess cross-sectional area (CSA) of the VL were obtained by a brightness mode (B-Mode) portable ultrasound-imaging device (LOGIQe 5, General Electric Company, Milwaukee, WI, USA) along with a multi-frequency linear-array probe (12L-RS; 5-13 MHz; 38.4 mm FOV) (General Electric Company, Milwaukee, WI, USA) and hypoallergenic water-soluble gel (Aquasonic 100, Parker
Laboratories, Inc., Fairfield, NJ, USA) in order to enhance signal. US images were analyzed with LogicViewTM software (General Electric Company, Milwaukee, WI, USA).
A medical history questionnaire (Department of Exercise and Sports Science) was used to log the subjects’ medical history, age, race, and relative physical activity level within the past year. This was utilized in conjunction with the physical examination and resting
Cardiopulmonary
VO2peak was assessed by a Parvo Medics TrueMax 2400 Metabolic System (Parvo Medics, Salt Lake City, UT USA) on a Lode electronically braked cycle ergometer (Lode, Gronigen, The Netherlands). Subjects’ respiratory responses were obtained by use of a Hans Rudolph 7450 Series V2 Respiratory Valve (Hans Rudolph Inc., Shawnee, KS, USA). Rate of perceived exertion (RPE) was assessed via a Borg 6-20 Rate of Perceived Exertion (RPE) scale. Heart rate was monitored via a Pacer Polar heart rate monitor (Polar Electro Inc., Lake Success, NY USA).
One Repetition-Maximum (1-RM) / Strength Testing
A 1-RM for the leg press and leg extension exercise was completed on York 35 Degree Leg Press (York, PA USA) and a Body Solid GCEC340 Leg Extension machine (Forest Park, IL, USA), respectively, for purposes of prescribing the two weeks of resistance training that occurred. Strength testing took pace on a HUMAC Norm Dynamometer (Computer Sports Medicine Inc., Stoughton, MA, USA) in accordance with surface electrode (TSD150B 35mm, Biopac Systems, Inc., Santa Barbara, CA, USA) EMG.
Procedures
as to if they followed the guidelines upon arriving to the lab. These guidelines included
maintaining a proper hydration status as assessed by an American Optical, Hand Held TS Meter (Keene, New Hampshire, USA) refractometer, being at least two hours fasted, no caffeine consumption at least eight hours prior, and no alcohol consumption at least twenty-four hours prior. In between the pre and post testing sessions, subjects reported to the Human Performance Center (HPC) at Fetzer Hall for a total of six sessions to take part in the two-week lower body resistance training protocol. All subjects within the study were required to undergo a physical screening by a physician in accordance with a 12-lead EKG, medical history questionnaire, and PAR-Q form. All visits took place in the EORL, HPC, or NMRL.
Visit One: Physical Screening, Ultrasound, Familiarization of Testing Procedures, 1-RM The first visit to the laboratory included signing of the informed consent form,
completion of the medical history questionnaire, PAR-Q, and a 12-lead resting EKG as part of the physical examination by a physician member of the research team. Height and weight was then obtained. Subjects then took part in the US assessment as well as the 1-RM testing of the leg press and leg extension exercises.
Ultrasound
gel was then applied to the subjects skin and probe in order to enhance signal with the US
imaging device. A probe support was used to ensure that the probe scans perpendicular to the VL along the transverse axis (lateral to medial). Three consecutive panoramic scans of the VL at a gain of 50dB and a depth of 5.0 cm (Mangine et al., 2014) were taken in order to assess CSA. The greatest CSA value obtained from the three separate scans was used for data analysis.
Familiarization
Subjects were then familiarized with the testing protocols so they would become aware and comfortable with the testing procedures. Initially, subjects were taken to the NMRL to be familiarized with the isokinetic EMG assessment. For the EMG familiarization, subjects were asked to sit in the dynamometer chair, and a member of the research team adjusted all harnesses to replicate the actual testing session. Subjects were then instructed on the isokinetic leg
extensions that occurred during the testing session on the right leg (unilateral). Once procedures had been discussed, subjects performed three consecutive isokinetic leg extensions at 50% and three consecutive isokinetic leg extensions at 75% of their perceived maximal effort. Velocity was set at 60°/second. Subjects were then familiarized with the cardiopulmonary exercise test
1-RM Assessment
The 1-RM assessment of the leg press and leg extension was conducted in order to
approximate the max strength of the subjects, and took place in the HPC for purposes of defining initial exercise training intensity. An assessment was not performed on the leg curl exercise since the muscles primarily involved in cycling are the quadriceps. Rather, the leg curl was included to balance the resistance training with both the anterior and posterior portions of the lower limbs. Before the assessment, subjects were asked to assume position on the leg press machine and instructed on proper form. Proper form included lower back and hips pressed against the seat, legs parallel with feet hip width apart and toes slightly angled out, and a slow progression of allowing the hips and knees to flex as the weight is being lowered until the hips have come off of the seat (National Strength and Conditioning, 2008). For the leg extension, the knees were aligned with the axis of the machine, and subjects were asked to perform the exercise with their back against the back pad (National Strength and Conditioning, 2008) with hands grasping the handles.
Lower weight was applied to the machines to allow subjects to warm up as well as for the
tester to have a feeling on what initial weight was used for the first attempt to max. The tester
then asked subjects to rate their effort during the warm-up using a Rate of Perceived Exertion
scale so to guide the tester on the initial load to be used to determine the 1-RM. The 1-RM value
was determined for the leg press and leg extension exercises by increasing the workload each set
until subjects were unable to lift the highest possible load 1 time with proper form. A 2-minute
rest was provided between each set, and a 5-minute rest was provided between the two exercises.
Visit Two (Pre) and Nine (Post): Testing Sessions
The pre and post visits have been combined since procedures that will be discussed in this section were identical for both sessions with exception to visit nine, which will additionally include the second ultrasound assessment. Testing procedures occurred in this order: (1)
Isokinetic strength testing and (2) the VO2peak assessment. A rest period of a minimum of 10 minutes and a maximum of 15 minutes was utilized between the two tests to allow for proper recovery.
Isokinetic Strength Testing
Prior to beginning the strength test, subjects were allowed to warm up on a cycle ergometer for 5 minutes at 50 Watts. Subjects were then taken to the NMRL for the isokinetic leg extension assessment. Procedures were based off those conducted by previous studies in similar populations (Bottaro, Russo, & de Oliveira, 2005; Theou, Gareth, & Brown, 2008). Subjects were placed in the dynamometer chair with harnesses placed over the shoulders, waist, and right leg. The right knee was aligned with the dynamometer’s center of axis of rotation at 90° as measured by a goniometer (Model G800, Whitehall Manufacturing, Industry, CA, USA).
Muscle activation was examined using EMG surface electrodes that were placed on the muscle belly of the VL at 66% of the femur length. The EMG electrodes were placed parallel to the muscle fibers of the VL and a ground electrode was placed on the tibial tuberosity of the right knee. Once electrodes were in position, subjects were instructed to complete three warm-up isokinetic leg extensions at 50% as well as 75% of their perceived maximal effort at a velocity of 60°/second. Subjects then proceeded to complete three maximal isokinetic leg extensions at a
torque and subsequent EMG amplitude values that were recorded during the isokinetic load range were used for data analysis.
All signals were collected with a Biopac MP150WSW data acquisition system and AcqKnowledge software (Biopac Systems, Inc., Santa Barbara, CA, USA) at a sampling rate of 2000 Hz. Raw EMG and torque signals were stored on a personal laptop computer (MacBook Air, Apple Inc., Cupertino, CA, USA) and analyzed with Labview 2014 software (Version 14, National Instruments, Austin, TX, USA). A fourth order, zero phase shift low pass 50 Hz Butterworth filter was used to filter the torque and a zero phase shift bandpass (10 – 500 Hz) fourth order Butterworth filter was used for the EMG signals. Peak isokinetic torque was determined as the highest 100 millisecond epoch during the constant angular velocity of
60°/second (Iossifidou & Baltzopoulos, 2000). EMG amplitude was calculated using a root mean
square (RMS) function during the entire isokinetic load range (Jenkins et al., 2015). The EMG amplitude values during the maximal isokinetic testing were normalized to baseline EMG signals as described previously [(MVC amplitude / baseline amplitude) X 100] (Pamukoff, Ryan, & Blackburn, 2014).
Cardiopulmonary Fitness Assessment
stage. HR and RPE (6-20) were continually monitored and recorded during the last minute of every stage. Termination of the test was determined by the subjects’ reaching volitional fatigue and signaling to stop the test, VO2 plateau or decrease with increase in exercise intensity, or if an abnormal subject response to the test was observed and therefore the research team will
terminate the test. Once the test had been terminated, a cool down period of light intensity (< 20 Watts) was implemented until baseline levels were reached. Criteria established for VO2peak is that set forth by the American College of Sports Medicine (ACSM).
Visits Three through Eight: Lower Body Resistance Training Protocol
Over a period of two weeks, subjects reported to the HPC for a total of six visits for the lower body resistance training protocol with 48 to 72 hours between each visit. Each subject began the sessions by warming up on a cycle ergometer for five minutes at 50 Watts. Subjects were then lead through three resistance training exercises including the leg press, leg extension, and leg curl. Initially, intensity for the exercises was set at 65% of the subjects’ 1-RM for
sessions 1 and 2. For the leg curl exercise, a moderate intensity load was used to provide subjects with hamstring training to counterbalance the heavier training of the quadriceps muscle. Subjects completed 2 sets of 8-10 repetitions with a 2-minute rest (Vieira et al., 2015) between each set and the different exercises. On sessions 3 and 4, a 10% increase in load was implemented to stimulate training effects, which follows the recommendations of the American College of Sports Medicine (ACSM) in training intensities. Subjects followed the same number of sets and
approximately thirty to forty-five minutes. Each resistance training session concluded with a five minute cool down session consisting of various static stretches. Stretches focused on the hip and knee extensors and flexors. Further, each stretch was held for thirty seconds and performed twice.
Data Analysis
Sample Size Calculation
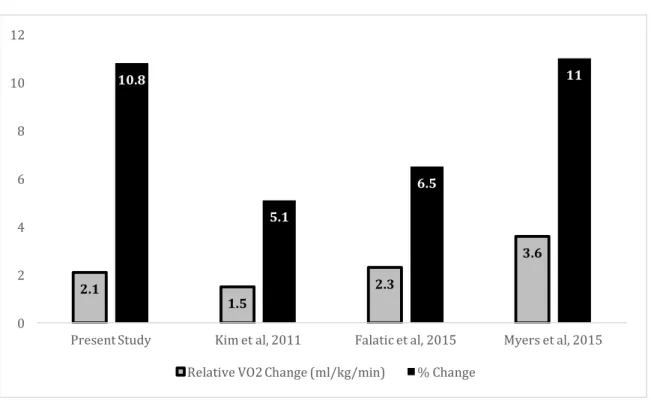
Power calculations for the proposed study were completed using G*Power 3.1 software (67) based on data from Falatic et al. (2015) due to gender similarities, resistance training
protocol length, and primary outcome variables of VO2max. With a predicted 10% of performance
improvement in VO2peak, mirroring the results of the aforementioned study, the proposed study
sufficiently achieved a power of 0.80 with enrollment of eighteen total subjects.
Statistical Analysis
Collected data for this current study was analyzed with SPSS Statistics version 20.0. The
alpha level was set a priori for all statistical analyses at 0.05. Descriptive statistics were used in
order to exhibit the study population characteristics (age, height, body mass, etc.). Paired
samples t-tests were conducted in order to compare training effects from pre to post-intervention
(VO2peak, PT, peak EMG amplitude, and CSA of the VL muscle). Additionally, simple
regressions were used to examine the relationship between the change values in VO2peak and PT
CHAPTER IV
RESULTS
The purpose of the study was to examine the effect of two weeks of lower body resistance training on aerobic capacity in sedentary middle aged females as assessed via a maximal CPET on a cyce ergometer. A secondary purpose of this study examined the effect of the two-weeks of lower body resistance training on muscle strength, activation and size of the VLmuscle. A tertiary purpose evaluated the relationship between changes in VO2peak and muscular peak torque/activation from baseline to the completion of the two-week resistance training protocol.
Subjects
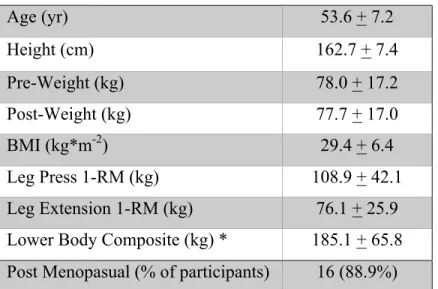
Table 1: Subject characteristics; n = 18 (mean + SD)
Age (yr) 53.6 + 7.2
Height (cm) 162.7 + 7.4
Pre-Weight (kg) 78.0 + 17.2
Post-Weight (kg) 77.7 + 17.0
BMI (kg*m-2) 29.4 + 6.4
Leg Press 1-RM (kg) 108.9 + 42.1
Leg Extension 1-RM (kg) 76.1 + 25.9 Lower Body Composite (kg) * 185.1 + 65.8 Post Menopasual (% of participants) 16 (88.9%)
*Lower body composite = Leg Press 1-RM (kg) + Leg Extension 1-RM (kg)
Training Effects
Pre and post means, standard deviations, change scores, and standard errors of the mean change (SEM) of all primary variables are presented in Table 2 below:
Table 2: Primary Outcome Variables (mean + SD)
Outcome Variables PRE POST CHANGE SEM
VO2peak (ml*kg-1*min-1) 22.2 + 4.5 24.3 + 4.4* 2.1 0.58
VO2peak (L*min-1) 1.7 + 0.4 1.9 + 0.3* 0.2 0.04
Peak Torque (Nm); n=17 83.1 + 25.4 89.0 + 29.78* 5.9 2.84 EMG Amplitude (%) 4250.4 + 3135.3 5177.3 + 3348.2* 962.8 232.9
CSA (cm2) 17.3 + 4.9 17.4 + 5.0 0.1 0.2
* p < 0.05 from pre to post intervention
significant changes in PT (H2) and overall EMG amplitude (H3) of the VL from pre to post intervention were also accepted. Significant increases in PT of approximately 6.1% (p=0.027) and EMG amplitude of 41.3% (p=0.001) were observed. Hypothesis 4, there would be no significant changes in the overall CSA of the VL in response to the intervention was accepted as well as no significant difference in the CSA of the VL was observed (p=0.456). All four
hypotheses were evaluated by conducting paired samples t-tests.
Relationship Between VO2peak and Muscular Strength / Activation
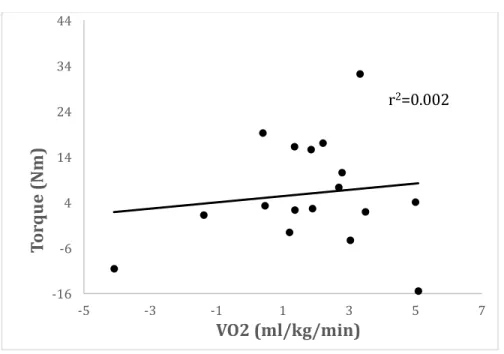
Hypothesis 5 stated that there would be a significant positive relationship between changes from pre to post intervention in VO2peak and PT as well as between VO2peak and EMG
amplitude. The correlations between VO2peak and PT and between VO2peak and EMG amplitude
changes from pre to post intervention were analyzed using simple regressions. No significant relationships between changes in VO2peak and PT (r2 = 0.002; p=0.855) and VO2peak and EMG
amplitude (r2 = 0.003; p=0.839) were observed. Figure 2 depicts relationships between
VO2peak/PT and Figure 3 between VO2peak/EMG Amplitude for the 17 subjects included in the
Figure 2. VO2peak Changes v. Changes in VL Torque Relationship
Figure 3. VO2peak Changesv. Changes in EMG Amplitude Relationship -16 -6 4 14 24 34 44
-5 -3 -1 1 3 5 7
To rq u e (N m ) VO2 (ml/kg/min)
r2=0.002
-500.00 0.00 500.00 1000.00 1500.00 2000.00 2500.00 3000.00 3500.00
-6 -4 -2 0 2 4 6 8
Am p li tu d e (% ) VO2 (ml/kg/min)
Exploratory Analyses
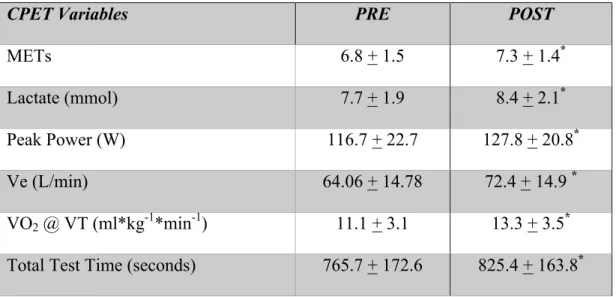
Exploratory analyses were conducted in order to compare selected CPET variables from pre to post. Table 3 provides a visual comparision of the chosen variables.
Table 3: Exploratory Results (mean + SD)
CPET Variables PRE POST
METs 6.8 + 1.5 7.3 + 1.4*
Lactate (mmol) 7.7 + 1.9 8.4 + 2.1*
Peak Power (W) 116.7 + 22.7 127.8 + 20.8*
Ve (L/min) 64.06 + 14.78 72.4 + 14.9 *
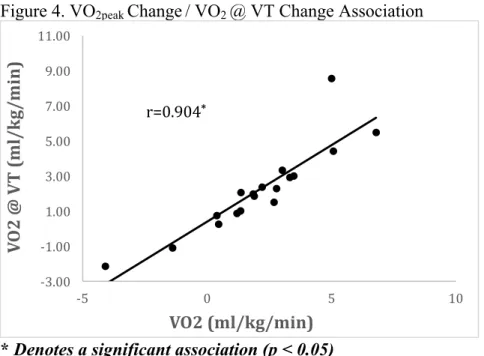
VO2 @ VT (ml*kg-1*min-1) 11.1 + 3.1 13.3 + 3.5* Total Test Time (seconds) 765.7 + 172.6 825.4 + 163.8* * p < 0.05 from pre to post intervention
Figure 4. VO2peak Change / VO2 @ VT Change Association
* Denotes a significant association (p < 0.05)
Figure 5. Post Weight / VO2peak Correlation
* Denotes a significant association (p < 0.05)
-3.00 -1.00 1.00 3.00 5.00 7.00 9.00 11.00
-5 0 5 10
V O 2 @ V T ( m l/ k g/ m in ) VO2 (ml/kg/min) r=0.904* 10 15 20 25 30 35
30 50 70 90 110 130
CHAPTER V
DISCUSSION Overview
The purpose of this study was to determine the effect of two weeks of lower body resistance training on cardiopulmonary capacity in sedentary middle aged females, via CPET with indirect caolrimetry on a cycle ergometer. Though this has not been reported in previous literature, many older, sedentary, and even diseased (i.e., cancer) individuals report leg fatigue as being a primary reason for terminating a CPET on a cycle ergometer. As Neder et al. (1999) previously speculated, this is likely caused by the inability of the individual performing the CPET to generate an adequate amount of force in the lower limbs in order to withstand the resistance in the pedals. Ultimately, this would result in a VO2 value that may not represent an accurate characterization of the individual’s maximal cardiopulmonary capacity.
Knowing that strength gains in reponse to resistance training programs can be observed in those that are untrained as early as two weeks (Moritani & deVries, 1979), it is plausible that this approach could be utilized to improve an older, untrained, or diseased individual’s
cardiopulmonary capacity on a cycle ergometer, knowing that these populations suffer decreases in both leg muscle mass and strength (C. L. Battaglini et al., 2012; Frontera et al., 1991; Kuta et al., 1970). Previous studies have examined the relationship between leg strength and VO2,