AIR POLLUTION AND PULMONARY TUBERCULOSIS DISEASE IN CALIFORNIA
Geneé S. Smith, MSPH
A dissertation submitted to the faculty of the University of North Carolina at Chapel Hill in partial fulfillment of the requirements for the degree of Doctor of Philosophy in the
Department of Epidemiology.
Chapel Hill 2013
Approved by:
Marilie Gammon, Ph.D. Michael Emch, Ph. D.
ii
© 2013 Geneé S. Smith
iii
Abstract
GENEÉ S. SMITH: air pollution and pulmonary tuberculosis disease in California (Under the direction of Marilie Gammon)
Mycobacterium tuberculosis is the causative agent of pulmonary tuberculosis (TB) disease, but environmental factors may influence disease susceptibility and or progression from infection to disease. Ecologic analyses, including a preliminary study conducted, suggest a possible link between active TB and ambient air pollution. Animal models demonstrate that air pollution is associated with a reduction in cytokines that normally prevent latent TB infection (LTBI) from progressing into clinical disease. The primary objective of this investigation was to evaluate the association between ambient air pollution (as measured by SO2, NO2, CO, O3, PM2.5 and PM10) and incident pulmonary TB (PTB). An additional aim was to determine whether cigarette smoking is a risk factor for PTB disease in this population, and whether smoking influences the association between air pollution and increased risk of developing PTB. To address these aims a case-control study nested among members of Kaiser Permanente Northern California (KPNC) was undertaken. Using
electronic clinical databases (ECD), incident cases of PTB diagnosed among adults between the years 1996-2010 were selected, and controls without a history of PTB matched to the cases on age, gender, and race/ethnicity. Cigarette smoking, current and historical residential addresses, and other covariates of interest were abstracted from the ECD. To estimate
iv
weighted surfaces of average monthly pollutant concentrations, produced by the California Air Resources Board. Logistic regression models were used to evaluate the relationship between individual air pollutant and incident PTB, stratifying on history of cigarette
smoking. These results are the first from an analytic epidemiologic investigation undertaken to formally evaluate the hypothesis that individual-level estimates of air pollution
v
DEDICATION
vi
ACKNOWLEDGEMENTS
I would like to thank my advisor, Marilie D. Gammon, for her endless
encouragement, guidance, and enthusiasm throughout this process. I could not have asked for a better advisor. I would also like to thank my always helpful committee members: Michael Emch, Amy Herring, David Richardson, and Annelies Van Rie.
I gratefully acknowledge the contributions of my collaborators, Stephen K. Van Den Eeden, Roger Baxter, and Jun Shan, from Kaiser Permanente Northern California, without which this dissertation would not have been possible. I would also like to thank Cynthia Garcia for helping me to obtain air pollution estimates for the study.
Finally, I want to express my gratitude for the immense support, both academically and personally, I received from fellow students throughout completing my dissertation.
vii
TABLE OF CONTENTS
LIST OF TABLES ... xi
LIST OF FIGURES ... xv
LIST OF ABBREVIATIONS ... xvii
SPECIFIC AIMS ... 1
CHAPTER 1: BACKGROUND ... 4
Epidemiology of Tuberculosis ... 4
TB Infection and Disease ... 5
TB Risk Factors ... 7
TB Prevalence ... 9
Air Pollution and Tuberculosis ... 10
Epidemiology of Air Pollution... 10
Air Pollution and Tuberculosis: Animal Studies ... 12
Air Pollution and Tuberculosis: Human Studies ... 13
Smoking and Tuberculosis ... 15
Epidemiology of Smoking ... 15
Cigarette Smoking and Tuberculosis: Animal Studies ... 17
Cigarette Smoking and Tuberculosis: Human Studies ... 18
viii
Summary ... 22
Chapter 1 Figures and Tables ... 24
References ... 33
CHAPTER 2: RESEARCH METHODS ... 37
Study Design ... 37
Study Population ... 38
Subject Eligibility Criteria ... 39
Case Definition ... 40
Exposure Assessment... 40
Air Pollution Exposure ... 40
Cigarette Smoking Exposure ... 42
Additional Covariates ... 44
Exposure Measurement Concerns... 45
Outdoor Air Pollution ... 45
Indoor Air Pollution ... 46
Statistical Analysis ... 47
Conditional vs. Unconditional Logistic Regression ... 47
Aim 1 ... 48
Aim 2 ... 49
ix
Summary ... 52
Chapter 2 Figures and Tables ... 54
References ... 65
CHAPTER 3: CIGARETTE SMOKING AND PULMONARY TUBERCULOSIS IN NORTHERN CALIFORNIA ... 67
Overview ... 67
Introduction ... 68
Methods... 69
Study Population ... 69
Exposure Assessment... 70
Statistical Analysis ... 71
Results ... 73
Discussion ... 75
Chapter 3 Figures and Tables ... 79
References ... 84
CHAPTER 4: AIR POLLUTION AND PULMONARY TUBERCULOSIS AMONG A POPULATION-BASED SAMPLE OF NORTHERN CALIFORNIA RESIDENTS... 86
Overview ... 86
Background ... 87
Objectives ... 88
x
Study Population ... 89
Exposure Assessment... 89
Statistical Analysis ... 91
Results ... 92
Discussion ... 95
References ... 107
CHAPTER 5: DISCUSSION ... 110
Rationale ... 110
Approach ... 110
Findings... 111
Cigarette Smoking and PTB ... 111
Air Pollution and PTB ... 113
Limitations ... 115
Strengths ... 118
Future directions ... 120
Conclusions ... 121
APPENDIX ... 122
xi
LIST OF TABLES
Table 1.1 Health effects of common air pollutants.………..…….28
Table 1.2 Mean ± standard deviation of particulate matter air pollution
concentrations in North Carolina, 1993-2007………...31
Table 1.3 Comparison of crude and adjusted incidence rate ratios of
pulmonary TB for ambient PM exposure in North Carolina……….…...32
Table 2.1 Mean Annual PM2.5 level (µg/m3) and No. of days
exceeding NAAQS 8-hr Ozone Standard, Northern California
Kaiser counties, 2006………54
Table 2.2 Air pollution monitors available over the study period………..………...57
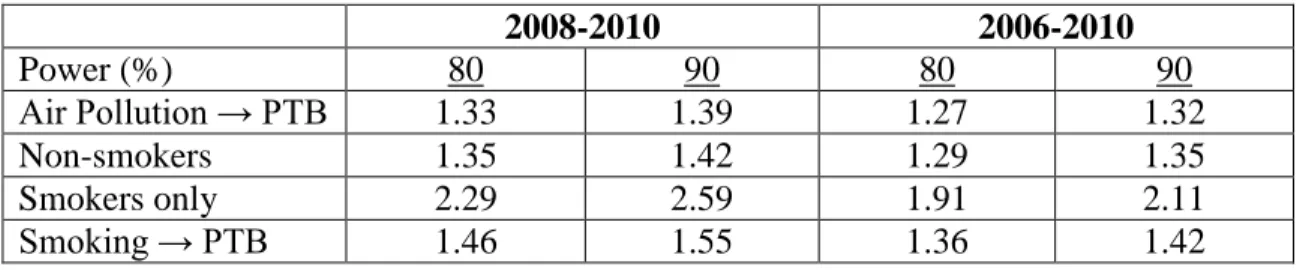
Table 2.3 Minimum detectable odds ratios (Quartile 4 vs. Quartile 1)
for the air pollution-PTB association and smoking-PTB
association……….………....64
Table 3.1 Distribution of select characteristics of cases of pulmonary
tuberculosis (PTB) disease and controls by year of diagnosis for cases and year of selection for controls between
1996-2010 and 2008-2010, Kaiser Permanente Northern
California (KPNC) ………..80
Table 3.2 Adjusted* odds ratios (OR) and 95% confidence intervals
(CI) for the associations between smoking status, duration and dose, and pulmonary tuberculosis (PTB) disease, among cases diagnosed and controls selected between 2008-2010, Kaiser
Permanente Northern California (KPNC) ………...81
Table 3.3 Adjusted* odds ratios (OR) and 95% confidence intervals
(CI) for the association between smoking status and pulmonary tuberculosis (PTB) disease, among cases diagnosed and controls selected between 1996-2010, Kaiser Permanente Northern
California (KPNC) ………..82
Table 3.4 Adjusted* odds ratios (OR) and 95% confidence intervals
(CI) for the association between “Derived” smoking status and pulmonary tuberculosis (PTB) disease, stratified by the percent of the population that is foreign born in the subject’s residential U.S. census block at the time of subject diagnosis/selection+, among cases diagnosed and controls selected between 1996-2010,
xii
Table 4.1 Distribution of matching characteristics of pulmonary
tuberculosis disease (PTB) cases and matched controls nested within the Kaiser Permanente Northern California (KPNC)
membership, 1996-2010 ……….…101
Table 4.2 Mean and percentile distribution of estimates of average
ambient criteria air pollution concentrations cumulated over the 24-month period prior to the pulmonary tuberculosis (PTB) diagnosis/entry into study for cases/matched controls nested within the 1996-2010 KPNC membership with available
pollutant monitoring data. ………..102
Table 4.3 Spearman correlation coefficients* for the estimates of
cumulative ambient criteria air pollutant concentrations, 0-24 months, among pulmonary tuberculosis (PTB) cases and matched
controls nested within the 1995-2010 KPNC membership……….103
Table 4.4 Adjusted* odds ratios (ORs) and 95% confidence intervals
(CIs) for the associations of pulmonary tuberculosis (PTB) and quintile increase in ambient criteria air pollutants concentrations, 0-24 months, among all cases and matched controls nested within the 1996-2010 KPNC membership, and stratified by
smoking status (ever vs. never smokers) ………...106
Table A1 Number and percent of study participants with “Tobacco”
smoking variable data available over the entire study period
(1996-2010), KPNC………...124
Table A2 Distribution of Smoking Exposure for initial and derived
variables for cases diagnosed and controls selected between
1996-2010 and 2008-2010, KPNC. ………...125
Table A3 Missing data on smoking dose (packs per day) and duration
(years of smoking) among cases and matched controls within
the KPNC cohort, 2008-2010……….126
Table A4 Development of cut points for packs per day smoking variable
for the association between air pollutants and PTB.………..128
Table A5 Development of cut points for years of smoking variable for
the association between air pollutants and PTB. ………...129
Table A6 Unconditional logistic regression estimated adjusted* odds
ratios (OR) and 95% confidence intervals (CI) for the
xiii
tuberculosis disease, among cases diagnosed and controls
selected between 1996-2010, KPNC (a) results prior to imputation;
(b) results following imputation………..130
Table A7 Conditional logistic regression estimated adjusted* odds
ratios (OR) and 95% confidence intervals (CI) for the
associations between “Tobacco” smoking status, duration and dose, and pulmonary tuberculosis disease, among cases diagnosed
and controls selected between 2008-2010, KPNC ……….131
Table A8 Conditional logistic regression estimated adjusted* odds
ratios (OR) and 95% confidence intervals (CI) for the
association between “Derived” smoking status and pulmonary tuberculosis disease, among cases diagnosed and controls selected
between 1996-2010, KPNC………131
Table A9 Distance (mi.) of residence from closest ambient pollutant
monitors for the KPNC cohort, 1996-2010..………..136
Table A10 Mean and percentile distribution of estimates of average
ambient criteria air pollution concentrations cumulated over the 24-month period prior to the pulmonary tuberculosis (PTB) diagnosis/entry into study for cases/matched controls nested within the 1996-2010 KPNC membership with available
pollutant monitoring data………...137
Table A11 Two tailed t-test to compare the means of ambient criteria
air pollutant concentrations at the closest monitor to subject residences cumulated over the 24-month period prior to the pulmonary tuberculosis (PTB) diagnosis/entry into study for never and ever smokers nested within the 1996-2010 KPNC
membership.………....138
Table A12 Spearman correlation coefficients† for ambient criteria air
pollutant concentrations at the closest monitor to subject residences, 0-24 months, among pulmonary tuberculosis (PTB) cases and matched controls nested within the 1995-2010 KPNC
membership. ………..…139
Table A13 Adjusted* odds ratios (ORs) and 95% confidence intervals
(CIs) for the associations of pulmonary tuberculosis (PTB) and quintile increase in ambient criteria air pollutants concentrations, 0-24 months, among all cases and matched controls nested within the 1996-2010 KPNC membership, and stratified by
xiv
Table A14 Adjusted* odds ratios (ORs) and 95% confidence intervals
(CIs) for the associations of pulmonary tuberculosis (PTB) and quintile increase in ambient criteria air pollutants concentrations, 0-24 months, among all cases and matched controls nested
within the 1996-2010 KPNC cohort.……….144
Table A15 Adjusted* odds ratios (ORs) and 95% confidence intervals
(CIs) for the associations of pulmonary tuberculosis (PTB) and quintile increase in ambient criteria air pollutants concentrations, 0-24 months, among never smoker cases and matched controls
nested within the 1996-2010 KPNC cohort.……….……146
Table A16 Adjusted* odds ratios (ORs) and 95% confidence intervals
(CIs) for the associations of pulmonary tuberculosis (PTB) and quintile increase in ambient criteria air pollutants concentrations, 0-24 months, among ever smoker cases and matched controls
xv
LIST OF FIGURES
Figure 1.1 Trends in TB Cases in Foreign-born Persons, United States,
1996-2010………..24
Figure 1.2 Reported TB Cases by Origin and Race/Ethnicity*, United States, 2009………...25
Figure 1.3 Sources of all air pollutants measured in California……….26
Figure 1.4 Conceptual Diagram for the association of air pollution, smoking, and pulmonary tuberculosis (PTB).……….27
Figure 1.5 Smoking prevalence among California adults, 1984-2010………..29
Figure 1.6 Overall annual rate of pulmonary TB in NC, 1993-2007………30
Figure 2.1 Counties covered by Kaiser Permanente Northern California……….55
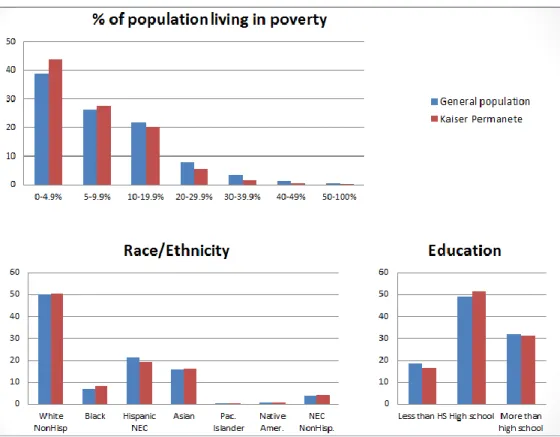
Figure 2.2 Comparability of KPNC Members to the General CA population……….56
Figure 2.3 Available PM2.5 pollutant monitors in California………58
Figure 2.4 Available PM10 pollutant monitors in California……….59
Figure 2.5 Available SO2 pollutant monitors in California………...60
Figure 2.6 Available NO2 pollutant monitors in California………..61
Figure 2.7 Available O3 pollutant monitors in California...62
Figure 2.8 Available CO pollutant monitors in California………63
Figure 4.1 Adjusted* odds ratios (ORs) and 95% confidence intervals (CIs) for the associations of pulmonary tuberculosis (PTB) and quintile in the estimates of ambient criteria air pollutants concentrations within the 24 months prior to diagnosis date, among all cases and matched controls nested within the 1996-2010 KPNC membership………..104
Figure 4.2 Adjusted* odds ratios (ORs) and 95% confidence intervals
xvi
(ever vs. never smokers).………105
Figure A1 Directed acyclic graph for the association between air pollution
and pulmonary tuberculosis (PTB).………122
Figure A2 Directed acyclic graph for the association between smoking status
and pulmonary tuberculosis (PTB).………123
Figure A3 Spline plots of association between (a) packs of cigarettes
smoked per day and PTB (b) years of smoking and PTB……….….127
Figure A4 Distribution of mean monthly air pollution for cases and controls
in KPNC cohort across 24 months prior (lags 0-24) to PTB
diagnosis/entry into study, 1994-2010.………..134
Figure A5 Exploring use of quintiles as a categorization for non-linear air
pollution exposure variables: Odds ratios and 95% confidence intervals for the associations of air pollution (lag 6 months) and PTB comparing quintiles of exposure to lowest level quintile
(Q1) as a reference group………...135
Figure A6 Adjusted* odds ratios (ORs) and 95% confidence intervals (CIs)
for the associations of pulmonary tuberculosis (PTB) and quintile increase in ambient criteria air pollutants concentrations within the 24 months prior to diagnosis date, among all cases and matched
controls nested within the 1996-2010 KPNC membership. ……….140
Figure A7 Adjusted* odds ratios (ORs) and 95% confidence intervals (CIs)
for the associations of pulmonary tuberculosis (PTB) and quintile increase in ambient criteria air pollutants concentrations within the 24 months prior to diagnosis date, among all cases and matched controls nested within the 1996-2010 KPNC membership stratified
xvii
LIST OF ABBREVIATIONS
CA California
CARB California Air Resources Board CI confidence interval
CO carbon monoxide
COPD chronic obstructive pulmonary disease DOTS Directly Observed Therapy Shortcourse ECD electronic clinical database
EPA Environmental Protection Agency HIV human immunodeficiency virus
INF interferon
IGRA interferon gamma release assay IQR interquartile range
KPNC Kaiser Permanente Northern California MDR multiple drug resistant
NO2 nitrogen dioxide
O3 ozone
OR odds ratio
PM10 particulate matter (particles less than 10µm in aerodynamic diameter) PM2.5 particulate matter (particles less than 2.5µm in aerodynamic diameter) PTB pulmonary tuberculosis
xviii
SO2 sulfur dioxide
TB tuberculosis
TNF tumor necrosis factor TST tuberculosis skin test U.S. United States
SPECIFIC AIMS
Understanding cofactors that may increase TB susceptibility is necessary to inform intervention programs aimed at reducing TB transmission. High levels of ambient air pollution are common in many high TB prevalence areas, and have been previously associated with several adverse health outcomes. Air pollution may increase the risk of progression of LTBI to PTB through changes in the adaptive immune system. Utilizing data from Kaiser Permanente Northern California (KPNC), a large and diverse integrated health care delivery system, I evaluated the association between individual estimates of ambient air pollution and incident pulmonary tuberculosis (PTB) disease among California (CA)
residents. Specific Aims were as follows:
Specific Aim 1. Estimate the magnitude of the association between long-term,
24-month exposure to air pollution (SO2, NO2, CO, O3, PM10 and PM2.5 levels) and development of incident active PTB.
Hypothesis: Adults are at higher risk of developing PTB if they reside in areas with high air pollution levels, measured by SO2, NO2, CO, O3, PM10 and PM2.5 levels.
2
Environmental Protection Agency (EPA) monitoring sites. Building upon this finding, a nested case-control study was proposed to determine whether the risk of developing incident PTB is associated with individual-level estimates of air pollution concentrations. Cases and controls were identified from the KPNC membership.
Specific Aim 2. Evaluate whether there is a positive association between cigarette
smoking and incident PTB disease, and to test whether smoking is a confounder and/or effect modifier of the association between air pollution levels and TB.
Hypothesis: Smokers will be at a higher risk of developing TB, and thus smokers who reside in areas with high air pollution levels may be at an even higher risk of developing TB than nonsmokers.
Rationale: The few epidemiologic studies which have focused on whether smoking is associated with TB are inconsistent. Those that have found an association, the odds ratio (OR) estimates range from 0.80 (95% confidence intervals (CI): 0.34-1.89) to 4.62 (95%CI: 2.44-8.73) for smokers as compared with non-smokers (Lin 2007). Because smoking is a potential confounder or effect modifier of the primary aim, this association was evaluated among the same Kaiser TB patients and control population. To assess smoking status, data was abstracted from the electronic clinical data maintained by KPNC.
3
by age, gender, and race/ethnicity. Primary exposures of interest included monthly averages of ambient air pollution as measured by local monitors. Pollutant concentrations at monitors located closest to residential address was utilized to estimate individual-level exposure. Logistic regression models were used to derive the effect estimate for the association
CHAPTER 1
BACKGROUND
Epidemiology of Tuberculosis
Tuberculosis (TB) dates back to ancient history, confirmed with evidence of TB found in the remains Egyptian mummies from as far back as 4000BCE (Rothschild 2001, Zink 2003). In the 1600s, one out of every four deaths in Europe was due to TB. It was not until that 1882 Robert Koch identified Mycobacterium tuberculosis as the bacillus
responsible for TB.
Improvements in living conditions, the introduction of effective public health preventive measures and the development of effective antibiotics, helped to bring
tuberculosis somewhat under control during the second half of the 20th century (Tremblay 2007). However, the surfacing of HIV/AIDS and increase in drug-resistant TB, led to a resurge of cases in many areas (Paolo 2004). As a result, the World Health Organization (WHO) declared TB a global health emergency and implemented Directly Observed Treatment Short course (DOTS). Over 183 countries currently use the DOTS strategy in efforts to eliminate TB across the globe.
5
effective than first-line drugs and cause toxic side effects; these include include streptomycin, cycloserine, capreomycin, ethionamide, and levofloxacin among others. Treatment generally lasts approximately 6 months and is highly effective in abating TB. Although public health has come a long way to control TB, we are still a long way from elimination. Rates have dramatically declined in the US throughout the years, but TB has remained a significant public health problem in the less developed countries (WHO 2010).
It is estimated that approximately one-third of the world’s population is currently infected with Mycobacterium tuberculosis; 10 percent of which will develop tuberculosis disease during their lifetime. According to the World Health Organization between 2002 and 2020, roughly one billion people will develop tuberculosis infection, over 150 million will become ill, and 36 million will die from the disease (WHO 2010).
Most of the infected will have no symptoms, but those who become ill from the disease often experience prolonged debilitating symptoms including coughing, sputum production, chest pain, loss of appetite, weight loss, fatigue, night sweats, chills and fever (NIEHS 1998). Initial symptoms are generally mild, often being mistaken for the flu or a lingering cold, but do not subside. Symptoms worsen with progression of the disease, resulting in severe coughing and blood in the sputum, an indication of damage to blood vessels in the lungs. Left untreated, 40-60% of active TB cases result in death (Yancey 2008).
TB Infection and Disease
6
most common form of the disease is pulmonary tuberculosis, however, tuberculosis can attack almost any part of the body (Kumar 2007).
TB is spread from person to person through the air, usually when infected people cough and sneeze and others inhale infectious droplets circulating in the air. TB cannot be transferred from items touched by an infected person, but in rare cases may be spread through open wounds and from mother to child before and during birth (CDC 2009). Infection occurs when inhaled mycobacteria are engulfed by alveolar macrophages and survive in the phagosomes of these cells. In a person with an intact immune system, the cells of the immune system assemble a wall around the infected macrophages, preventing
symptomatic infection. This state is referred to as latent tuberculosis infection. When the body’s defenses are not capable or lose the ability to wall off the infection, the host develops active tuberculosis. Persons with active pulmonary tuberculosis are usually symptomatic and capable of passing the infection on to other people (WHO 2010).
7
TB Risk Factors
Individuals at higher risk of developing active tuberculosis disease include the elderly, the chronically ill including people with HIV/AIDS, the poor, immigrants, minorities, and healthcare and prison staff.
Many of the elderly were previously exposed to TB years ago and have been able to fight off the infection; however, as they age, many suffer from chronic diseases and
malnutrition, which weaken the immune system. In addition, the elderly often live in long term care facilities where they are at greater risk for exposure to others with TB. It is often difficult to recognize their TB symptoms as weight loss and fatigue, are common in the elderly.
Individuals with chronic illnesses, such as cancer, diabetes and kidney disease, often have weakened immune systems and as a result are at greater risk for developing TB. Even those that are malnourished and have extremely low body weight are at increased risk for TB. Persons with HIV/AIDS are at extremely high risk for progressing from latent to active TB. While only 10% of healthy individuals infected with TB will develop the disease over a lifetime, this same percentage of HIV positive individuals infected with TB will develop active TB disease every year if not treated with anti-retrovirals. The fact that some HIV/AIDS infected people are drug addicts or homeless already prone to infection only compounds the problem.
8
whole (Yancey 2008). The homeless frequently live and sleep in overcrowded shelters and many suffer from malnourishment, drug abuse and/or alcoholic addictions and have little or no access to healthcare.
In the US, TB rates are higher among foreign-born persons (Figure 1.1). Many immigrants come from countries where TB is endemic and prevention of latent TB is not a priority. In addition, language and communication barriers often cause problems as
immigrants as it may hinder immigrants’ ability to understand instructions, take medicine correctly, and return for follow up visits.
The large proportion of TB cases arising from blacks, however, cannot be explained by migration (Figure 1.2). While TB is known to be more prevalent among minorities, Blacks in the US, carry a very disproportionate burden of the disease. Increased risk for TB is not only a problem for Blacks, but for Hispanics, Native Americans, and Asians as well. Many argue that the increased risk for TB associated with minorities is actually a bi-product of lower SES because minorities are more likely to experience conditions such as
malnutrition, homelessness, and limited access to healthcare, all of which are risk factors for TB.
9
TB Prevalence
In 2009 there were almost 9.4 million incident cases and 14 million prevalent cases of TB worldwide, resulting in more than 1.3 million deaths among HIV-negative people and 0.38 million deaths among HIV-positive people attributed to TB (WHO 2010). The largest number of newly detected TB cases occurs in the South-East Asia Region, making up 35% of incident cases globally. The estimated incidence rate in sub-Saharan Africa is more than 350 cases per 100,000. Tuberculosis control has been greatly complicated by the appearance of drug-resistant strains, including those resistant to isoniazid and rifampicin (multiple drug resistant, MDR), those resistant to isoniazid, rifampicin, floroquinolone, and one or more injectable drugs (extensively drug resistant, XDR) and totally drug resistant (TDR). Cases of MDR and XDR tuberculosis are very expensive and difficult to treat and have raised the specter of a strain that is almost completely untreatable. The problem of MDR and XDR tuberculosis is acute in Russia, South Africa, and other countries where resources and modern infection control facilities are limited (Amukoye 2008).
10
Air Pollution and Tuberculosis
Epidemiology of Air Pollution
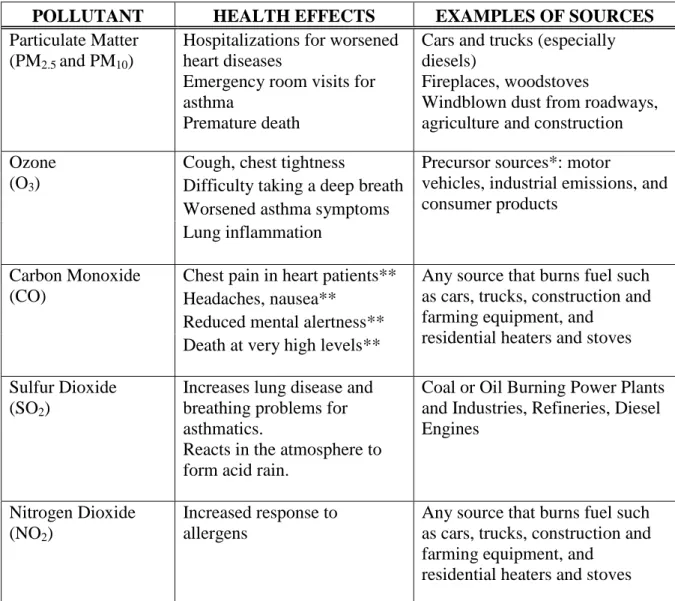
Air pollution refers to substances in the air capable of causing harm to humans and the environment (Table 1.1). This general term is used to describe not just one constituent, but a complex mixture sometimes containing hundreds of components. Some pollutants, like smog, are visible to the human eye, while others, such as carbon monoxide (CO), go
undetected. These undesirable elements may be in solid, liquid, or gaseous form and can be natural or man-made. Naturally occurring air pollution can be formed by volcano eruptions, forest fires, dust storms, and even interactions among other pollutants. Air pollution caused by humans, however, is a much larger problem, because this pollution is avoidable and modifiable. Pollutants produced by human activity are numerous in sources including, but not limited to, power plants, manufacturing facilities, marine vessels, aircraft, motor vehicles, controlled burning, chemicals, waste deposition in landfills, furnaces and other fuel-burning heating devices and fumes from paint and aerosol sprays (CARB 2010). Because there are so many causes and sources of air pollution, this mixture is often difficult to elucidate,
particularly in outdoor air pollution where many of the coexisting pollutants are also highly correlated (Briggs 1997).
11
factors, as well as industrial factors. A prime example of how these factors can affect levels of air pollution can be seen in California, where more than 90% of residents are exposed to unhealthy levels of outdoor air pollution during some portion of the year (CARB 2010). Here, wind patterns and mountain ranges allow air pollution to be trapped into cities, often resulting in smog. These naturally occurring events conducive to the formation of ambient air pollution are also compounded by an abundance of motor vehicle traffic (more cars per household than any other state), major ports, and oil refineries (Figure 1.3) (BAAMQD 2010).
While levels of air pollution have continually dropped in the US and other developed countries in recent years, levels in developing countries remain high and are even increasing in many areas. The persistence of ambient air pollution remains a major public health problem as millions die each year from causes directly related to air pollution. There has been an abundance of research studies showing some relationship between ambient air pollution and adverse health effects. In previous research even relatively low concentrations of air pollution have been shown to be associated with adverse health effects (WHO 2011).
12
People in urban areas of developing countries are exposed to the highest levels of outdoor air pollution in the world. Each year outdoor air pollution imposes an estimated burden of hundreds of thousands of deaths and millions of years of healthy life lost from cardiovascular disease, selected respiratory diseases, and lung cancer (Iwai 2005, Downs 2007, Fullerton 2008). In addition to respiratory effects noted above, ambient air pollution has also previously been linked with pneumococcal disease, caused by bacteria which can lead to pneumonia and meningitis, so this type of association between air pollution and infectious disease is not unprecedented (Kim 1996).
The immune response has long been a sensitive indicator for detecting adverse effects of ambient air pollution (Wang 1989, Wei 2001). Wang et al. studied the immune function of children living in various ambient and indoor air pollution exposure levels. The immune function of pupils living in mildly polluted areas but whose family used coal for cooking was inhibited more than was the immune function of pupils residing in heavily polluted areas but whose family used gas for cooking. The immune function of pupils living in mildly polluted areas and using gas for cooking faired the best. While indoor air pollution may play a role in the immune function of children, ambient air pollution could also affect immune processes and should not be neglected (Wang 1989, Chen 2004).
Air Pollution and Tuberculosis: Animal Studies
13
exposed to diesel exhaust for 1, 2, or 6 months. Following the last exposure day, exposed and unexposed mice were aerially infected with Mycobacterium tuberculosis and seven weeks post infection, the lung tissues were examined. After 6 months of diesel exhaust exposure, the expression levels of interleukin-10, interferon-gamma, and inducible NO synthase mRNAs were decreased, and the mycobacterial load in the mice increased approximately four-fold (Hiramatsu 2005).
Air pollution exposures in murine models were shown to reduce tumor necrosis factor (TNF)-α and interferon-gamma (IFN-γ) production (Saito 2002b). This is noteworthy
because TNF-α and IFN-γ play a central role in containing and inhibiting the growth of mycobacterium (Flad 1995, Döffinger 2004, Fremond 2005). These findings suggest that ambient air pollution affects immune processes that can affect TB. Further, the inhibition of TNF-α by drugs in clinical trial has been linked to TB reactivation, implying that the
association in mice may be applicable to humans (Jacobs 2007).
Air Pollution and Tuberculosis: Human Studies
14
epidemics in the West and may contribute to the continual burden of TB in developing parts of the world.
A different study explored the seasonal fluctuations of TB incidence, and found that along with various climatic factors, atmospheric pollutants (including NO, CO, and SO2) affected TB incidence (Shilova 2004). These results are suggestive, but to date there are no published epidemiological studies that have specifically evaluated the association
between estimated individual-level outdoor air pollution concentrations and incident
PTB. If air pollution exposure increases the risk of infection, illness, or death from
tuberculosis, then the attributable burden of disease would be even greater. Given that tuberculosis infection is endemic in many developing countries, even a small increase in the risk for tuberculosis disease could translate into a large attributable burden (Cohen 2007). Thus, research on outdoor air pollution and tuberculosis is important.
Air pollution from outdoor sources, including motor vehicles, industry, and solid waste burning, is associated with increased morbidity and mortality from respiratory
infections in children and adults (Lin 2007). In recent years, air pollution has been identified as a possible risk factor for tuberculosis. Mishra et al. linked biomass cooking fuels and tuberculosis based on a 1992–1993 survey of 90,000 households in India. This study found that women in households using biomass cooking fuels are three times more likely to report tuberculosis than those in households using cleaner fuels (Mishra 1999). Miners in coal and gold mines are also prone to tuberculosis, although it is considered, at least in part, an effect of silicosis (Rockette 1977).
15
pollution and tuberculosis. In Shenyang, China an ecological analysis was used to study chronic effects of air pollution on mortality in 1992. The analysis showed a significant association between daily mortality and daily ambient levels of total suspended particulates (TSP) and SO2. Considerable increases in these pollutants led to significant increases in mortality from COPD (chronic obstructive pulmonary disease), cerebrovascular disease, cardiovascular disease, cancer (all sites combined), and tuberculosis disease, as well as total mortality (Xu 1995).
The proposed nested case-control study will be the first epidemiologic
investigation to formally evaluate the hypothesis that individual-level estimates of air
pollution concentrations will be associated with an increased risk of incident pulmonary
TB. My hypothesis is that given the ubiquitous exposure to Mycobacterium tuberculosis, the causative agent of PTB, other co-factors are likely to play a role in influencing susceptibility to and progression of TB disease. Experimental data in vivo and in vitro and ecologic
analyses undertaken in human populations support the hypothesis that air pollution, by increasing inflammation and decreasing immune response, will increase the risk of developing pulmonary TB disease (Figure 1.4).
Smoking and Tuberculosis
Epidemiology of Smoking
16
equate smoking with cancer, but according to the CDC, smoking causes harm to almost every organ in the human body. Cigarette smoking wreaks havoc on the general health of smokers and is commonly the cause of disease, especially cancer, heart disease, and respiratory diseases (CDC 2010).
Although most people think of active smoking when considering potential health effects, passive smoking can also be a health hazard. Passive smoking can be experienced through secondhand smoke (SHS), also known as environmental tobacco smoke (ETS). SHS can result from a smoke remaining following the burning of a cigarette, cigar, or pipe, or from smoke exhaled by individuals in the process of smoking. ETS exposures occur most frequently in homes, workplace, and restaurants. Chemical analyses have shown over 4,000 different compounds present in ETS, many of which are carcinogens (CDPH 2009). Cigarette smoking, including the resulting SHS exposure, is the number one cause of preventable deaths in the US, accounting for 443,000 (or 1 out of every 5) deaths each year (CDC 2010).
17
globally and still, approximately 10 million cigarettes are sold worldwide every minute (WHO 2002).
Cigarette Smoking and Tuberculosis: Animal Studies
Cigarette smoking is known to increase the risk of respiratory tract infection by several mechanisms, including inducing inflammation, increasing mucosal perviousness, impairing mucociliary clearance, enhancing pathogen adherence, disrupting the respiratory epithelium, and altering immune function (Benowitz 2010).
Several studies have been conducted that suggest there may be a link between
exposure to cigarette smoke and increased susceptibility to TB disease. A study conducted by Chan et al. found an association between the number of cigarettes smoked in the household and the risk of developing active TB among exposed individuals (Chan 2010).
In an animal experiment (Shang 2011), mice were exposed to cigarette smoke for 14 weeks and thereafter exposed to aerosolized Mycobacterium tuberculosis. Results showed that mice exposed to cigarette smoke had more mycobacteria isolated from the lungs and spleens after 14 and 30 days than control mice. Cigarette smoke exposed mice also had worse lung lesions, less macrophages producing IL-12 and TNF-α, and fewer INF-γ and TNF-α producing CD4 and CD8 cells.
18
infected macrophages from two healthy nonsmokers with TB alone or with 10% cigarette smoke extract, 1 lg/mL nicotine, or 30 lmol/L acrolein. After only four days of infection, there was significantly more mycobacterium TB bacilli in the cells with cigarette smoke extract, nicotine, or acrolein compared with that in the alveolar macrophages infected with TB alone. Levels of TNF-α were decreased by 42%, 41%, and 28% by the cigarette smoke extract, nicotine, and acrolein, respectively (Shang 2011).
Investigators believe that nicotine in the cigarette smoke prevents macrophages in the lungs from producing TNF-α, and in the absence of this cytokine, reactivation of TB is more likely to occur (Davies 2006). Considering the increasing number of studies pointing to a plausible connection, this hypothesis warrants further examination.
Cigarette Smoking and Tuberculosis: Human Studies
Cigarette smoking is increasing worldwide, particularly in resource-poor countries. The geographic overlap between areas of the world with a high prevalence of cigarette smoking and regions with the most cases of latent and active TB cases is striking. China and India not only parallel in top rankings in the number of smokers, but also rank as the two countries with the largest number of active TB cases (1.4 million and 1.9 million,
respectively) (Chan 2010, Hassmiller 2006).
19
conducted a meta-analysis to explore the link between tobacco smoking and the risk of TB attributed infection, disease, and death. Included in the analysis were observational studies reporting effect estimates and 95% confidence intervals on how tobacco smoking, is associated with tuberculosis. Substantial evidence was found that tobacco smoking is
positively associated with all tuberculosis outcomes, and that passive smoking and indoor air pollution from biomass fuel combustion are also possibly associated with tuberculosis disease (Lin 2007).
Several studies have found that cigarette smoking to be a risk factor for tuberculosis infection, tuberculosis disease, severe forms of tuberculosis disease, and death from
tuberculosis, however, a few have not found this association. The odds ratio (OR) estimates range from 0.80 (95% confidence intervals (CI): 0.34-1.89) to 4.62 (95%CI: 2.44-8.73) for smokers as compared with non-smokers (Gajalakshmi 2003, Hassmiller 2006, den Boon 2007, Lin 2007). Despite current building evidence, CDC does not record smoking in the present surveillance system. This study may offer additional evidence that cigarette smoking is an important factor in the susceptibility to developing tuberculosis disease.
Preliminary Study
20
prevalence of the exposure and the outcome are lower than have been reported in studies conducted in developing countries.
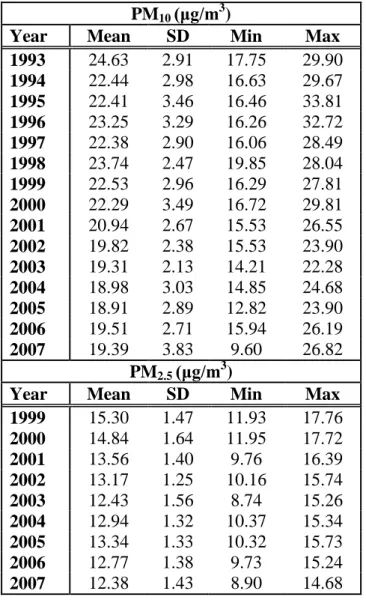
All physician-reported cases of tuberculosis disease during the study period were considered for this analysis, and annual averages of county level particulate matter (Table 1.2) were used to define case exposure to air pollution. During the study period there were 5319 reported cases of pulmonary tuberculosis disease total in NC.
The overall rate of pulmonary tuberculosis disease in North Carolina was 4.41 per 100,000 person-years from 1993 to 2007. Figure 1.6 illustrates how the rates and frequency of diagnosed tuberculosis disease cases in North Carolina have declined nearly
monotonically since 1993.
Table 1.3 shows rate ratios for pulmonary TB in relation to PM10 and PM2.5 after
adjustment for age, gender, race, and year of diagnosis and then after adjustment in a co-pollutant model. Elevated PM2.5 tended to have larger incidence rate ratios than PM10, although there was inconsistency across the highest PM categories. Before adjustment for confounding variables, all quintiles of particulate air pollution above the lowest had elevated incidence rate ratios, suggesting that any exposure above the lowest quintile was associated with a higher rate of tuberculosis disease. However, adjustment for confounders weakened the observed associations.
21
result, no data for this pollutant could be analyzed before that year. Additionally, the number of PM10 monitors in NC declined by one-third in 1998 and then by half in 2003.
The true effects of air pollution on tuberculosis may be other than estimated here, for numerous reasons. Primarily, individuals are typically exposed to a mixture of air pollutants, whereas these data include information only on PM10 and PM2.5. The estimated effects may be attenuated to the extent that a mix of pollutants could trigger tuberculosis disease, rather than solely PM10 and PM2.5. In addition, county level measures, adapted from local monitors, are not an ideal measure of exposure to air pollution. Interpretation also must consider temporal ambiguity complicated by an unknown latency period. It should also be noted that the trends for particulate matter air pollution and reported TB disease during the period both declined similarly throughout the period. While there could be many causes of this
correlation, the possibility that TB disease rates could be influenced by pollutants outside of county lines should be considered.
22
as a result. This history is important, because the effects of air pollution on the risk of tuberculosis disease could be cumulative over time.
None of the rate ratios was meaningfully below 1.0, consistent with the possibility of a threshold effect. This investigation was a first step in exploring the association between ambient air pollution and TB, and motivating us to further investigate the study hypothesis by improving upon the study design and exposure assessment methods.
Summary
Mycobacterium tuberculosis is the causative agent of TB disease. Laboratory experiments demonstrate that it is biologically plausible that environmental factors may influence progression from TB infection to active disease (Saito 2002a, Saito 2002b, Hiramatsu 2005, Bonay 2006). Experimental results are supported by ecologic analyses in humans. Comprehensive understanding of the disease’s risk factors is essential to the control of TB. Although recent TB studies in humans have focused on the influence of HIV,
alcohol, and other co-factors (den Boon 2007, Kolappan 2007), none have assessed the impact of personal ambient air pollution concentrations. Because of the high PTB burden, the increasing air pollution levels worldwide, and the biologic plausibility of a possible link between the two, the putative association between modifiable environmental exposures and TB deserves exploration.
23
investigate incident pulmonary tuberculosis disease in relation to levels of ambient air
24
Chapter 1 Figures and Tables
Figure 1.1 Trends in TB Cases in Foreign-born Persons, United States, 1996–2010.
25
Figure 1.2 Reported TB Cases by Origin and Race/Ethnicity*, United States, 2009.
(a) U.S. born
(b) Foreign born
26
Figure 1.3 Sources of all air pollutants measured in California
*Residential fuel combustion, farming operations, construction, road dust, wind-blown dust, fires, waste burning, utility equipment and other miscellaneous processes.
Data Source: California Air Resources Board Emissions Inventory report
27
Figure 1.4 Conceptual Diagram for the association of air pollution, smoking, and pulmonary
tuberculosis (PTB).
Adapted from: Tremblay (2007). Air
Pollution
↓ TNF-α
PTB Disease
↓ IFN- γ
No granuloma formation
↓ NO generation
Inability to contain TB infection
28
Table 1.1 Health effects of common air pollutants.
POLLUTANT HEALTH EFFECTS EXAMPLES OF SOURCES
Particulate Matter (PM2.5 and PM10)
Hospitalizations for worsened heart diseases
Emergency room visits for asthma
Premature death
Cars and trucks (especially diesels)
Fireplaces, woodstoves
Windblown dust from roadways, agriculture and construction Ozone
(O3)
Cough, chest tightness Precursor sources*: motor
vehicles, industrial emissions, and consumer products
Difficulty taking a deep breath Worsened asthma symptoms Lung inflammation
Carbon Monoxide (CO)
Chest pain in heart patients** Any source that burns fuel such as cars, trucks, construction and farming equipment, and
residential heaters and stoves Headaches, nausea**
Reduced mental alertness** Death at very high levels** Sulfur Dioxide
(SO2)
Increases lung disease and breathing problems for asthmatics.
Reacts in the atmosphere to form acid rain.
Coal or Oil Burning Power Plants and Industries, Refineries, Diesel Engines
Nitrogen Dioxide (NO2)
Increased response to allergens
Any source that burns fuel such as cars, trucks, construction and farming equipment, and
residential heaters and stoves
Data Source: http://www.arb.ca.gov/research/health/fs/fs1/fs1.htm
*Ozone is not generated directly by these sources. Rather, chemicals emitted by these precursor sources react with sunlight to form ozone in the atmosphere.
29
Figure 1.5 Smoking prevalence among California adults, 1984-2010
30
Figure 1.6 Overall annual rate of pulmonary TB in NC, 1993-2007
31
Table 1.2 Mean ± standard deviation of particulate matter air pollution concentrations in
North Carolina, 1993-2007.
PM10 (μg/m3)
Year Mean SD Min Max
1993 24.63 2.91 17.75 29.90
1994 22.44 2.98 16.63 29.67
1995 22.41 3.46 16.46 33.81
1996 23.25 3.29 16.26 32.72
1997 22.38 2.90 16.06 28.49
1998 23.74 2.47 19.85 28.04
1999 22.53 2.96 16.29 27.81
2000 22.29 3.49 16.72 29.81
2001 20.94 2.67 15.53 26.55
2002 19.82 2.38 15.53 23.90
2003 19.31 2.13 14.21 22.28
2004 18.98 3.03 14.85 24.68
2005 18.91 2.89 12.82 23.90
2006 19.51 2.71 15.94 26.19
2007 19.39 3.83 9.60 26.82
PM2.5 (μg/m3)
Year Mean SD Min Max
1999 15.30 1.47 11.93 17.76
2000 14.84 1.64 11.95 17.72
2001 13.56 1.40 9.76 16.39
2002 13.17 1.25 10.16 15.74
2003 12.43 1.56 8.74 15.26
2004 12.94 1.32 10.37 15.34
2005 13.34 1.33 10.32 15.73
2006 12.77 1.38 9.73 15.24
2007 12.38 1.43 8.90 14.68
SD= standard deviation
32
Table 1.3 Comparison of crude and adjusted incidence rate ratios of pulmonary TB for
ambient PM exposure in North Carolina.
Crude Adjusted*
IRR (95%CI) IRR (95%CI)
PM10† <19.05 Ref Ref
(μg/m3
) 19.06-21.08 1.20 (1.07, 1.34) 1.21 (0.97, 1.51)
21.09-22.78 1.09 (0.97, 1.23) 0.96 (0.76, 1.20)
22.79-24.92 1.17 (1.05, 1.31) 1.00 (0.79, 1.26)
≥24.93 1.44 (1.30, 1.60) 1.22 (0.98, 1.52)
PM2.5‡ <11.94 Ref Ref
(μg/m3
) 11.95-12.91 1.38 (1.15, 1.66) 1.29 (0.97, 1.71) 12.92-13.75 1.28 (1.09, 1.50) 1.27 (1.00, 1.62) 13.76-14.68 1.13 (0.96, 1.32) 1.09 (0.86, 1.39)
≥14.68 1.34 (1.14, 1.56) 1.06 (0.80, 1.40)
Data Source:Smith 2013 †
Analysis includes years 1993 - 2007 ‡
Analysis includes years 1999 - 2007
33
References
Amukoye E. (2008). Multi drug resistant tuberculosis: a challenge in the management of tuberculosis. African Journal of Health Sciences. 15(1-2): 6-13.
Bay Area Air Quality Management District (BAAMQD). (2010). “Air Quality in the Bay Area”. http://www.baaqmd.gov/Divisions/Communications-and-Outreach/Air-Quality-in-the-Bay-Area.aspx. Accessed on August 20, 2011.
Benowitz NL. (2010). Secondhand Smoke and Infectious Disease in Adults: A Global Women's Health Concern. Arch Intern Med. 170(3):292-293.
Bonay M, Chambellan A, et al. (2006). Effects of diesel particles on the control of
intracellular mycobacterial growth by human macrophages in vitro. FEMS Immunology & Medical Microbiology. 46(3): 419-425.
Briggs D, Collins S, et al. (1997). Mapping urban air pollution using GIS: a regression-based approach. International Journal of Geographical Information Science. 11(7): 699-718. California Air Resources Board (CARB). (2010). “What is air pollution?”
http://www.arb.ca.gov/ch/educational/definition.htm. Accessed on August 20, 2011. California Department of Public Health (CDPH). (2009). “California Tobacco Control Program”. California Tobacco Control Update 2009: 20 Years of Tobacco Control in California: Sacramento, CA.
California Department of Public Health (CDPH). (2010). “Tobacco Control Fact Sheets”.
http://www.cdph.ca.gov/programs/tobacco/Pages/CTCPFactSheets.aspx. Accessed on August 20, 2011.
Chan ED. (2010). Should Cigarette Smoke Exposure Be a Criterion to Treat Latent Tuberculosis Infection? Am J Respir Crit Care Med. 182(8):990-2.
Chen B and Kan CHH. (2004). Exposures and health outcomes from outdoor air pollutants in China. Toxicology. 198(1-3): 291-300.
Centers for Disease Control and Prevention (CDC). (1997). Case definitions for infectious conditions under public health surveillance. MMWR: 40-41.
Centers for Disease Control and Prevention (CDC). (2009). “Tuberculosis (TB)”.
http://www.cdc.gov/tb/statistics/reports/2009/pdf/report2009.pdf. Accessed on December 8, 2010.
Centers for Disease Control and Prevention (CDC). (2010). “Adult Cigarette Smoking in the United States: Current Estimate”.
34
Cohen A and Mehta S. (2007). Pollution and Tuberculosis: Outdoor Sources. PLoS Med 4(3): e142.
Davies PD, Yew WW, Ganguly D, et al. (2006).Smoking and tuberculosis: the
epidemiological association and immunopathogenesis. Transactions of the Royal Society of Tropical Medicine and Hygiene 100(4): 291-298.
den Boon S, Verver S, et al. (2007). Association Between Passive Smoking and Infection With Mycobacterium tuberculosis in Children. Pediatrics. 119(4): 734-739.
Döffinger R, Helbert M, et al. (2004). Autoantibodies to Interferon-γ in a Patient with Selective Susceptibility to Mycobacterial Infection and Organ-Specific Autoimmunity. Clinical Infectious Diseases. 38:10-14.
Downs SH, Schindler C, et al. (2007). Reduced Exposure to PM10 and Attenuated Age-Related Decline in Lung Function. New England Journal of Medicine. 357: 2338-2347. Dye C. (2006). Global epidemiology of tuberculosis. The Lancet. 367: 938-940.
Flad H, Gercken J, et al. (1995). Cytokines in mycobacterial infections: in vitro and ex vivo studies. Arch Immunol Ther Exp. 43(2):153-8.
Fremond C, Allie N, et al. (2005). Membrane TNF confers protection to acute mycobacterial infection. Respiratory Research. 6:136-145.
Fullerton DG, Bruce N, et al. (2008). Indoor air pollution from biomass fuel smoke is a major health concern in the developing world. Transactions of the Royal Society of Tropical
Medicine and Hygiene. 102(9): 843-851.
Gajalakshmi V, Peto R, Kanaka TS, Jha P. (2003). Smoking and mortality from tuberculosis and other diseases in India: retrospective study of 43 000 adult male deaths and 35 000 controls. Lancet. 352:507-515.
Hiramatsu K, Saito Y, et al. (2005). The Effects of Inahalation Diesel Exhaust on Murine Mycobacterial Infection. Experimental Lung Research. 31: 405-415.
Hassmiller KM. (2006). The association between smoking and tuberculosis. Salud Publica Mex. 48(suppl I): S201-S216.
Holgate ST, Samet JM, Koren HS, Maynard RL. (1999). Air pollution and health. Iwai K, Mizuno S, et al. (2005). Correlation between suspended particles in the
35
Kim PE, Musher DM, Glezen WP, et al. (1996). Association of Invasive Pneumococcal Disease with Season, Atmospheric Conditions, Air Pollution, and the Isolation of Respiratory Viruses. Clin Infect Dis. 22 (1):100-106.
Kolappan C, Gopi PG, et al. (2007). Selected biological and behavioural risk factors
associated with pulmonary tuberculosis. The International Journal of Tuberculosis and Lung Disease. 11(9): 999-1003.
Kumar VA, Abul K, Fausto N, Mitchell RN. (2007). Robbins Basic Pathology.
Laden J. (2006). Reduction in fine particulate air pollution and mortality: extended follow-up of the Harvard Six Cities study. Am J Respir Crit Care Med. 173(6):667-72.
Leung CC. (2004). Smoking and Tuberculosis among the Elderly in Hong Kong. Am J Respir Crit Care Med. 170: 1027-1033.
Lin H, Ezzati M, et al. (2007). Tobacco Smoke, Indoor Air Pollution and Tuberculosis: A Systematic Review and Meta-Analysis. PLoS Med. 4(1):173-189.
Mishra V. (1999). Biomass cooking fuels and prevalence of tuberculosis in India. Int J Infect Dis. 3:119-129.
Pope CA. (2002). Lung cancer, cardiopulmonary mortality, and long-term exposure to fine particulate air pollution. JAMA. 287(9):1132-41.
Rockette H. (1977). Cause-specific mortality of coal miners. J Occup Med. (17):795-801. Saito Y, Azuma A, et al. (2002a). Long-term inhalation of diesel exhaust affects cytokine expression in murine lung tissues: comparison between low- and high-dose diesel exhaust exposure. Experimental Lung Research. 28:201-217.
Saito Y, Azuma A, et al. (2002b). Long-term inhalation of diesel exhaust affects cytokine expression in murine lung tissues: comparison between low- and high-dose diesel exhaust exposure. Experimental Lung Research. 28:493-506.
Shang S, et al. (2011). Cigarette Smoke Increases Susceptibility to Tuberculosis—Evidence From In Vivo and In Vitro Models. Journal of Infectious Diseases. 203(9): 1240-1248. Shilova M. and Glumnaia T. (2004). Influence of seasonal and environmental factors on the incidence of tuberculosis. Probl Tuberk Bolezn Legk. 2:17-22.
Tremblay GA. (2007). Historical statistics support a hypothesis linking tuberculosis and air pollution caused by coal [Review Article]. The International Journal of Tuberculosis and Lung Disease. 11: 722-732.
36
Wang J, Chen B., Hong C. (1989). The effects of indoor and outdoor air pollution on pupil’s immune function. J. Environ. Health. 6(4): 1-3.
Wei F, Hu W, Wu G, Chapman RS. (2001). Analysis of relation between air pollution and children’s lung function indexes. `Chin. Environ. Sci. 21(5): 385-389.
World Health Organization (WHO). (2011). “Air Quality and Health Fact Sheet." N313.
http://www.who.int/mediacentre/factsheets/fs313/en/. Accessed on September 14, 2011. World Health Organization (WHO). (2010). "Global tuberculosis control 2010.”
http://www.who.int/tb/publications/global_report/2010.Accessed on March 20, 2011. World Health Organization (WHO). (2002). “Smoking Statistics Fact Sheet."
http://www.wpro.who.int/media_centre/fact_sheets/fs_20020528.htm. Accessed on September 04, 2011.
Xu Z and Chen B. (1995). Air Pollution and its health effects in China. B. Chen, Geneva: World Health Organization: 47-88.
CHAPTER 2
RESEARCH METHODS
Study Design
The primary aim of the proposed large, population-based case-control study, nested within the Kaiser Permanente Northern California (KPNC) cohort membership, was to evaluate the hypothesis that individual-level estimates of concentrations of the six criteria air pollutants, SO2, NO2, CO, O3, PM10 and PM2.5, are associated with incident pulmonary TB. A secondary aim was to examine the association between active smoking and TB within the same study population.
A nested case-control study approach utilizing existing data from Northern California (CA) was utilized to address the study aims. The study population, drawn from the existing KNPC membership cohort, and includes 2380 incident cases of pulmonary TB (PTB) and 4738 matched controls without TB. Exposure assessment is based on individual air pollution concentrations, which are estimates derived using spatial and temporal analyses.
38
was made available for the proposed dissertation. Logistic regression was used to examine both the relationship between individual-level pollutant concentrations and PTB risk (aim 1), as well as, the association between ever smoking, as recorded in the electronic clinical data, and risk of PTB (aim 2).
Northern CA was an excellent geographic location in which to conduct this study. TB rates in CA are among the highest in the nation. The KNPC has a large electronic clinical database (ECD), which provides comprehensive medical and demographic data with which to identify and characterize a large number of TB cases and matched controls. Extensive air pollution data were available with considerable exposure spatial variability, based on
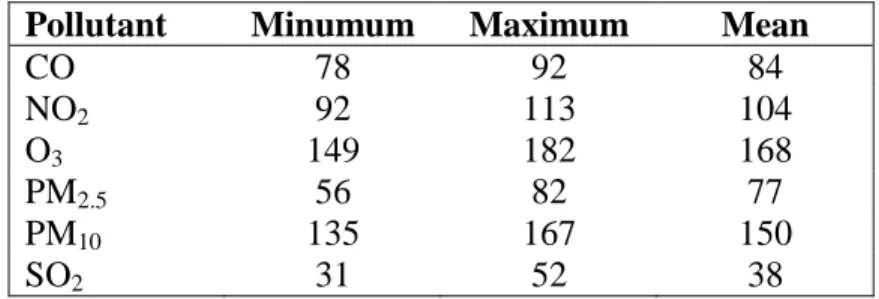
California Air Resources Board (CARB) data of mean pollutant values and/or days exceeding standards (Table 2.1). The proposed investigation was the first to yield results from an observational analytic epidemiologic study on whether TB is associated with individual-level air pollution concentrations.
Study Population
All eligible participants were drawn from KPNC, which provides integrated
39
multiple databases and disease registries which are constantly updated and frequently validated via chart review.
Subject Eligibility Criteria
Based on KPNC data, an average of nearly 300 incident TB cases per year occur within KPNC. This study included adult incident cases of PTB newly diagnosed among KPNC members between January 1, 1996 and December 31, 2010, inclusive. Controls were drawn from the KPNC cohort and matched to cases (2:1) by age, gender, and race/ethnicity. Patients with a known history of past TB disease were excluded from the initial study population. Over the study period, KPNC documented a total of 4750 cases of incident PTB in their ECD. However, this study was restricted to adults (21 years of age and older) with a required the length of membership enrollment in KPNC study participants of at least two years (to screen out recent immigrants). This resulting population included 2380 cases and 4738 controls for analysis.
40
Case Definition
TB was defined as a positive TB culture or a prescription for at least 30 days of four or more anti-tuberculosis medications isoniazid, rifampin, ethambutol, and pyrazinamide (the general regimen for TB treatment). At Kaiser, PTB is ascertained among patients with cough, clinical uncertainty (pneumonia, TB, other), chest x-ray that is on reading "suspicious for TB", and in-house sputum smear microscopy, and when positive, the TB diagnosis is made. ECD were reviewed for each case of TB to ascertain site of disease, and only cases of pulmonary TB were included in the study data. EMR were also used to verify the date of diagnosis (defined as the date of the collection of the specimen for sputum smear
microscopy, or, if necessary, the date of the start of treatment).
Exposure Assessment
Air Pollution Exposure
Monthly averages for criteria air pollutants particulate matter with an aerodynamic diameter less than 2.5 µm (PM2.5), PM with an aerodynamic diameter less than 10 µm (PM10), sulfur dioxide (SO2), nitrogen dioxide (NO2), ozone (O3), and carbon monoxide (CO) were developed by the California Air Resources Board (CARB) staff from January 1994 to December 2010. Exposure to monthly pollutant averages were chosen over
41
dramatically decreased since 1973 when lead began to be phased out of motor vehicle gasoline (U.S. EPA); this exclusion is common for epidemiologic investigations on air pollution.
CARB manages the collection of real-time measurements of ambient air pollutants through the California state and local air monitoring network
(http://www.arb.ca.gov/aqd/netrpt/netrpt.htm). These fixed-site monitors (Table 2.2, Figures
2.3-2.8) were used to estimate levels of PM2.5, PM10, SO2, NO2, O3, and CO are part of
exposure. Though the CA state and local air monitoring network has PM2.5 data, these measurements have only been routinely collected in California since 1999. Because initial PM2.5 monitoring sites throughout the study area were limited, monitoring data were
supplemented with data from the Interagency Monitoring of Protected Visual Environments (IMPROVE). Analogous to the other pollutant measurements, the PM2.5 network
measurements from the IMPROVE network were also created with monitors using Federal Reference Methods, however they include continuous and every 6 day monitors. These measurements were all treated the same in calculating monthly averages, however months having less than three CARB calculated monthly average ambient concentrations for all monitoring sites in California from, 1994 to 2010.
42
new addresses for participants relocating within California from January 1994 through December 2010. If a change in address was not found in the electronic clinical database, this was assumed to have remained the same throughout the entire study period. Under the assumption that pollutant measurements at monitors closest to the subjects’ residences have more influence on pollutant concentrations at each residence than those farther away,
exposure estimates were assigned based on the monitor closest to the residence. The distance from each case and control residence to the closest air pollution monitor with available data each month was calculated separately for every pollutant (distributions shown in appendix
Table A9). To account for the relative importance of each monitor assignment, the distance
from the closest monitor was used to weight each exposure value.
Cigarette Smoking Exposure
The primary covariate of interest for aim 2, to evaluate whether there is a positive association between cigarette smoking and incident PTB disease, and to test whether
smoking is a confounder and/or effect modifier of the association between air pollution levels and TB is smoking. Data on this covariate was obtained by abstracting data in the KPNC electronic clinical databases for study subjects. However, in the Kaiser ECD smoking exposure has been recorded in several different forms with inconsistent definitions over the study period, complicating the derivation a smoking variable. The variable containing the most detailed information on smoking status, which is ideal for addressing aim 2, is a
43
‘Tobacco’ appears to have the least amount of missing data. Table A1 shows the amount of missing data by year of diagnosis for the ‘Tobacco’ variable.
The proportion of smokers among the 2008-2010 cohort is nearly identical regardless of the smoking definition used, as expected. However, for the entire cohort (where the earlier cohort had a large amount of missing data on smoking for any one variable including
“Tobacco”), the newly derived variable reduces the amount of missing data substantially
(Table A2). Although the prevalence of non-smokers appears to be less among those
diagnosed with PTB prior to 2008, it is consistent with the smoking prevalence data published by the California state health department ( http://www.cdph.ca.gov/Pages/NR11-031.aspx; Accessed June 30, 2012), which shows a steady decline in the proportion of smokers during this time period.
44
Additional Covariates
Potential confounders and effect measure modifiers for the two study aims were identified through review of the relevant biologic and epidemiologic literature (Yancey 2008). These other covariates, also obtained from KPNC clinical databases, and include age (continuous), gender (male/female), race/ethnicity (categorical), U.S. Census-derived income, education, and neighborhood percentage of foreign birth, length of KPNC
membership (continuous), TB drug use (categorical), alcohol hospitalization (yes/no), HIV status (yes/no), and other comorbidities including (diabetes, COPD, renal dialysis, (each yes/no)).
KPNC administrative databases house demographic information for nearly 8 million past and current members. This includes members’ names, birthdates, gender, address, etc. Approximately 80% of race/ethnicity data has been captured in the original database. An algorithm was created by Kaiser researchers that assigns race values based on name, location, and other various indicators present in the Kaiser database to individuals missing
race/ethnicity. As a result, few observations were missing information on demographic factors.
45
used to explore the possibility that an environment/neighborhood with a large foreign born population may affect risk of PTB.
Kaiser also has an existing HIV registry and diabetes registry. These records are very well maintained and kept up to date. Information on these covariates were available for every patient record (i.e. none missing).
Exposure Measurement Concerns
Outdoor Air Pollution
Exposure assessment is frequently the most complex portion of an environmental epidemiologic study. Air pollution exposure in itself has many challenges, which this
investigation attempts to overcome. Exposure assessment becomes particularly difficult when assessing chronic exposures, as is the case for this investigation. This study attempted to circumvent common problems of assessing chronic environmental exposures, by examining exposure over time, ranging from 0-24 months. Although the relevant exposure window for influencing the susceptibility to ambient air pollution is unknown, murine models have shown that exposure to air pollution may lead to increased susceptibility for up to six months following the exposure (Hiramatsu 2005). However, whether this same timeline is
transferrable to humans remains unknown. It is possible that environmental exposures may result in increased risk on the day of exposure, the following week, or even months after exposure. Polynomial distributed lag models, which assume the effect of exposure on