LATENT TUBERCULOSIS INFECTION PREVALENCE, SPATIAL CLUSTERING AND RISK FACTORS IN A SOUTH AFRICAN URBAN INFORMAL SETTLEMENT
Jabulani R. Ncayiyana
A dissertation submitted to the faculty at the University of North Carolina at Chapel Hill in partial fulfillment of the requirements for the degree of Doctor of Philosophy in the Department of
Epidemiology in the Gillings School of Global Public Health.
Chapel Hill 2015
© 2015
ABSTRACT
Jabulani R. Ncayiyana: Latent Tuberculosis Infection Prevalence, Spatial Clustering and Risk Factors in a South African urban informal settlement
(Under the direction of Annelies van Rie)
This dissertation investigated the burden spatial clustering and risk factors of latent tuberculosis infection (LTBI), in a South African urban informal settlement. Using data from a large community-based household survey with random sampling and from the 2011 South African census as disseminated by Statistics South Africa (STATSSA), we estimated the prevalence of LTBI in the general population, the annual risk of infection (ARI) in children, and investigated individual-, household- and neighborhood-level factors associated with LTBI (paper 1). We assessed spatial heterogeneity of LTBI prevalence and the association between
community-level factors and LTBI clusters (paper 2).
In paper 1, we observed that the overall prevalence of LTBI was 34.3% (
95% CI, 30%
– 39%
), the annual risk of infection among children age 0-14 years was 3.1% (95% CI: 2.1 -
5.2
). In multivariable logistic regression analysis, LTBI was associated with age, male gender,marital status, and higher socio-economic status.
ACKNOWLEDGEMENTS
I would like to acknowledge and thank Dr. van Rie, the chair of my dissertation
committee. Throughout my program, she has been an exceptional advisor and mentor. She has always been supportive and encouraging and I am extremely appreciative of her willingness to work with me throughout this exploration and research. I am especially grateful for her support, patience and understanding with my personal struggles with my health and academic programs.
I would also like to thank the members of my dissertation committee: Dr. Emch, Dr. Westreich, Dr. Pettifor and Dr. Musenge for their time, expertise, guidance, helpful suggestions and comments, and support throughout this research program.
In addition, I would also like to acknowledge and thank Dr. Charles van der Horst, for giving me an opportunity to pursue a PhD program in Epidemiology in one of the best schools in USA. He was supportive of my interest and application to this program at UNC and was always encouraging and supportive throughout this journey.
A special thank you to Nancy Colvin, for all your support and encouragement through difficult times.
Thanks to my classmates in the UNC Department of Epidemiology. Especially Maganiso Chagomerana, Emily Smith, Liz Cromwell, Joann Gruber, Nalyn Siripong, Stephanie de Long, William Miller, Shakia Hardy for always being there for me in a hour of need in and out of the classroom.
program.The Diepsloot Household Mapping survey was funded by USAID (award number AID-674-A-12-00033, PI: Dr. Jean Bassett).
TABLE OF CONTENTS
LIST OF TABLES ... xii
LIST OF FIGURES ... xiii
LIST OF ABBREVIATIONS ... xiv
CHAPTER 1: BACKGROUND ... 1
1. Burden of active TB disease and Latent TB Infection (LTBI) ... 1
1.1 Burden of TB ... 1
1.2 TB/HIV co-infection burden ... 2
1.3 Limitations of current TB control strategy ... 3
1.4 Latent M. tuberculosisinfection (LTBI): burden and risk factors ... 4
1.5. Annual risk of infection with M. tuberculosis ... 6
1.6 Diagnosis of LTBI ... 6
1.7 Risk factors for LTBI ... 8
1.8 Why LTBI is significant in TB control ... 13
2. Spatial epidemiology of TB... 14
2.1 Spatial clustering and patterns of TB burden ... 14
2.2 Factors associated with spatial patterns of TB ... 14
2.3 Application of spatial analysis for the control of TB ... 15
3. Limitations of Current Research ... 16
3.1 LTBI prevalence studies ... 16
4. Conceptual framework of factors associated with LTBI in the proposed study ... 18
CHAPTER 2: METHODS ... 19
1. Study overview ... 19
2. Study setting ... 19
3. Parent Study ... 20
4. Study population ... 21
5. Predictor Variables assessment ... 22
5.1 Individual-level factors: ... 22
5.2 Household-level factors: ... 23
5.3Neighborhood-level factors: ... 24
6. Outcome variable assessment ... 24
6.1 Latent TB Infection ... 24
7. Spatial data collection ... 24
8. Quality Assurance and data management ... 25
9. Analytic approach for aim 1 ... 25
9.1 Prevalence of LTBI ... 25
9.2 Annual risk of infection (ARI) ... 25
9.3 Factors associated with LTBI prevalence ... 26
10. Statistical analysis for Aim 2:... 26
10.1 Detection of spatial patterns ... 26
10.2 Assessment of spatial factors associated with LTBI prevalence clusters ... 28
CHAPTER 3: AIM 1 RESULTS ... 30
1.Introduction ... 30
2.1Study site and Study population ... 31
2.2Study variables ... 32
3.Statistical analysis ... 34
4.Ethics statement ... 34
5.Results ... 35
5.1Study participants ... 35
5.2Distribution of TST results, LTBI Prevalence and Annual Risk of infection ... 35
5.3Factors associated with LTBI at individual and household level ... 36
5.4Factors associated with LTBI at neighborhood level ... 36
6.Discussion ... 37
CHAPTER 4: AIM 2 RESULTS ... 45
1.Introduction ... 45
2.Methods ... 46
2.1Study area ... 46
2.2Study population and data collection ... 47
3.Data analysis ... 47
4.Ethics ... 49
5.Results ... 49
5.1Descriptive statistics ... 49
5.2Spatial scan statistics: LTBI hotspots ... 50
5.3OLS model ... 50
5.4Local GWR model ... 51
6.Discussion ... 51
CHAPTER 5: DISCUSSION ... 64
1.Introduction ... 64
2.Summary of findings ... 64
3.Interpretation of findings ... 65
4.Strengths and limitations ... 67
5.Conclusion ... 69
LIST OF TABLES
LIST OF FIGURES
Figure 1.1 Estimated TB prevalence trends in South Africa, 1990–2013………..2
Figure 1.2 Estimated TB incidence rates, estimated incidence rates of HIV-positive TB
and TB notification rates in South Africa, 1990–2013………..4 Figure 1.3 Risk factors for different stages of TB disease continuum………...9 Figure 1.4 Conceptual framework of factors associated with LTBI………..18
Figure 2.1 Map of study area of Diepsloot township, Johannesburg
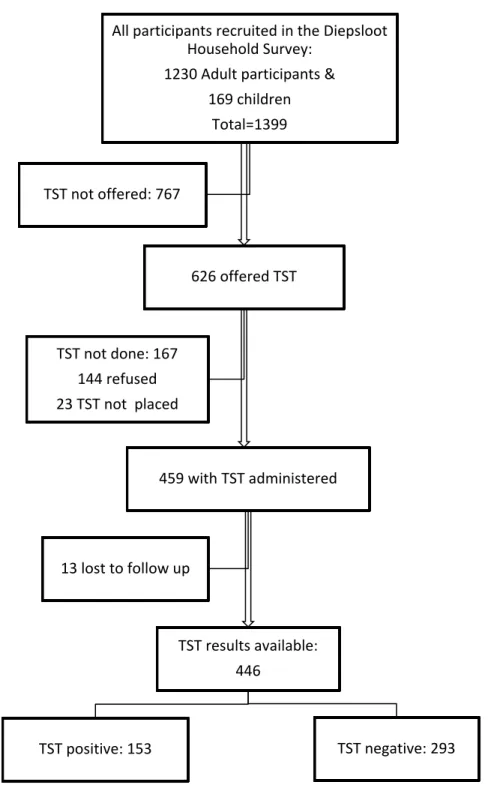
in Gauteng province, South Africa………20 Figure 3.1 Flow chart of study participants………..40
Figure 3.2 Frequency distribution of indurations (in mm) in 446 residents
of an urban township of Diepsloot………41 Figure 4.1 Map of the study area Diepsloot, Johannesburg, South Africa………..55 Figure 4.2 Spatial distribution of neighborhood-level LTBI prevalence in Diepsloot………...…..56 Figure 4.3 Distribution of spatial clusters of LTBI prevalence in Diepsloot………...57
Figure 4.4 The spatial variation of residual, local R2 and
LIST OF ABBREVIATIONS
ARI annual risk of infection ART anti-retroviral treatment
CHWs community health care workers DOH department of health
GIS geographic information system GPS global positioning system GWR geographic weighted regression HCWs health care workers
TB tuberculosis
HBCs high TB burden countries LTBI latent tuberculosis infection OLS ordinary least squares SES socio-economic status
IGRAs interferon-gamma release assays
IPT isoniazid preventive therapy NTM non-tuberculous mycobacteria
PPD purified protein derivative
SADHS South African Demographic and Health Surveys HIV human immune-deficiency syndrome
WHO World Health Organization
DOTS directly observed therapy short-course MDGs Millennium Development Goals
CHAPTER 1: BACKGROUND
1. Burden of active TB disease and Latent TB Infection (LTBI)
1.1 Burden of TB
Tuberculosis (TB) remains a significant public health problem worldwide, especially in sub-Saharan Africa: In 2013, there was an estimated 9 million new cases of TB and 2.6 million, with is over one quarter (29%) of all incident cases reported in sub-Saharan Africa.[1] Of the 22 high TB burden countries (HBCs) that account for about 80% of the world’s TB cases,nine are
in sub-Saharan Africa region.[1] Of the 9 HBCs countries in the sub-Saharan Africa region, more than half (5) are in southern Africa.[1] Overall TB incidence has been steadily decreasing in sub-Saharan Africa region, however TB incidence rates vary widely between regions and countries, with around 1350 per 100 000 people in Swaziland, and fewer than 100 per 100 000 population in western African countries such as Burkina Faso, Ghana and Togo.[2]
South Africa has the sixth highest burden of TB burden in the world, with 450 000 (410,000 – 520,000) of incident TB cases reported in 2013,[1]
Community-based prevalence surveys have shown that TB burden varies significantly and that the TB prevalence in some communities was 2-fold that of national estimates. [5, 6, 8-11]
Figure 1.1 Estimated TB prevalence trends in South Africa, 1990–2013.
Source: (WHO, 2014)[1]
1.2 TB/HIV co-infection burden
There is a significant public health burden of HIV-associated TB; especially in sub-Saharan Africa. In 2013, 1.1 million (12%) of the 9 million people who developed TB worldwide were HIV-positive.[1]Overall, 870, 000 (790 000-960 000) of TB cases were estimated to be co-infected with HIV were reported from sub-Saharan Africa in 2013.[1] These cases accounted for 79% of TB/HIV co-infected cases reported worldwide, which increased by 10% increases from 69% TB/HIV co-infected cases reported in 2011.[1, 2] Epidemiological studies in countries with high HIV prevalence have also shown that spatial and temporal variation in TB incidence is strongly associated with the prevalence of HIV infection.
burden in South Africa is associated with HIV infection, there is an indication that HIV infection alone doesn’t explain the TB burden in South Africa. KwaZulu-Natal, with the highest HIV
sero-prevalence rate nationally, has the lowest TB sero-prevalence while Western Cape with the lowest HIV sero-prevalence rate nationally, has the highest TB prevalence.[3, 4]
1.3 Limitations of current TB control strategy
Since WHO declared TB a global emergency in 1993, the directly observed therapy short-course (DOTS) strategy has been the key public health intervention global TB control.[12, 13] The performance targets of tuberculosis (TB) control programs adopted by WHO are to detect 70% of new sputum smear-positive cases of TB and cure rates of more than 85% of detected cases.[14] The Stop TB Partnership has set additional targets related to the Millennium
Development Goals (MDGs): to reverse TB incidence, to halve TB prevalence and mortality between 1990 and 2015.[15, 16] It was predicted that if the above targets were reached by 2005, it would be possible to achieve the TB-related MDGs.[17-20]
The target of an 85% treatment success rate for sputum smear-positive cases was first achieved in 2007 and case detection rate increased substantially between 1995 and 2008.[16, 21] However, TB incidence has only been falling at a very slow rate of less than 1% per year since 2004.[20, 22] Moreover, among the 22 HBCs, 11 are not on track to reduce incidence, prevalence and mortality in line with targets.[1] Although DOTS strategy has been effective in most regions of the world, resulting in a sustained downward trend in global TB incidence, it has failed to bring down the prevalence of TB in eastern Europe and Africa especially in the southern Africa where HIV prevalence is highest.[23, 24]
risk factors.[27-29] There is a growing recognition that the rates of TB burden decline might also be more strongly related to social and economic factors and general population health than the performance of national tuberculosis control programs.[27, 28, 30, 31]
Despite boasting about a well-organized and high coverage of DOTS strategy, South Africa has consistently failed to achieve these targets. Treatment success rate for sputum smear-positive cases was 77%, and case detection rate was 69%, falling substantially short of the 85% target.[1] Achievement of MDGs for TB is unlikely in South Africa, though the incidence of TB has started to slightly decrease in 2013 (Figure 2), South Africa is not track on meeting 50% reduction of TB prevalence and mortality.[1] It is evident that the current TB control strategy had very limited impact on the burden of TB in South Africa. TB epidemic in South Africa is thought to be fueled by very high rates of LTBI and high ongoing transmission rates of infection.[22]
Figure 1.2 Estimated TB incidence rates, estimated incidence rates of HIV-positive TB and TB notification rates in South Africa, 1990–2013.
Source: (WHO, 2014)[1]
1.4 Latent M. tuberculosisinfection (LTBI): burden and risk factors
TB, are not infectious, but are at risk of progressing to active disease and thus becoming infectious.[22, 32-35] Without HIV co-infection, the average lifetime risk of infected individuals developing tuberculosis is 5 to 20%, the highest risk being within the first five years of
infection.[36] With HIV co-infection, the annual risk of progressing to active is 5-15%,[37, 38] with average lifetime risk as high as 50%.[39] While antiretroviral treatment reduces the risk of progressing from latent infection to active disease, it does not eliminate this risk and the risk in individuals on ART remains higher than the risk in HIV negative individuals.[40] The risk of developing TB following infection also changes with age. Infants and young children up to the age of five years who are infected with M. tuberculosis are at high risk.[41-43]
An estimated 2 billion persons worldwide have latent tuberculosis infection (LTBI) and approximately 200 million are at risk of progression to active TB disease during their lifetime.[17,
44, 45] The burden of LTBI varies greatly across the world, in developing countries, LTBI estimates
have ranged from 5% in Kenya to 60% in Ethiopia.[46-49] In North America and Europe, the prevalence of LTBI in the general population is less than 10%,[50, 51] but high burden of LTBI occurs among high-risk populations.[50, 52, 53] One such high-risk population is household contacts of TB cases. A systematic review of 203 studies of LTBI among household contact reported great geographic LTB prevalence of 51.5% (95% CI= 47.1–55.8%) in low- and middle-income settings compared to 28.1% (95% CI=24.2–32.4%) in high-middle-income settings.[54]
Another high-risk population are people living with HIV.[55] Of all people living with HIV worldwide, it is estimated that one-third are co-infected with LTBI, varying from 14% in Europe to 46% in Southeast Asia, and more than 50% in sub-Saharan Africa.[55, 56]
Johannesburg, 77%–89% of adults had evidence of LTBI.[59] In an urban township of
Johannesburg, the LTBI prevalence was 33% (95% CI [21%–32%].[60] A recent study in a black
township of Cape Town has reported the prevalence of LTBI to be 52.7% among HIV-infected patients.[61] This suggests that there is a heterogeneous in the burden of LTBI with South Africa.
1.5. Annual risk of infection with M. tuberculosis
A measure related to the prevalence of LTBI is the annual risk of TB infection (ARI), which is an averaged measure of risk of TB infection over the lifetime of individuals.[62] ARI is typically measured in school-age children and used as the indicator of recent transmission of M. tuberculosis in the community.[58] In low burden TB countries ARI is less than 1% while recent ARI estimates in sub-Saharan range from 1.5-4%.[63, 64] South Africa had very high ARI (5-8%) in early 1980s national TST surveys.[57] More recent studies in one of the high TB burden setting of South Africa reported ARI of 4%.[58, 65]
1.6 Diagnosis of LTBI
Because LTBI is the sub-clinical stage of TB disease continuum, culturing and isolation of M. tuberculosis bacilli is not possible during LTBI stage.[32, 66, 67] Instead, the diagnosis of LTBI is based on immunological response to M. tuberculosis.[32, 66] Tuberculin skin test (TST) and interferon-gamma release assays (IGRAs), are the test currently available used to diagnose LTBI.[66]
TST has several important limitations. TST has poor sensitivity (75-90%), especially in immnuno-compromised populations.[66] To address this limitation, in HIV-infected individuals, a positive TST is defined as an induration of at least 5 mm.[68] TST specificity range from 70-95% with lower specificity in Bacille Calmette Guerin (BCG)-vaccinated individuals, especially in the first years following initial BCG vaccination or in individuals who have received repeated BCG vaccinations.[66] There is also some cross reactivity with non-tuberculous mycobacteria (NTM). Despite its limitations, TST continues to be recommended and used as there is a moderate to strong association between TST positivity and risk of active TB during follow-up.[66] A review of 11 studies showed that the largest TST positivity reactions are associated with an increased risk of TB than the smallest TST positivity reactions. The risk ratio of TB among the largest TST positivity reactors ranged from 2.2 to 26.3.[69] There is also strong evidence showing the benefits of treating TST positive individuals in reducing the risk of progressing from latent infection to active TB.[66] A study showed a 62% reduction in risk if active TB among HIV-infected patients treated with IPT.[70] TST therefore remains a useful tool, both for epidemiologic research and the control and prevention of clinical tuberculosis.[71]
Alternative test for LTBI diagnosis are IGRAs, which are available as commercial assays.[32, 66] IGRAs are in vitro tests of whole blood or mononuclear cells that are based on Interferon-gamma release after T-cell stimulation by M. tuberculosis–specific proteins. Two of the most commonly used M. tuberculosis–specific proteins are early secreted antigenic target 6 (ESAT-6) and culture filtrate protein 10 (CFP-10), which are absent from BCG vaccine strains and most NTM.[66, 67] The positive result is based on either the concentration of
Interferon-gamma or the number of Interferon-Interferon-gamma producing cells (spots) depending on the type of the assay used.[67]
immune-compromised populations and, similar to TST, IGRAs cannot distinguish between LTBI and active TB.[66, 67] Despite their promise, IGRAs have not replaced TST is the main diagnosis test for LTBI, especially in poor resourced settings.[67] This is partly due to their high costs and need for the laboratory infrastructure, which is not available in most of poor resourced settings.[72] IGRAs are not recommended by WHO for screening individuals who will be eligible to receive IPT.[73]
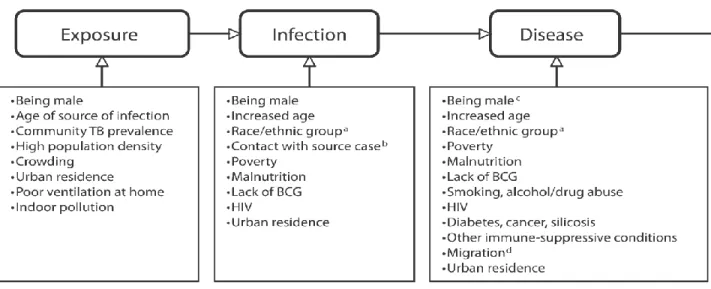
1.7 Risk factors for LTBI
In order to appreciate the importance of risk factors for LTBI and rationale for mitigating against them, it is necessary to first understand that the development of TB is a two-stage phenomenon.[74] First, a person becomes infected after being exposed to M. tuberculosis bacilli and secondly, infected persons may develop active TB after an interval ranging from few
Figure 1.3 Risk factors for different stages of TB disease continuum.
(Hargreaves,2011)[76]
1.7.1 Close contact of TB case
It is well established that contacts of TB cases are at higher risk of LTBI than the general population.[78] Many studies across the world, have found that being a household contact of TB is the strongest predictor for LTBI.[48, 61, 79-82] A systematic review of 41 studies conducted in 17 countries (50% in Africa) reported a pooled LTBI prevalence of 51.8% (95% CI=50.9-52.8) among household contacts of TB cases.[78] The level of infectiousness of the index case
1.7.2 Age
Children under 2 years acquire LBTI from the household index TB case, while, children older than 2 years, mostly acquire LTBI from the community.[9, 88] However, household index TB case remains an important source of infection for children up to 10 years of age.[89, 90] A study in Philippines among found that household contacts older than 5 years old had higher odds of LTBI (OR 3.17, 95%CI 1.43-7.01).[91] Studies in sub-Saharan Africa also reported increased age as independent risk factor for LTBI.[47, 75, 92, 93] This association may be due to two factors. First, children young than 2 year of age progress to active disease shortly after infection. Second, their immune responses to PPD is weak due to underdeveloped immunity. As a result young children may be misclassified as not having LTBI, resulting in an underestimation of the prevalence of LTBI in younger children.[89] A study among household contacts, found that compared with contacts 4 years of age or younger, contacts had increasing odds of LTBI with increasing age: OR 2.60 (95% CI: 1.32–5.01) among 5–14 years, OR 4.45 (95% CI: 1.98–9.97) in 15–24 years and OR = 7.16 (95% CI: 3.39–15.10) in those 25 years or more.[94] In South
Africa, two studies found that increased age was associated with LTBI (OR=2.0, 95% CI=1.7-2.3).[87, 95]
1.7.3 HIV
HIV infection may not only increase the risk of progression from infection to disease but may also increase the risk of LTBI in those exposed M. tuberculosis.[96] HIV infection weakens cell-mediated immunity due to reduction and dysfunction of CD4 cells, which plays a critical role in the host immune defense mechanisms against M. tuberculosis.[96] HIV infected individuals tend to have higher risk of acquiring LTBI than HIV non-infected individuals.[54, 55]
found an association between HIV status and LTBI.[97] A study among South African miners found that HIV-infected miners had lower odds of have LTBI (OR= 0.41, 95%CI =0.17-0.96).[59]
1.7.4 Gender
Tuberculin-testing surveys conducted during the 1950s and early 1960s show an age-dependent pattern of LTBI prevalence between men and women.[98] The prevalence of LTBI was equal between men and women until beginning in adolescence, after which male prevalence began to exceed female prevalence.[98] A community-based study in Ethiopia reported, that being male was associated with higher odds of LTBI (OR=1.8, 95% CI=1.2- 2.7).[49] Other studies across sub-Saharan Africa have reported similar associations.[75, 93] In South Africa, studies have consistently reported the association between risk of LTBI and being male.[65, 87] A differential increase of social contacts is often presented as an explanation for this association.[65, 99]
1.7.5 Race or ethnic group
Poor and marginalized populations or ethnic minorities carry a disproportionately higher burden of LTBI.[100] Similar to gender, race/ethnicity risk for LTBI is not only biological but occurs within a social, economical and cultural context. Even in developed countries, there are racial disparities with regards to the risk of LTBI. In USA, blacks were 7 times as likely to have LTBI (OR=7.5, 95% CI=4.0–13.9).[50]
A study in Laos found that ethnic minorities were 5 times as likely to have LTBI (OR: 5.4, 95% CI: 2.2-13.6).[79] A study in Tanzania found that certain ethnic groups were found to be less vulnerable to LTBI as compared to others. In South Africa, early study reported that LTBI vary by racial groups.[57] A recent study in South Africa reported higher odds of LTBI for blacks (OR=4.2, 95% CI=3.1–5.7) and mixed race group (OR=3.9, 95%
CI=2.8–5.4).[87]
1.7.6 Poverty (SES)
years, poverty/SES has been recognized as a one of important drivers, which need to be address in TB control.[16, 31] The prevalence of LTBI is higher in poor countries but, even within rich countries, individuals living in poverty tend to have higher burden of LTBI.[50] A study in the USA found that the odds of developing tuberculosis were 1.9 times higher in the poorest individuals than in the richest.[50] By contrast, studies from developing countries reported conflicting results. A study in Zambia found that higher SES, rather than lower, was associated with significantly higher odds of LTBI.[102] A study in Viet Nam found that higher SES, was associated with lower odds of LTBI (OR=0.88. 95% CI=0.80–0.97).[48] One possible explanation
of this discrepancy is that the difference in how poverty/SES indicators are measured in the different regions may produce different pathways of association between poverty and LTBI.[103] For example, poverty is measured by household income, while in developing countries
poverty/SES is usually measured by household items.[104]
1.7.7 Urban residence
Rapid urbanization witnessed in developing countries has also been shown to have
influence on a person’s susceptibility to infection.[105-107] Poor high-density urban settlements are
often the breeding ground for infectious diseases.[107] Urban poor settlements are even more relevant for TB transmission since the factors that facilitate transmission tend to be more prevalent in these settings.[28, 108] In 19th-century Europe growing urbanization due to massive industrialization, resulted in the highest TB burden ever seen in modern Europe.[28, 108] Two the countries (India and China) with highest TB burden in the world, have undergone
unprecedented urbanization in modern history.[109] In India, the risk of TB infection is higher in urban than in rural areas.[110] In sub-Saharan Africa, LTBI is highly prevalent among urban residents.[59, 111] A study in Viet Nam found that urban residence, was associated with higher odds of LTBI (OR=1.47, 95% CI=1.34–1.62).[48] Urbanization is confounded with other risk
urbanization and overpopulation.[112] In Thailand, a study found that people living in crowded households had 2.6 times (OR = 2.63, 95%CI = 1.18-5.85) the odds of LTBI.[113] A study in Zambia found that people living in crowded households had higher odds of LTBI (OR=3.0, 95% CI=1.2–7.4).[102]
1.8 Why LTBI is significant in TB control
The importance of LTBI is not limited to the individual, but is also an important public health consideration. Studies show that 5–20% of those with LTBI will develop active TB at
some point in their lifetime, with the majority developing TB disease within 5 years of the initial infection.[36, 114] Therefore, LTBI burden represents a large reservoir of new TB cases.
Particularly HIV-infected individuals and younger children with LTBI who are at highest risk of developing TB.[22, 43] Modeling studies have shown that screening and treatment of LTBI may play a key role in TB elimination.[115, 116] TB elimination is aimed at reducing the prevalence of LTBI, so that future cases of TB will be prevented.[117] Given the significant public health impact and costs that are associated with active TB disease, public health interventions aimed at reducing the burden of LTBI and risk of progression to active TB, are being implemented.[1, 2] The main intervention aimed at reducing the burden of TB is screening and provision of isoniazid preventive therapy (IPT) treatment to HIV-infected individuals and younger children with LTBI. However, its implementation though improving is still very poor in high TB burden countries.[1, 2]
2. Spatial epidemiology of TB
2.1 Spatial clustering and patterns of TB burden
Transmission of infectious disease is closely linked to the concepts of spatial and
spatial-temporal proximity, as transmission is likely to occur if the at-risk populations are close in a spatial and temporal sense.[118] The recognition that infectious diseases and their risk factors are spatial and temporal related is growing rapidly. Consequently, geographical information systems (GIS) and spatial analysis are increasingly being used to describe distribution and patterns of infectious disease.[119-123] The use of GIS and spatial analysis to describe the pattern of TB has gained momentum in recent years.[124-130] A study in India found significant hotspots of TB in three areas of the Almora district.[130] Studies conducted in China have found significant TB clustering in urban settings.[131-133] In West African country, spatial scan statistic was used to assess purely spatial clusters of TB in an urban setting.[134] In South African, few studies used GIS and spatial analysis to investigate TB burden patterns in a high-incidence area.[124, 128]
2.2 Factors associated with spatial patterns of TB
Clustering of a disease or disease hotspots occurrence is closely linked to the clustering of a risk factors.[118] This is especially true for TB since factors which facilitate transmission are largely influence by spatial characteristics such as migration, crowding, and poverty. A study in USA identified poverty, age, race, and foreign born as factors associated with TB incidence clusters.[135] In China, studies using spatial analysis, found migration, poverty/SES and housing type was associated TB hotspots.[133, 136-138] Studies done in Brazil found that TB incidence hotspots were associated with low SES.[139, 140] In Madagascar, spatial TB clustering was associated with low SES and migration.[129] In South Africa, an early study in a small urban (3.4 km2) community showed that there was uneven spatial distribution of notified TB cases.[124] Another study in the same small urban community found that the clustering of TB notified cases were associated with unemployment, overcrowding and
low-risk cluster for incident TB was associated with patients living near the local health facility. The study did not find a high-risk cluster of incident TB.[141]
2.3 Application of spatial analysis for the control of TB
The success of public health intervention depends on a broad and accurate
understanding of the risk factors that determine the occurrence of disease.[142] The challenge facing the TB control program is that the disease burden is not homogenous but varies
geographically. There is growing evidence that the use of GIS and spatial analysis to inform TB control strategies may aid in more effectively reducing TB burden. A study in a Smith county, Texas in USA used GIS to identify neighborhoods with high TB burden that could be targeted for LTBI screening and IPT treatment.[143] The study reported a dramatic reduction of TB incidence in those neighborhoods, which were identified by GIS and targeted for
intervention.[143] The results from study further demonstrated that the application of GIS and spatial analysis in TB control program is not only effective but also cost-effective.[143]
A mathematical model explored the impact of targeting TB hotspots in the community compared to targeting the whole community.[116] The study showed that achieving TB control targets in a hotspot containing 6% of a city’s population can have similar impact on community
TB incidence as achieving the same targets throughout the remaining community.[116] The projected impact of hotspot-targeted interventions depends strongly on the rate of TB
transmission from cases in the hotspot to members of the general community. Previous studies have shown that TB transmission is not only limited within the household,[88, 144, 145] but
significant amount of TB transmission occurs in other settings outside the household in high TB burden areas.[146, 147] These settings include crowded and poorly ventilated informal alcohol drinking places (sheebens/taverns), public transportation, community halls, and churches.[88, 144,
147] Therefore, TB transmission occurring in these settings is more likely to take place within
3. Limitations of Current Research
3.1 LTBI prevalence studies
Previous studies estimating the prevalence of LTBI, ARI and associated risk factors have provided a valuable insight on the burden of LTBI. However, these studies have key limitations. Most studies estimating prevalence of LTBI and its risk factors have been conducted on children and adolescents in schools.[87, 95, 148] While this is a convenient and easy population to study, studies done on children and adolescents may not represent the true burden of LTBI and transmission patterns at the community level. Studies have shown that the exposure and risk of LTBI is age-dependent.[47, 75, 92, 93] In young children, the main risk factor for LTBI is adult TB case in the household. In adults,[9, 88] exposure TB bacilli is not limited to the household with a significant amount of TB transmission occurs in other settings outside the household.[146, 147] Studies done in adults population have usually been performed in specific groups of adults such as health care workers (HCWs), miners or HIV infected individuals.[59, 149-153] These specific groups do not represent the general population and their risk factors for LTBI may be
different.[59, 149-153] Studies estimating the prevalence of LTBI and ARI across all age groups in the general population may better estimate the true burden of LTBI in communities.
To date, many LTBI prevalence studies have been conducted at national level.[46, 48, 79,
154]
This means that the reported estimate of LTBI prevalence will not give an insight of the geographic variations of LTBI prevalence at community level. Considering that TB control intervention are implemented at district and community level, national LTBI prevalence studies are not useful in identifying local high burden areas and the corresponding individual,
household, and community level risk factors. Community-based LTBI prevalence studies are better positioned to inform targeted community-based interventions.
Despite the recognition that factors associated with LTBI burden are multifaceted
multilevel analysis to explore individual-, household- and community-level factors associated with TB prevalence, found that community-level income inequality was independently
associated with increased odds of TB prevalence (OR= 2.37, 95% CI: 1.59–3.53).[156] There is
only one study to date of risk factors for LTBI using multilevel analysis. A study conducted in Pakistan using multilevel analysis found that both individual-level and household-level factors were associated with LTBI prevalence.[94] LTBI prevalence studies measuring the associations with risk factors at individual, household and community level are needed to identify those individual communities and areas within communities that need to be prioritized for the most effective interventions.
3.2 Potential application of spatial analysis for LTBI
The impact of any public health intervention is critically dependent on disease
prevalence and factors driving the transmission in the population.[142] Considering the fact that prevalence of LTBI and its risk factors vary by geographical location, GIS may help identify local LTBI hotspots.[158] Furthermore, spatial analysis of risk factors associated with LTBI hotspots may help improve the targeting of scarce resources for public health interventions. Indeed, local targeted public health interventions have been shown to be more efficient and cost-effective than community-wide public health interventions.[116, 143] In addition, the success of any public health intervention depends on accurate understanding of the individual, socio-economic, and environmental factors that drive disease transmission.[142] Most studies using GIS and spatial analysis have investigated the spatial distribution of active TB and its risk factors.[124-128, 131, 136,
145]
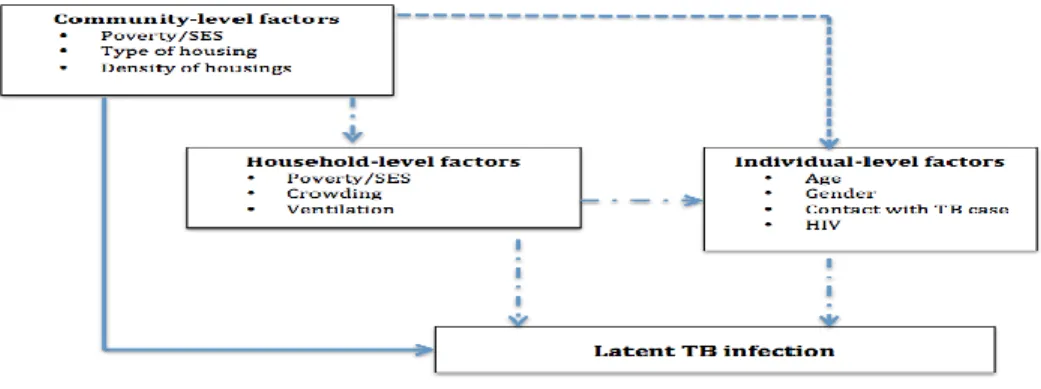
4. Conceptual framework of factors associated with LTBI in the proposed study
TB control efforts until recently were focused almost exclusively on the diagnosis and successful treatment of infectious TB cases. Growing awareness of the importance of social determinants of health in other areas has stimulated interest in the role of these determinants for TB.[160] We hypothesize that in addition to individual-level factors, household- and
community-level factors will be associated with LTBI burden. Figure 4 illustrate possible
pathways though which household- and community-level factors may affect LTBI prevalence. It has been previously shown that social interactions result in a substantial proportion of TB transmissions at the community level.[65, 99] While factors such crowding and poor ventilation facilitate TB transmission at the household level.[102, 113]
CHAPTER 2: METHODS
1. Study overview
This is an ancillary study of a community-based cross-sectional survey to estimate the burden of LTBI at the community level and to investigate the spatial epidemiology of LTBI. We estimated the LTBI prevalence and ARI, overall and stratified by age and HIV status. We used a predictive multilevel logistic and normal logistic regression risk models to assess individual-, household- and neighborhood- level factors associated with LTBI prevalence. We used SaTScan statistics to detect significant spatial clusters or hotspots of LTBI. To assess
neighborhood-level factors associated with LTBI prevalence, we used ordinary least squares (OLS) linear regression and Geographically Weighted Regression (GWR) models.
2. Study setting
The study area is the Diepsloot township located in Region A, one of seven regions in the city of Johannesburg, South Africa (Figure 5). The township covers a small area, the size of 12 km2and is densely population, with a total population of about 150,000 or 12,500 people per km2. Diepsloot township is comprised of 13 demarcated extensions or “communities” within the township. The study area is typical of many urban South African townships consisting of
informal settlements in the form of a mix of series of high-density shacks and government-subsidized brick houses. The Johannesburg Poverty and Livelihoods Study conducted in 2006 among the 8 poorest urban informal settlements including Diepsloot in the City of
Figure 2.1 Map of study area of Diepsloot township, Johannesburg in Gauteng province, South Africa
3. Parent Study
The study is an ancillary study of a large community-based cross-sectional household survey that was performed between May 2013 and March 2014 using a random sampling framework. The aim of the parent study was to assess unmet health needs and public health priorities in the township order to guide efforts by the department of health (DOH) efforts to improve the health or citizens of Region A.
Geographic coordinates were generated from an aerial map of the 13 digital geo-referenced extensions of the township. Geographic coordinates were randomly selected within each extension and the number of coordinates per extension was proportional tothe population size of the extension.
but within 30m of each randomly selected geographic coordinate was eligible for study
participation. If multiple households were equidistant from the geo-coordinate, the survey team randomly selected one household using a random number generator. Following this method, survey teams approached 2006 households. Households where no-one could be found home despite up to five repeat visits were considered missing and not replaced.
At time of the home visit, the exact latitude and longitude coordinates of the house was geocoded. When the household member agreed for the household to participate in the survey, all household members were enumerated. one of the enumerated adult (≥15 years) household
members was randomly selected for study participation using the Kish grid method.[161] This procedure was implemented to avoid the selection bias that would have occurred had the adult household member at home at the time of the survey been systematically selected for study participation. If the adult household member selected for study participation was not home, then the survey team made up to 4 attempts before the household member was considered
unreachable. Selected adults who could not be reached were not replaced. All childhood household members were invited to participate in a health assessment if the selected adult household member consented for their study participation. If a child <15 was not in household at the time the selected adult participant was interviewed, no return home visits were made for the child.
4. Study population
The study population of the parent study consisted of 1231 adults and 167 children residing in the Diepsloot township. Given the geographically-weighted random sampling framework, the study population is likely a random sample of residents of the Diepsloot township.
from the analysis if no TST result was available. A total of 446 participants were included in the analysis.
5. Predictor Variables assessment
5.1 Individual-level factors:
Age: self-reported and recorded in years.
Gender: self-reported and defined as male or female
HIV Status: HIV-infected, HIV-uninfected or unknown.
In the parent study, adults of unknown HIV status were offered HIV testing. Children age 12-17 were offered HIV testing with parental consent and child assent. Children <12 years of age were offered HIV testing only if the mother was the randomly selected adult household participant and adult consent was provided.
Household contact with TB: defined as contact with an adult or child in the
household who was diagnosed with TB
Body Mass Index (BMI): was calculated using the formula: weight (kg) / [height
(m)]2 and classified as underweight (<18.5 kg/m2), normal (18.5 - 24.9 kg/m2), overweight (25 - 29.9 kg/m2), and obese (≥30 kg/m2).
Anemia: was be measured using hemoglobin level and categorized into
non-anemia, and anemia. Anemia was defined as a hemoglobin (Hb) value below 13.0 g/dl (men), 12.0 g/dl (women and 12-15yrs), or 11.0 g/dl(< 5yrs), 11.5 g/dl (5-12yrs); down-adjusted by 0.65 g/dl because of altitude.[162]
Alcohol use: self-reported and was defined as non-alcohol user (never drinks), or
alcohol user (drink at least once a week).
Smoking: self-reported and was categorized into non-smoker (never smoke),
Educational attainment: self-reported as no formal education, completed primary
education, secondary or post-matric education.
Employment Status: self-reported as unemployed, or employed.
Marital Status: self-reported marital as living with partner, not living with a partner.
5.2 Household-level factors:
Household socioeconomic status (SES): was measured as a composite index of
SES based on ownership of durable goods, source of drinking water, toilet facilities and hunger, rather than the current inflow as provided by household income.[163] A principal component analysis (PCA) was applied to these variables, which showed relevant contributions to the combined SES score factor.[164] The factor of the PCA with the highest eigenvalue was used as the variable to describe SES of a
household. Households were ranked by SES score and then divided into tertiles of wealth; Low SES, Medium, High SES.
Household size: defined as the self-reported total number of individuals reported to
be staying in the participant’s household at the time of study.
Number of rooms in the household: self-reported number of rooms.
Crowding: defined as the number adults per bedroom in a household
Sleep with windows open: reported sleeping with windows open served as a proxy
measure of household ventilation.
Type of dwelling: Stand alone house Reconstruction and Development Programme
(RDP), Stand alone house non-RDP, Informal dwelling/shack in back yard, and
Informal dwelling/shack not in back yard.
Material of main walls of the household: observed type of dwelling was
categorized into: Plastic/Cardboard, Mud, Bricks/Cement blocks, Corrugated iron.
Food security: frequency that there was no for the household; never, rarely,
sometimes or often. This served as the proxy for malnutrition.
5.3Neighborhood-level factors:
Neighborhood socioeconomic status (SES): was measured as a mean composite
index of household level SES from each neighborhood. Neighborhoods were ranked by this index and then divided into tertiles of wealth; Low SES, Medium, High SES.
Percentage under 5 years population: proportion is the proportion of under 5 years
at each community neighborhood.
Percentage female headed household: proportion is the proportion of female
headed household at each community neighborhood.
Population density: population per km2 at each community neighborhood, and
Household size density: household per km2 at each community neighborhood
6. Outcome variable assessment
6.1 Latent TB Infection
The outcome variable of interest is LTBI. In the parent study, LTBI was measured by TST. The TST was placed by a trained nurse, and read between 48 and 72 hours after
placement by a trained community health worker. The CHW marked the edges of the induration with a pen and used a ruler to measure the widest transverse diameter in millimeters (mm). In HIV infected individuals, an induration of ≥5 mm was considered positive whereas an induration of ≥10 mm was considered positive for HIV uninfected individuals and those with unknown HIV status.
7. Spatial data collection
Johannesburg’s GIS department was used to define community boundaries and generate
random sampling points using geospatial software (ArcGIS 10.0).
8. Quality Assurance and data management
Standardized questionnaires were used to collect data on all adults on demographics, household characteristics, mobility, disease history, mental health, violence and injury, food security, and substance use, health assessments and built environment characteristics. The questionnaires were routinely checked for missing data and errors.
The data was entered in Microsoft (MS) Access databases. To ensure data quality, the user interface of the databases was very similar to the questionnaires, which eased data entry and reduced the risk of data entry errors. MS Access data quality controls such as validation rules to restrict entries in a given field to a range or type –text vs. numeric were used to further limit data entry errors. The databases were backed up daily in a server to prevent data loss. Further, we made use of queries in MS access for the process of data cleaning. Queries were regularly to identify missing data, inconsistencies and outliers. The results of the queries were
returned to the data entry for checking and corrections in the data set.
9. Analytic approach for aim 1
9.1 Prevalence of LTBI
Prevalence of LTBI was calculated using the following formula:
𝑁𝑢𝑚𝑏𝑒𝑟 𝑜𝑓 𝑇𝑆𝑇 𝑝𝑜𝑠𝑖𝑡𝑖𝑣𝑒𝑠
𝑇𝑜𝑡𝑎𝑙 𝑛𝑢𝑚𝑏𝑒𝑟 𝑜𝑓 𝑝𝑎𝑟𝑡𝑖𝑐𝑖𝑝𝑎𝑛𝑡𝑠 𝑇𝑆𝑇 𝑡𝑒𝑠𝑡𝑒𝑑 𝑎𝑛𝑑 𝑟𝑒𝑎𝑑
The overall prevalence LTBI was calculated, and by age groups and HIV status. All 95% confidence intervals were also calculated.
9.2 Annual risk of infection (ARI)
Annual risk of infection (ARI) with
M. tuberculosis
in children age 0 to 14 years
was calculated using the formula:
𝐴𝑅𝐼 = 1 − (1 − 𝑃)
1/𝑎;
9.3 Factors associated with LTBI prevalence
We opted for a multilevel (hierarchical) structure of our data with Individuals and households (first level) nested into 20 township neighborhoods (second level). We calculated the intraclass correlation coefficient (ICC) to assess the magnitude of variability due to the covariates at the neighborhood level in order to determine whether multilevel logistic models
were appropriate.[165-167] TheICC was calculated by fitting a “null model” using the Stata
command gllamm.[168]
We used bivariate and multivariable logistic regression to identify individual level factors associated with LTBI. Starting from a full model with all potential predictors, we employed a stepwise backward elimination approach removing the least significant factor one at a time to reach a parsimonious final model that only included the factors significantly associated with LTBI. We repeated the model building procedures using stepwise forward selection to check whether this yielded the same final model. Associations between predictors and LTBI are summarized in odds ratio (OR) along with 95% CIs and the associated p-value. Data analysis
was conducted using Stata version 13.1 (Stata Corp, College Station, TX).
10. Statistical analysis for Aim 2:
To investigate the spatial patterns of LTBI and their spatial risk factors in the urban informal settlement of Diepsloot, South Africa.
10.1 Detection of spatial patterns
First, we identified spatial hotspots of LTBI prevalence using the spatial scan statistics (SaTScan).[169] SaTScan is widely used method for spatial hotspots detection in the
the circular window is changed continuously so that it can take any value from 0 up to a pre-specified maximum value. A maximum circular window of 0.5 km was used for scanning potential hotspots with high or low numbers of LTBI in this study area.
The SatScan software uses a likelihood ratio test to evaluate the statistical significance of each potential hotspot by calculating a likelihood ratio assuming that the number of LTBI in each circular window is an independent Bernoulli random variable, with the likelihood L0 under
null hypothesis of spatial randomness. For each circular window, the number of observed and expected cases of LTBI within and outside the circular window is calculated. The circular window with the highest likelihood ratio values is identified as a LTBI hotspot. P-value
associated with likelihood ratio test was determined using Monte Carlo simulations and used to evaluate whether the LTBI hotspot is significantly different form the neighboring space.
After identifying statistically significant spatial clusters, we determined if these areas change when the model is adjusted for known risk factors for LTBI including age, HIV status, sex, conducting separate analyses for each covariate. When adjusting for categorical
covariates, the SaTScan program will search for clusters above and beyond that which is expected due to these covariates. We adjusted for covariates when all three of the following are true:
• The covariate is related to the LTBI.
• The covariate is not randomly distributed geographically.
• It is of interest to identify clusters that cannot be explained by that covariate. For
example, it is of interest to find clusters of LTBI that are not due to geographic differences in socio-economic status
For the Poisson model, the expected number of LTBI cases in each area under the null-hypothesis was calculated using indirect standardization. Without covariate adjustment the expected number of cases in a location is
E[c] = p*C/P
where c is the observed number of cases and p the population in the location of interest, while C and P are the total number of
cases and population respectively.
Let ci, pi, Ci and Pi be defined in the same way, but for covariate category i. The indirectly standardized covariate adjusted expected number of cases (spatial analysis) is:
E[c] = ΣiΣiE[ci] = pi * Ci / Pi
By adding one covariate at a time, the analysis allows for assessment of how the underlying geographic distribution of that covariate affects the distribution of LTBI prevalence.
10.2 Assessment of spatial factors associated with LTBI prevalence clusters
To investigate factors associated with LTBI hotspots, we first fitted OLS regression model.
OLS model:
Y
i=LTBI
i=
β0+
β
1X
1+
β
2X
2+
……
.+
ε
iwhere Yi is the dependent variable (LTBI) measured at some location i, Xi is the independent variable, εi is a random error term
assumed to be normally distributed, β0 is the intercept and β1 is the parameter to be estimated.
We tested for the normality, multicollinearity and spatial independence assumptions of the OLS model. Multicollinearity was assessed through variance inflation factor (VIF) values. VIF greater than 10 indicates multicollinearity.[171] The OLS is a global model and expects variable relationships to be constant (stationary) across the study area. The underlying assumption of a multivariate regression model is thus that the relation under study is spatially constant.[172] To adjust for multiple comparisons, we applied the false discovery rate method which was implemented using the smileplot add-on module to Stata 13.[173] The spatial
independence of residuals was evaluated using the spatial autocorrelation coefficient, Moran’s I
spatial independence) will occur when high values of a variable in location i tends to be
clustered with high values of the same variable in locations that neighbors of I and vice versa. The association between risk factors and disease of interest are unlikely to be stationary and more likely to vary over space. The parameter estimates might thus demonstrate significant spatial variation.[172] In that case, we investigated the association between LTBI hotspots and covariates using a geographical weighted regression (GWR)model.[172] A GWR model accounts for and examines the presence of spatial nonstationarity in the association between variables. The GWRis a local model that takes into account how the relationship between the dependent variable (LTBI) and each explanatory variable fluctuates geographically. As such, the GWR model produces more informative results regarding parameters over spatial area under investigation.[172]
GWR model: Y
ij=LTBI
ij=
α
0(
ui
,
vi
) +
Σ
kβ
k(
ui
,
vi
) x
ik+
ε
ijwhere (ui, vi) denotes the geographic (GPS) coordinates of the ith point and βk (ui, vi) is a realization of the continuous function βk
(u, v) at point i. to allow a continuous surface of parameter values and measurements of this surface taken at certain points to
denote the spatial variability of the surface.
CHAPTER 3: AIM 1 RESULTS
1. Introduction
Tuberculosis (TB) remains a significant public health problem worldwide with an estimated 9 million cases and 1.3 million deaths in 2013.[1, 175] In 2013, South Africa had the second highest burden of TB in the African region and was ranked fifthamong the 22 countries classified by the World Health Organization as high TB burden countries.[1] In 2013, more South Africans died of TB, predominantly HIV-associated TB, than any other disease.[176] These statistics suggest that the current TB control strategy is unable to control the TB epidemic in
South Africa, which is fueled by both progression from LTBI to active disease, in large part due to HIV co-infection, and ongoing transmission of Mycobacterium tuberculosis (M.
tuberculosis).[177]
Globally, about 2.6 billion people are infected with M. tuberculosis, representing a large reservoir of people at risk of progression to active TB disease.[1, 17, 44, 45, 178] About 5-10% of people with LTBI progress to active TB disease in their lifetime, the majority within 2 years of infection.[179] Those at highest risk of progression to active TB disease are young children and immunocompromised individuals.[22, 178, 180] To date, studies of the burden of LTBI in South Africa have mainly focused on high-risk populations such as young children, adolescents, household contacts of TB cases, people living with HIV, gold miners and health care workers.[58,
59, 95, 181-183] These studies observed LTBI prevalence ranging from 26% up to 89%. The only
community-based study, performed in an urban township of Cape Town, observed a very high (88.0%) LTBI prevalence, but the study was limited to healthy HIV-negative individuals.[65]
all residents of an urban South Africa township and determine factors associated with LTBI.
2. Materials and methods
2.1 Study site and Study population
The study was conducted in Diepsloot, a densely populated, urban township located in northern Johannesburg, South Africa. The community covers an area of 12 km2 and has an estimated population of 136,289, corresponding to a very high population density of 11,357 people/km2.[184] The area is typical of urban South African townships, consisting of informal settlements with a mix of high-density shacks and government-subsidized brick houses. According to the 2006 Johannesburg Poverty and Livelihoods Study, Diepsloot is one of the poorest urban informal settlements in Johannesburg.[185]
This analysis represents a sub-study of a large community-based household health survey conducted between May 2013 to March 2014 using a random sampling framework. Geographic coordinates were generated from an aerial map of the 13 digital geo-referenced extensions of the township. Geographic coordinates were randomly selected within each extension and the number of coordinates per extension was proportional to the size of the extension. The randomly selected coordinates were then located by the study team using a hand-held geographic positioning system (GPS) device (eTrex 10, Garmin). The household nearest to but within 30m of each randomly selected geographic coordinate was eligible for study participation. If multiple households were equidistant from the geo-coordinate, the survey team randomly selected one household using a random number generator. Following this method, survey teams approached 2006 households. Households where no-one could be found home despite up to five repeat visits were considered as attempts exhausted and not replaced.
At time of the home visit, the exact latitude and longitude coordinates of the house were geocoded. When a household member agreed for the household to participate in the survey, all household members were enumerated. One of the enumerated adult (≥15 years) household
procedure was implemented to avoid the selection bias that would have occurred had the adult household member at home at the time of the survey been systematically selected for study participation. If the adult household member selected for study participation was not home, then the survey team made up to four additional attempts before the household member was
considered unreachable. Selected adults who could not be reached were not replaced. All childhood household members were invited to participate in a health assessment if the selected adult household member was their parent or legal guardian and consented for their study participation. If a child <15 was not at the household at the time the selected adult participant was interviewed, no return home visits were made for the child.
Using a structured questionnaire offered in English, Sesotho or IsiZulu, data on socio-demographics and household characteristics, education and employment, history of TB or contact with TB, and alcohol and smoking habits were collected from all adult participants. A health assessment was performed in all adult and child participants. Weight and height were measured, and blood was collected for hemoglobin and HIV testing by a trained lay HIV counsellor. Participants were assessed for symptoms of active TB and a tuberculin skin test (TST) was placed by a trained nurse. A quantity of 0.1 ml (5TU) of purified protein derivative (PPD) (Aplisol and Tubersol) was injected in the fore arm; the size of induration was read 48 to 72 hours later. Because of adverse events observed in HIV negative individuals, including blistering and ulceration, in consultation with the ethics committee overseeing the study, we decided to restrict placement of TST to HIV positive individuals and children <5 years of age starting from October 2013.
2.2 Study variables
The outcome of LTBI was based on TST positivity, with a TST considered positive if the induration was ≥5 mm in people living with HIV or ≥10 mm in those with unknown or HIV
Individual covariates included age (<15, 15-24, 25–34, 35–44 or ≥45 years); sex (male
or female), HIV status (positive or negative/unknown), body Mass Index(BMI;
underweight/normal if BMI ≤18.5 - 24.9 kg/m2, overweight if BMI 25 - 29.9 kg/m2, or obese if
BMI ≥30 kg/m2) presence ofanemia (with anemia defined as hemoglobin value below 13.0 g/dl
for men, <12.0 g/dl for women and children aged 12 to15 years, <11.0 g/dl or children under 5 years, or <11.5 g/dl for children aged 5 to12 years; all down-adjusted by 0.65 g/dl because of altitude),[162] education (primary or less vs. secondary or higher); marital status (living with partner or not living with a partner); employment status (unemployed or employed);household contact with TB (yes or no); smoking status (ever or never), and alcohol consumption (yes or no).
The household-level covariates included were household socioeconomic status (SES), household ventilation and household exposure to smoking. Household SES was calculated as a composite index developed by factor analysis based on household ownership of durable goods (car, motorcycle, bicycle, refrigerator, television, radio, and mobile phone), house ownership, source of drinking water, and type of toilet facilities.[163, 187] Household SES indices were categorized into tertiles of highest, median and lowest household SES. Household ventilation was defined based on the frequency household members sleep with the window open (always, only when warm enough, never, no windows in the house), household exposure to secondary smoking as (yes or no).
3. Statistical analysis
LTBI prevalence was calculated by dividing the number of participants with a positive TST by the total number of participants with a TST result and 95% confidence intervals (95% CI) were estimated. Annual risk of infection (ARI) with M. tuberculosis in children age 0 to 14 years was calculated using the formula𝐴𝑅𝐼 = 1 − (1 − 𝑃)1/𝑎; where P isthe observed
prevalence of LTBI, and a the mean age of participating children.[188, 189]
We opted for a multilevel (hierarchical) structure of our data with Individuals and households (first level) nested into 20 township neighborhoods (second level). We calculated the intraclass correlation coefficient (ICC) to assess the magnitude of variability due to the covariates at the neighborhood level in order to determine whether multilevel logistic models
were appropriate.[165-167] TheICC was calculated by fitting a “null model” using the Stata
command gllamm.[168]
We used bivariate and multivariable logistic regression to identify individual level factors associated with LTBI. Starting from a full model with all potential predictors, we employed a stepwise backward elimination approach removing the least significant factor one at a time to reach a parsimonious final model that only included the factors significantly associated with LTBI. We repeated the model building procedures using stepwise forward selection to check whether this yielded the same final model. Associations between predictors and LTBI are summarized in odds ratio (OR) along with 95% CIs and the associated p-value. Data analysis was conducted using Stata version 13.1 (Stata Corp, College Station, TX).
4. Ethics statement
This study was approved by the institutional review board of University of North Carolina at Chapel Hill and by the University of the Witwatersrand’s Human Research Ethics Committee.
for all children <18 years old and child assent was obtained for participating children ages 7-17 years old.
5. Results
5.1 Study participants
Of the 2006 randomly selected households, 1620 could be enumerated. Of the 1620 randomly selected adults, 1581 (97.6%) could be contacted and 1230 agreed to participate. (Fig 3.1) In addition, 169 children living in the same household as the participating parent were enrolled. TST was offered to 626 participants (all participants until October 2013, only HIV positive individuals and children <5 thereafter). Of these, 144 refused and TST was not placed in a further 23 due to logistical considerations (e.g. the participant would not be available to have the TST read). Of the 459 participants in whom a TST was placed, the TST was read in 446 (97%). The remaining 13 could not be traced within 48-72 hour of TST placement.
Among the 446 participants with TST result, mean age was 35 years, 11% were 0 to 15 years of age, 17% were 15 to 24 years, 33% were 25 to 34 years, 18% were 35 to 34 years and 21% were 45 years or older (Table 3.1). Sixty percent were female, 44% were married or living with a partner, two thirds (67%) were unemployed and the majority (72%) had at least some secondary education. Self-report of smoking (26%) and alcohol use (37%) was relatively low. Overall, 18% of the 446 participants with TST result were HIV positive, 35% were anemic, 23% were underweight and 27% obese. Only 6% of participants reported a history of contact with a TB case. Almost all (93.4%) participants either lived in a house without windows or never slept with windows open and 20% were exposed to household secondary smoking.
5.2 Distribution of TST results, LTBI Prevalence and Annual Risk of infection
LTBI prevalence increased with age, from 19% in the 0–14 age group to 45% in the 45 and
older age group (p=0.002), was higher in women (37%) than men (32%) (p=0.273), but similar in HIV positive (36%) and HIV negative (32%) participants (p=0.553) (Table 3.2). Based on changes in TST prevalence with age among children age 0 to 15 years, the ARI was estimated at 3.1% (95% CI: 2.1 - 5.2).
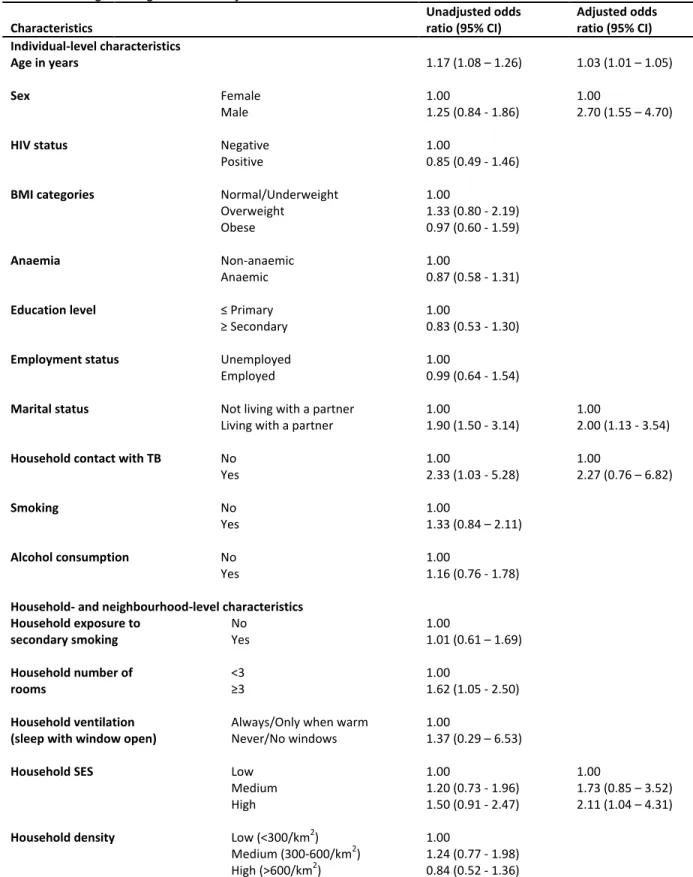
5.3 Factors associated with LTBI at individual and household level
In univariable logistic regression, age showed a strong association with LTBI with
increasing odds of LTBI for every year increase in age (OR =1.17, 95% CI = 1.08 – 1.26) (Table
3.3). Other variables associated with LTBI were marital status, with individuals living with a partner being twice as likely to have LTBI compared with those living with a partner (OR =2.00, 95% CI: 1.06 - 3.80); history of household contact with TB , with those reporting such history being twice as likely to have LTBI compared with those not in household contact with a TB case (OR = 2.33, 95% CI: 1.03 - 5.28); and number of room in the house, with people living in
dwellings with 3 or more rooms being more likely to have LTBI compared to people living in dwellings with less than 3 rooms (OR = 1.62, 95% CI: 1.05 - 2.50). People of the highest tertile of SES were 1.5 times more likely to have LTBI as compared to the lowest SES tertile, but the 95% CI crossed 1 (95% CI 0.91 - 2.47). In multivariable logistic regression, age (OR =1.03, 95% CI = 1.01 – 1.05), male gender (OR =1.77, 95% CI = 1.10 – 2.86), being married/cohabitating (OR =2.00, 95% CI = 1.13 – 3.54) and living in a household that belongs to the highest tertile SES of the community (OR 2.11, 95% CI 1.04 – 4.31) were independently associated with a
diagnosis of LTBI.
5.4 Factors associated with LTBI at neighborhood level
None of the neighborhood level factors were associated with LTBI. The multilevel ‘‘null’’
level may have been due to the sparsity of level 2 clusters with only 20 neighborhoods (level 2
clusters), smaller than recommendation of 50 level 2 clusters
.
[190]6. Discussion
The burden of LTBI in this urban informal settlement community of northern
Johannesburg, South Africa, was high with an overall prevalence of 34.3% and an annual risk of infection of 3.1%. Risk factors independently associated with LTBI prevalence were older age, male gender, living with a partner, and high SES.
While the LTBI burden observed was high, the 34.3% prevalence was lower than has been observed in the few prior population-based studies previously performed in urban townships. In a Peruvian shantytown and a Ugandan urban population, the LTBI prevalence was higher, with half of all residents living with LTBI (52%; 95% CI: 48-57 in Peru and 49%; 95% CI:
44-55 in Uganda).[191, 192] A study of 8 South African urban communities however showed that LTBI prevalence among household contacts can be highly variable between communities in the same region, as they documented a range of LTBI prevalence from 24% to 77%.[193] The ARI in our study fell within the range of ARI estimates from prior South African studies (2.8% -
5.8%).[58, 194] Taking together, these results suggest that the LTBI prevalence in urban settlements is high, but shows substantial variation.
Individual risk factors for LTBI were household contact with a TB case, (OR 2.96 95% CI 1.21 – 7.24) increasing age (OR for each 1 year increase 1.03; 95% CI: 1.01-1.05), male gender (OR 1.77; 95% CI: 1.10-2.86), and living with a partner (OR =2.00, 95% CI = 1.13 – 3.54).