TRIGGER WARNINGS: WHEN IS GOODWILL IMPAIRMENT DISCLOSURE INFORMATIVE?
Maria Nykyforovych
A dissertation submitted to the faculty of the University of North Carolina at Chapel Hill in partial fulfillment of the requirements for the degree of Doctor of Philosophy in the
Department of Accounting.
Chapel Hill 2017
ABSTRACT
MARIA NYKYFOROVYCH: Trigger Warnings: When Is Goodwill Impairment Disclosure Informative?
(Under the direction of Jeffery Abarbanell)
TABLE OF CONTENTS
LIST OF TABLES . . . iv
LIST OF FIGURES . . . v
1 Introduction . . . 1
2 Literature Review and Hypothesis Development . . . 11
2.1 Related Literature . . . 11
2.2 Hypotheses Development . . . 13
2.2.1 Assessment of Information Content of SFAS-142-mandated Disclosures . . . . 13
2.2.2 The Relation Between Impairment-Related Disclosures and Infor-mation Asymmetry . . . 15
2.2.3 Do Current Impairment-Related Disclosures Relate to Subsequent Future Impairments? . . . 16
3 Data and Measurement . . . 18
3.1 Data Collection . . . 18
3.2 Goodwill Impairment Announcement Date . . . 19
3.3 Matched Samples . . . 20
4 Methodology . . . 27
4.1 Measures of Abnormal Return Volatility and Abnormal Trading Volume . . . 27
4.2 Market Reactions to Earnings/Goodwill Announcements . . . 28
4.3 Factor Analysis . . . 29
5 Results . . . 34
5.1 Descriptive Statistics . . . 34
5.2 The Information Content of Goodwill Impairment Disclosures . . . 36
5.3 Market Microstructure Effects of Goodwill Impairment Disclosure . . . 40
5.4 Tests of the Predictive Power of Goodwill Impairment Disclosure . . . 41
6 Conclusions . . . 50
LIST OF TABLES
1.1 Examples of Triggering Event Disclosures in Firms’ Financial Statements . . . 8
3.1 Variable Definitions and Data Sources . . . 21
3.2 Sample Selection Procedure. . . 23
3.3 Descriptive Statistics for Impairment Firms . . . 24
3.4 Descriptive Statistics for Non-Impairment Firms. . . 25
3.5 Sample Industry Composition. Top 25 SIC codes. . . 26
4.1 Exploratory Factor Analysis . . . 30
4.2 Distribution of Firms by Number of Goodwill Impairments, 2003-2013. . . 32
5.1 Distribution of Goodwill Impairments by Year/Quarter and Impairment Sequence Number. . . 35
5.2 Differences in Abnormal Return Volatility (ARV OL) and Abnormal Trad-ing Volume (AT V OL) Changes in Response to Goodwill Impairment/Earn-ings Announcements, by Triggering Event . . . 43
5.3 The Information Content of Firm-Specific vs. Economy- and Indistry-Specific Impairment Disclosures, by Disclosure Factor . . . 44
5.4 Market Microstructure Effects of Goodwill Impairment Disclosures . . . 45
LIST OF FIGURES
5.1 Market reaction to earnings announcements by goodwill-impairing, positive
goodwill and zero goodwill firms in 2003-2013, i.e. after SFAS 142 intro-duction. Left panel presents results for abnormal trading volume, right panel
- for abnormal return volatility. . . 37
5.2 Market reaction to earnings announcements by positive goodwill and zero
goodwill firms in 1991-2001, i.e. before SFAS 142 introduction. Left panel presents results for abnormal trading volume, right panel - for abnormal
return volatility. . . 37
5.3 Market reaction to goodwill impairment disclosure that names economy-wide
developments, competition or decline in market capitalization as a triggering event. Positive and zero goodwill firms represent companies matched to impairing firms by size and industry. Left panels present results for abnormal
trading volume, right panels – for abnormal return volatility. . . 47
5.4 Bid-ask spreads and market liquidity around earnings announcement days of
positive goodwill and zero goodwill firms in 1991-2001, i.e. before SFAS 142 introduction. Market liquidity is measured by the Amihud measure. Left
panel demonstrates bid-ask spreads, right panel shows Amihud measure. . . 48
5.5 Bid-ask spreads and market liquidity around goodwill impairment/earnings
announcement days of goodwill-impairing, positive goodwill and zero good-will firms in 2003-2013, i.e. after SFAS 142 introduction. Market liquidity is measured by the Amihud measure. Left panel demonstrates bid-ask spreads,
right panel shows Amihud measure. . . 48
5.6 Bid-ask spreads and market liquidity around goodwill impairment/earnings
announcement days of goodwill-impairing, positive goodwill and zero good-will firms in 2003-2013. Goodgood-will-impairing group of firms consists only of those that disclosed major customer loss, rising costs as a triggering event or did not disclose any details about a goodwill write-down. Market liquidity is measured by the Amihud measure. Left panel demonstrates bid-ask spreads,
CHAPTER 1 INTRODUCTION
This paper investigates the information content of disclosures related to goodwill impairment testing under the Statement of Financial Accounting Standards (SFAS) 142 regime. At the time SFAS 142 was issued (2001) the Financial Accounting Standards Board (FASB) noted that intangi-ble assets are an increasingly important economic resource for many entities and are an increasing proportion of the assets acquired in many transactions. As a result, better information about intangi-ble assets was needed (FASB (2001), p.3). While extensive research analyzing the consequences of SFAS 142 adoption exists, none of the papers to date have looked into firms’ detailed goodwill impairment-related disclosure and financial statement users’ reaction to such disclosure. This paper seeks to fill this void.
Aside from a discussion of SFAS 142 effectiveness, the study of goodwill impairments rep-resents an interesting area of research for a number of reasons. First, both the magnitude and the frequency of goodwill impairments increased substantially, suggesting that it is an economically significant set of events. Second, goodwill impairments are charged against net income, creating a complex event response system from managers, investors, analysts and other financial statement users. Third, goodwill is an inherently hard-to-evaluate asset because of considerable managerial discretion with regards to the impairment recognition timing and amount. This study aims to shed new light on the issues of SFAS 142 disclosure informativeness and goodwill impairment causes and consequences.
standard to manage financial reports opportunistically. Moreover, in addition to the points raised by proponents and critics of SFAS 142, it is possible that the required disclosures may not be useful to investors or may be pre-empted by information available through other sources during the time
periods that precede goodwill impairment announcements.1 Empirical literature reports mixed
results on the market reaction to goodwill impairments.2 Ramanna and Watts (2012) note that
while SFAS 142 might be net beneficial, they do not find any evidence to this effect. By presenting descriptive as well as quantitative evidence on the effects of SFAS 142 adoption, this paper takes an overarching approach in assessing the standard and informs the debate surrounding the issue of goodwill impairment testing and reporting.
First, I examine whether the market reacts to an additional detailed goodwill impairment-related disclosure mandated by SFAS 142. I find that the market reaction differs depending on the type of a triggering event cited by the firm at the time of a goodwill impairment announcement. Furthermore, in addition to a stock return measure of information content used in prior studies, I employ an abnormal trading volume measure (Beaver (1968)). Changes in price indicate the average change in investors’ beliefs while trading volume reflects idiosyncratic reactions to the announcement. This approach captures changes in expectations of individual investors in response to a firm’s public disclosures, a market response that is not reflected in various return-based measures of information
content employed by previous studies in this area.3 Again I find that results differ, depending on
the triggering event. These findings may explain previous mixed evidence on market reactions to goodwill announcements that did not account for the triggering events disclosed by firms at the time of goodwill impairment recognition.
1For example, if managers report opportunistically, consistent with critics’ concerns, then additional goodwill
impair-ment disclosures result in release of distorted information to which the market does not respond. Alternatively, the market might see through the information distortion, making required disclosures uninformative.
2Francis et al. (1996) find no significant market reaction to goodwill impairments, while Hirschey and Richardson (2002)
report negative market reaction. Bens et al. (2011) find a decrease in the information content under the SFAS 142 regime; Li and Sloan (2015) conclude that SFAS 142 did not change the information content of goodwill impairment announcements.
3Chen et al. (2008) use return-earnings regressions to assess the impact of goodwill announcements on firm stock
Second, I find that firm-specific goodwill impairment disclosure helps predict future goodwill write-downs for firms that record multiple impairments. These results lend support to FASB’s assertion that SFAS 142 provides financial statement users with better understanding of changes in goodwill over time, thereby improving their ability to assess a firm’s future profitability and cash flows. Moreover, this finding suggests that when the SEC requests additional information about goodwill impairment testing, it should encourage filers to disclose more firm-specific information about how economic events affect the firm rather than provide a blanket discussion of the economy-and/or industry-level developments.
Finally, I analyze changes in information asymmetry around public disclosures about good-will write-downs. I find evidence consistent with the predictions of Kim and Verrecchia (1994) that suggests that public disclosures of detailed goodwill impairment information induce post-announcement information acquisition by sophisticated investors, which increases information asymmetry immediately after the disclosure is made and leads to a differential interpretation of firm value. Additional tests demonstrate that XBRL introduction amplified this effect, consistent with findings of Blankespoor et al. (2014) that a reduction in investors’ data aggregation costs may not serve its intended purpose of leveling the informational playing field. Thus, SFAS 142-mandated disclosures benefit larger investors that are able to leverage their superior resources and abilities to gain further trading advantages from public disclosures, consistent with increased concerns of adverse selection.
In order to conduct the analysis described above, I examine SEC filings on interim annual (quarterly) impairment tests and collect goodwill impairment-related disclosures such as triggering events, valuation methods, use of third-party valuators etc. After combining the hand-collected data with other datasets providing relevant controls from prior literature, the resulting final sample consists of 227 firms with 472 reported goodwill write-downs. Consistent with firms having extensive variation in the types of triggering events producing impairments, I identify 16 distinct
triggering event categories.4 Industry-specific factors, poor past operational performance and
expectation of lower future performance represent the most frequently cited impairment indicators. This observation is in contrast to the SEC position that considers the decline in market capitalization as a leading triggering event for goodwill impairment testing. According to the EY report (EY (2016), p.104), the SEC frequently challenges firms’ decisions not to impair goodwill after a significant decline in company’s market capitalization. Additionally, I observe that 36 companies choose not to disclose any information related to their goodwill impairment decision, even though SFAS 142 specifically requires firms to make such disclosures available in their financial statements.
Next, I analyze whether the market reaction to goodwill impairments differs depending on the category of a triggering event cited by a firm at the time of a goodwill write-down announcement. In addition, I re-estimate the above relation combining the 16 triggering event variables into three factors using exploratory factor analysis. Two factors group triggering events more commonly associated with firm-level event disclosures. The remaining factor captures triggering events more closely aligned with economy-wide or industry-level event types. I find that while some triggering events are associated with changes in abnormal returns and trading volume, others experience significant associations with only one or neither of the above measures. For example, a decline in market capitalization does not result in significant announcement changes in abnormal return volatility or abnormal trading volume. Intuitively, this is explained by the fact that changes in stock price are easily observable in periods that precede the goodwill impairment announcement. Thus, efficient market prices already reflect this information resulting in an insignificant goodwill write-down market reaction. On the other hand, the disclosure of a firm-specific triggering event like major customer loss is related to a significant abnormal return volatility and, to a lesser extent, abnormal trading volume, indicating an adjustment of the market’s prior expectations about a firm in response to new information. In line with the results of tests examining the individual triggering events, I find that the two factors tied to the firm-level goodwill impairment-related disclosure are significantly and positively associated with increases in abnormal return volatility and abnormal trading volume, while the factor linked with economy and industry-level impairment disclosure does not have a statistically significant effect on these two outcomes in most regression specifications. Overall, the results from both sets of tests confirm my prediction that the market response to goodwill impairment disclosures differs depending on the triggering event type.
that disclosure of financial accounting information can induce post-announcement information acquisition by sophisticated investors, which increases information asymmetry and/or differential interpretations of firm value.
In my final set of tests, I examine whether past triggering events have predictive power to assess future goodwill impairment probability for firms with multiple impairments. More than half of the firms in the hand-collected sample recorded multiple goodwill impairments after the introduction of SFAS 142. Exploiting this fact, I employ an extension of a proportional hazard model that takes into account time-varying covariates and a possibility of multiple impairments by the same company. I predict that if triggering event disclosures provide additional useful information to investors in assessing future performance of the firm (particularly in the realm of its goodwill), then impairments in the current period are likely to be indicative of potential future impairments. Consistent with this prediction, I find that firm-level triggering events such as competition, major customer loss or new legislation/regulation are significantly positively associated with a hazard of subsequent goodwill impairment recognition. Disclosure of triggering events related to one of the two firm-specific information factors also indicates a shorter time to the next impairment. This test provides additional evidence that the enhanced disclosure detail required by SFAS 142 provides financial statement
users with incremental information that is relevant for assessing future goodwill-related outcomes.5
This paper contributes to the literature in several ways. The first is the literature on intangible assets, to which this study contributes by providing evidence that disclosure of fair value estimates and details surrounding intangible assets’ valuation process lead to more informative prices, but only if firms provide firm-specific disclosures of facts and circumstances that directly affect fair values of such assets. Additionally, this paper provides initial evidence that SFAS 142 altered earnings announcements market response for firms with positive goodwill balances. Before SFAS 142 was implemented zero goodwill firms, on average, experienced a higher market reaction to earnings announcements than positive goodwill firms. After the adoption of the new standard, however,
5This is in contrast to the findings of Hayn and Hughes (2006). Analyzing single impairments that follow
positive goodwill firms experience consistently stronger earnings announcement market responses, suggesting that the absence of a goodwill impairment in the earnings announcement also conveys news to the market.
The second stream of literature is that on real consequences of accounting regulation. This study informs the debate on the market impact of SFAS 142, a highly controversial standard. I demonstrate that the market response magnitude differs depending on a type of triggering events disclosed by a firm at the time of a goodwill impairment decision. Firm-specific disclosures consistently demonstrate higher information content over the economy- and industry-related discussions. This result suggests that financial statement users require more detailed firm-specific disclosures related to goodwill impairment testing and write-down recognition. The SEC and FASB might consider this finding while developing future disclosure guidance for financial statement filers. As for the empirical literature, this result may explain previous mixed findings that indicated weak or almost non-existent market reaction to goodwill impairment announcements. The degree of market response may vary depending on a sample composition in terms of time period, industry representation
and/or underlying triggering events distribution.6 Furthermore, I contribute to the literature that
studies determinants of goodwill impairments by demonstrating that if a firm records multiple goodwill impairments, certain past triggering events affect the probability of subsequent goodwill write-downs by the same firm. This finding lends support to FASB’s assertion that SFAS 142 provides financial statements users with better understanding of changes in goodwill over time, thereby improving their ability to assess a firm’s future profitability and cash flows.
The remainder of this paper is structured as follows. Section 2 discusses previous research and develops testable hypotheses. Data sources and data collection procedure is described in Section 3. Section 4 discusses methodology employed in this study, while Section 5 reviews sample descriptive statistics and empirical results. Section 6 concludes.
6The use of alternative market reaction measures (cumulative abnormal returns (CARs), buy-and-hold returns (BHARs))
CHAPTER 2
LITERATURE REVIEW AND HYPOTHESIS DEVELOPMENT
2.1 Related Literature
Substantial accounting literature analyzes asset write-downs and long-lived asset impairments, including those of goodwill. One stream of literature analyzes whether companies use goodwill impairments to manage earnings in the form of earnings smoothing or big bath accounting. Zucca and Campbell (1992) find that a majority of asset write-downs occur in periods with unexpectedly low earnings, consistent with big bath behavior. Furthermore, over a quarter of write-downs appeared to follow a pattern of income smoothing. Rees et al. (1996) find that companies tend to write down assets in periods when earnings are low relative to industry medians. Francis et al. (1996) report that asset impairments are less likely for companies with poor performance and with unusually good performance, the opposite of what would be expected if write-offs were motivated by big bath accounting and income smoothing. Riedl (2004) finds that post-SFAS 121 write-offs are less strongly associated with economic factors and more strongly associated with big bath accounting.
Longer-serving CEOs may be reluctant to write off goodwill because the losses may reflect negatively on the M&A transactions which they initiated in earlier periods, while new CEOs might be inclined to accelerate goodwill impairments to start their tenure with a clean slate. Beatty and Weber (2006) and Ramanna and Watts (2012) also find evidence that indicates that the likelihood of companies writing off goodwill is lower if their CEO’s pay package includes a cash bonus.
Evidence on the market reaction to asset impairments is mixed. For example, Strong and Meyer (1987) found positive reactions to asset write-offs while Elliott and Shaw (1988) document a negative market response. Francis et al. (1996), examining several types of asset write-downs, find little to no market reaction to goodwill impairment announcements. On the other hand, Hirschey and Richardson (2002) document that the information effects narrowly tied to goodwill write-off announcements are typically negative and material, on the order of 2-3% of the company’s stock price. Following SFAS 142 adoption several studies observe a decline in market reaction to goodwill announcements. For example, Bens et al. (2011) present exploratory evidence of a decrease in the information content of goodwill impairments manifested through a weakened (no change in) reaction to impairment announcements for the high (low) information asymmetry and larger (smaller) firms. The authors attribute their findings to the increasing complexities of applying SFAS 142 that results in an increased noise level of reported impairments.
Assessment of the predictive power of disclosures related to goodwill impairment testing and recognition relates to the work of Hayn and Hughes (2006). Analyzing single impairments that follow goodwill-creating mergers or acquisitions, they find that the amount and quality of goodwill impairment disclosures do not allow investors to effectively evaluate the appropriateness of management determinations regarding goodwill write-downs. In contrast to Hayn and Hughes (2006), I examine firms that report multiple goodwill impairments and assess the predictive power of triggering events disclosed at the time of the impairment announcement.
2.2 Hypotheses Development
2.2.1 Assessment of Information Content of SFAS-142-mandated Disclosures
Seminal papers by Ball and Brown (1968) and Beaver (1968) operationalize the concept of information content in the accounting literature. Beaver (1968) observes that information flow manifests itself through return and volume volatility around the announcement period. Changes in price indicate the average change in investors’ beliefs while trading volume reflects idiosyncratic reactions to the announcement. Analytical models of trade posit that the price reaction to an information event is a function of the precision of the announced information relative to the average precision of investors’ prior information and the surprise contained in the information signal plus noise. Based on the analytical model proposed by Kim and Verrecchia (1991), Atiase and Bamber (1994) note that predisclosure information asymmetry causes investors to form differential predisclosure expectations, which result in differential belief revisions when annual earnings are announced. These differential belief revisions, in turn, induce trading activity.
market as a whole while the latter reflects changes in the expectations of individual investors. Consequently, information released by a firm might be neutral in the sense of not changing the expectations of the overall market, manifesting in no price reaction. At the same time, if revealed information alters the expectations of individual investors, there would be shifts in portfolio positions reflected in the trading volume. Thus, a price-based measure of information content might be less sensitive to a goodwill announcement report than a volume-based measure. For example, a firm undergoing restructuring might release a restructuring plan well ahead of the earnings/goodwill announcement. In efficient markets this information will already be reflected in the stock price by
the time a firm cites Restructuringas a triggering event for a goodwill impairment. However,
such disclosure might influence individual investors’ expectations, resulting in significant changes in abnormal trading volume after the write-down announcement. Overall, I expect triggering events related to information publicly observable in prior periods to have less information content than triggering events that reveal private information of a firm’s insiders as the former category implies less information asymmetry between the firm and the market than the latter category does.
Previous research (Francis et al. (1996), Riedl (2004)) generally classifies factors related to asset impairment decisions into economy-, industry- and firm-level categories. Intuitively, I argue that the economy- and industry-level information is readily available and easy to obtain, thus resulting in less information asymmetry and more homogeneous predisclosure investor expectations. Firm-level information, on the other hand, is scarcer and harder to acquire resulting in higher levels of predisclosure information asymmetry. Atiase and Bamber (1994) find that the greater the level of predisclosure information asymmetry, the greater the disclosure’s effect on the investors’ trading activity. Additionally, (Kothari (2001), p.115) notes that the use of the firm-specific component alone enhances the power of the tests of the information content of accounting reports. Based on these arguments, I formulate the following hypotheses:
H1a: Firms that disclose firm-level triggering events experience higher abnormal stock return volatility than do firms that disclose triggering events related to economy- and industry-level information.
H1b: Firms that disclose firm-level triggering events experience higher abnormal stock trad-ing volume than do firms that disclose triggertrad-ing events related to economy- and industry-level information.
2.2.2 The Relation Between Impairment-Related Disclosures and Information Asymmetry
The primary motivation for hypotheses above relates to whether goodwill impairment disclo-sures have information content, depending on the type of triggering event. Another possibility is that information asymmetry systematically changes the flow and/or amount of informed trading that takes place around earnings/goodwill impairment announcement dates.
The relation between goodwill impairment-related disclosures and information asymmetry is an empirical question. Kim and Verrecchia (1994) present two ways to characterize public disclosure, each of which has different empirical implications. On one hand, public announcement may reduce information asymmetry in the economy where shareholders affiliated with the firm have superior information about the firm’s performance based on their affiliation. In this case, public disclosure reveals private information held by informed traders to market makers. As a result, bid-ask spreads are wider for an extended period of time before the disclosure occurs and narrow immediately after the news release. Thus, market makers increase the bid-ask spread during the period of greatest information asymmetry (which also lowers liquidity) to protect against traders with superior information, and lower the spread when news reduces information asymmetry (and improves liquidity) (Kim and Verrecchia (1994), p.44). This leads to the following hypotheses:
H2: Bid-ask spreads increase and liquidity decreases prior to earnings announcements that include a goodwill impairment.
Alternatively, some sophisticated market traders (”market experts”) acquire new private infor-mation in response to public goodwill impairment disclosures. These informed judgments, in turn, create information asymmetries between traders and market makers, resulting in higher bid-ask
spreads and less liquid market as a directconsequenceof more disclosure by the firm. Additionally,
in this equilibrium the trading volume generated by market experts is greater than the volume they drive out, meaning that less liquidity does not translate into less trading activity around news announcements (Kim and Verrecchia (1994)). The preceding discussion leads to the following hypotheses:
H4: Bid-ask spreads increase and liquidity decreases after earnings announcements that include a goodwill impairment.
H5: The influence on bid-ask spreads and liquidity after earnings announcements is greatest when goodwill impairments are associated with firm-specific triggering events.
2.2.3 Do Current Impairment-Related Disclosures Relate to Subsequent Future
Impair-ments?
Hayn and Hughes (2006) posit that the information content of goodwill impairment-related disclosure can be assessed through determination of the predictive power of items disclosed after SFAS 142 adoption. If information gained from the market and financial statements makes goodwill impairments fairly predictable, this suggests that market participants gain valuable information through SFAS 142 disclosures. Alternatively, lack of predictive power suggests that companies do not disclose sufficient information to provide users with a better understanding of the expectations about and changes in goodwill over time, as intended by FASB at the time of SFAS 142 release.
disclosures about previous goodwill impairments help predict future goodwill write-downs. This approach is different from previous research that studied predictive power of impairments based on acquisition characteristics (Hayn and Hughes (2006), Gu and Lev (2011)) and firm performance (Hayn and Hughes (2006), Li et al. (2011)).
I hypothesize that information about factors and circumstances that lead a firm to recognize one impairment might help in the evaluation of subsequent goodwill impairment probabilities. Therefore, I formulate the following hypothesis:
H6: Current goodwill impairment-related triggering events are associated with the likelihood of subsequent goodwill write-downs by the same firm.
CHAPTER 3
DATA AND MEASUREMENT
3.1 Data Collection
Data sample for this study comes from multiple sources. I begin by identifying all quarterly goodwill impairment observations spanning years 2003-2013 in the Compustat database. For a randomly selected subsample of firms I hand-collect goodwill impairment-related disclosures from annual (quarterly) reports located at the Securities and Exchange Commission’s EDGAR database website. Within the reports, information regarding goodwill impairment testing, triggering events and other SFAS 142-related disclosures are located in several different sections. Among them are the following: Risk factors; Management’s discussion and analysis of financial condition and operations; Critical accounting policies and estimates; Significant accounting policies ; Footnotes on goodwill and other intangibles.
In the next step these data are merged with stock return data from CRSP database, CEO tenure and compensation data from Execucomp database, debt covenant violation risk data from Demerjian and Owens (2016) and earnings surprise and analyst following data from IBES. Macroeconomic control variables come from the Federal Reserve Economic Data (FRED) database of the Federal Reserve Bank of St.Louis. Additionally, some supplemental control variables are obtained from the Capital IQ database. Table 3.1 contains a full list of variable definitions and respective data sources.
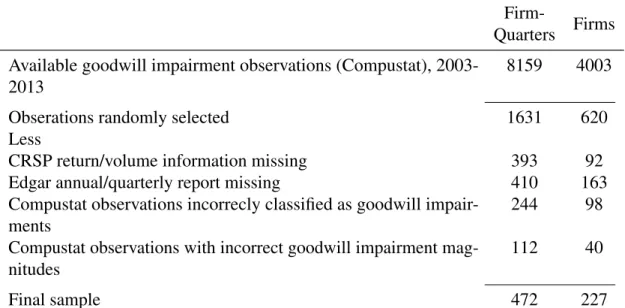
daily volume and return data missing during the event period, i.e., days -1, 0 and +1. Finally, I drop observations that are incorrectly classified as goodwill impairments by Compustat. Hodder et al. (2013) provide examples of Compustat problems related to reported goodwill data and recommend hand collection of goodwill impairment-related disclosures as the only feasible way of ensuring data accuracy. Thus, I identify incorrect Compustat observations by studying each firm’s annual and/or quarterly report that discusses SFAS 142-related procedures. I find that roughly 20% of the randomly selected goodwill impairment observations do not reflect respective firm disclosures. Typically, classification errors happen for the following reasons: (1) An asset other than goodwill is impaired. However, this asset write-down is classified as a goodwill impairment in Compustat. Impairments of radio broadcast licenses represent one example of such a misclassification; (2) An annual/quarterly report explicitly states that no goodwill impairments were recorded after SFAS-142 testing. However, Compustat goodwill impairment field for the respective quarter is populated.
Another potentially problematic data issue is related to Compustat-reported goodwill impair-ment magnitudes. In some instances reported goodwill write-down numbers represent a sum of impairments across several different asset types, both tangible and intangible. This issue is important in settings where goodwill impairment magnitude is used during sample construction (for example, only impairments that exceed a certain threshold are included in a sample). Additionally, these observations introduce noise to regression estimations that use goodwill write-down magnitude as a dependent variable. In my sample, I replace Compustat-reported numbers if correct goodwill im-pairment amounts could be traced in annual and/or quarterly reports. Otherwise, such observations are dropped from the analysis.
3.2 Goodwill Impairment Announcement Date
through various data sources, including company press-releases, conference calls, analyst forecast revisions etc. I randomly select 100 impairment observations from the hand-collected sample and compare Compustat goodwill announcement date to the earliest mention of the respective impairment in the Capital IQ’s Key Developments section. I find that only 3 out of 100 impairments have a separate and earlier goodwill impairment announcement date than the joint earnings/goodwill announcement date from Compustat. Thus, it is unlikely that such announcement date discrepancies can significantly bias against the finding information content in goodwill impairments in this study.
3.3 Matched Samples
Table 3.2: Sample Selection Procedure.
Firm-Quarters Firms
Available goodwill impairment observations (Compustat), 2003-2013
8159 4003
Obserations randomly selected 1631 620
Less
CRSP return/volume information missing 393 92
Edgar annual/quarterly report missing 410 163
Compustat observations incorrecly classified as goodwill impair-ments
244 98
Compustat observations with incorrect goodwill impairment mag-nitudes
112 40
CHAPTER 4 METHODOLOGY
4.1 Measures of Abnormal Return Volatility and Abnormal Trading Volume
Consistent with previous research (Beaver (1968),Landsman et al. (2012)), I measure the volatility of stock returns at the time of goodwill impairment announcements as the ratio of the event window return volatility to the return volatility during the non-event period. First, I estimate the following daily market model-adjusted returns regression:
uit =Rit−(ai+biRmt) (4.1)
whereRitis the stock return of firmifor dayt,Rmtis the market return for daytof the market
capitalization-based decile that firmibelongs to. Firmi’s market model parameter estimatesai and
bi are calculated during the non-event period. The non-event period is defined as dayst-150 tot-10
andt+10 tot+150 relative to the Compustat earnings announcement date,t=0.
Following DeFond et al. (2007) and Landsman et al. (2012), abnormal return volatility (ARV OL) is calculated as a natural log of a ratio of the mean of squared market model
ad-justed returns,u2it, to the variance of firmi’s market model residuals during the non-event period,
σi2, wheret=-1,0,+1 relative to announcement day 0.
ARV OLi =ln
u2
it σ2
i
(4.2)
Abnormal trading volume (AT V OL) is defined as a natural log of a ratio of the mean of the
AT V OLit=ln Vit
Vi (4.3)
Daily volume during the event announcement period,Vit, is shares of firmitraded during day
tdivided by shares outstanding of firmifor dayst-150 to t-10 andt+10 tot+150 relative to the
Compustat earnings announcement date,t=0.
4.2 Market Reactions to Earnings/Goodwill Announcements
I begin my test of whether abnormal return volatility and abnormal trading volume increase following a goodwill impairment announcement by estimating the following regression equations, by triggering event:
ARV OLit =β0+β1T rigEventit+β2T imeit+β3Sizeit
+β4N umEstit+β5RepLagit+β6Levit+β7Lossit
+β8SU Eit
(4.4)
AT V OLit=β0+β1T rigEventit+β2T imeit+β3Sizeit
+β4N umEstit+β5RepLagit+β6Levit+β7Lossit
+β8SU Eit
(4.5)
where ARVOL and ATVOL are abnormal return volatility and abnormal trading volume as defined
in section 4.1, andiandtrefer to firm and quarter-year, respectively. T rigEventis an indicator
variable specifying a particular triggering event that was cited by a goodwill-impairing firm as a reason underlying the impairment decision in a particular quarter-year.
trend variable,T ime, accounts for possible time trends inARV OLandAT V OL. Sizeis a natural
logarithm of the market value of equity measured at the end of each quarter-year; N umEst is
the number of analysts issuing forecasts during each firm-quarter-year observation. The reporting lag,RepLag, is calculated as a difference between the earnings announcement date as reported
by Compustat and the end date of the respective impairment quarter. Levis leverage computed
as a ratio of total liabilities to total assets, both of which are measured at the quarter end. Loss
is an indicator variable equal to 1 if a firm reports negative quarterly earnings per share, and zero
otherwise. SU Eis a mean standardized earnings surprise as reported quarterly by IBES database.
4.3 Factor Analysis
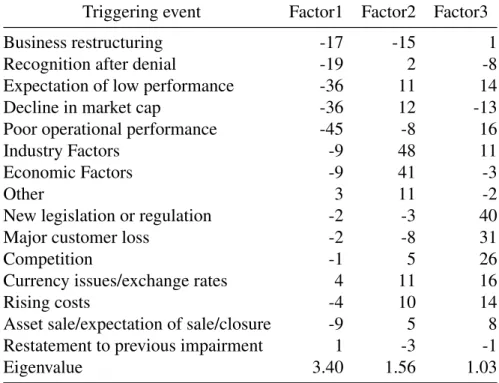
Since various triggering events are not independent and to increase the power of tests because of a small number of observations in certain triggering events categories, I combine the triggering event variables into factors using exploratory factor analysis (see Table 4.1). Initially, the number of components extracted is equal to the number of variables being analyzed, necessitating that a decision must be made on how many components are truly meaningful and should be retained for rotation and interpretation. I use a combination approach to determine the number of meaningful components to retain (Hatcher (1994)). In particular, besides the eigenvalue criterion, I consider results of the scree test, proportion of variance accounted for and interpretability criteria. Conse-quently, I retain the 3 factors described below. The scree test indicates that Factor 1 is positively associated with the following variables: poor past operational performance, the expectation of lower future performance and declined market capitalization. Factor 2 demonstrates the highest loadings on the economy- and industry-level triggering events. Finally, Factor 3 is positively associated with competition, major customer loss and introduction of new legislation or regulation affecting the firm. Together, the three factors explain up to 95% of the data variance.
Table 4.1: Exploratory Factor Analysis
Triggering event Factor1 Factor2 Factor3
Business restructuring -17 -15 1
Recognition after denial -19 2 -8
Expectation of low performance -36 11 14
Decline in market cap -36 12 -13
Poor operational performance -45 -8 16
Industry Factors -9 48 11
Economic Factors -9 41 -3
Other 3 11 -2
New legislation or regulation -2 -3 40
Major customer loss -2 -8 31
Competition -1 5 26
Currency issues/exchange rates 4 11 16
Rising costs -4 10 14
Asset sale/expectation of sale/closure -9 5 8
Restatement to previous impairment 1 -3 -1
Eigenvalue 3.40 1.56 1.03
have relatively high factor loadings for some variables, and near-zero loadings for the remaining variables. As for the interpretability criteria, variables that load on each given factor share the same conceptual meaning. Factor 1 is associated with the firm-level operational performance, with declining market capitalization being a reflection of the poor performance. Factor 2 is strongly influenced by the economy- and industry-level circumstances, both of which are external factors affecting a firm. Finally, Factor 3 is associated with firm-level events like major customer loss,
increased competition1or regulatory developments directly affecting a firm. I conclude that even
though I retain three factors, they generally fall into two main categories: firm-specific and economy-/industry-specific factors.
4.4 Predicting Goodwill Impairments
Survival analysis is often used when researchers work with longitudinal data that contain information about the occurrence of events. One of the main tools of survival analysis is propor-tional hazard model, where event hazard (which sometimes can be interpreted as an instantaneous probability) is a product of a baseline hazard function and an exponentiated linear function of fixed covariates. The classical assumption of the proportional hazard model is that covariates do not change over time and that there is at most one event for each subject. Previous research (for example, see Hayn and Hughes (2006)) uses a Cox hazard model to identify determinants of the goodwill impairment with an underlying assumption that no firm experiences more than one goodwill impairment. However, post-142 evidence suggests that this assumption might no longer be reasonable: as demonstrated by the hand-collected sample (Table 4.2), the majority of the firms experience more than one goodwill impairment between 2003-2013.
In this paper I extend the standard assumptions of a proportional hazard model to estimate a firm’s probability of recording a goodwill impairment, conditional on the time elapsed since the firm’s previous goodwill write-down and triggering events that were disclosed by a firm at the time
1In this setting I interpret competition as a firm-specific triggering event rather than an industry-specific one. For more
Table 4.2: Distribution of Firms by Number of Goodwill Impairments, 2003-2013.
Number of Impairments Number of Firms
1 103
2 67
3 26
4 15
5 7
6 3
7 3
9 1
10 2
of the last goodwill write-down. The proportionality assumption in the Cox hazard model means that the effect of each covariate is the same at all points of time. In the case of time-varying covariates like firm size, leverage, etc. this assumption is violated because time-dependent covariates change at different rates for different companies. Hence the ratio of firm’s hazards do not remain constant and model parameters have to be estimated using the partial likelihood method.
I use the following hazard model for individual triggering events:
loghi(t) =αi(t) +
13 X
k=1
βkT rigEventki
+β14Sizei(t) +β15Leveragei(t) +β16DebtCovi(t)
+β17T enurei(t) +β18Bonusi(t) +β19M ngmtChangei(t)
+β20ImpP revQi(t) +β21GDP ChU S(t)
+β22GDP ChEU(t) +β23W ill5000Ch(t) +β24V IXCh(t)
(4.6)
and triggering events factors:
loghi(t) = αi(t) +β1F actor1i+β2F actor2i+β3F actor3i
+β4Sizei(t) +β5Leveragei(t) +β6DebtCovi(t)
+β7T enurei(t) +β8Bonusi(t) +β9M ngmtChangei(t)
+β10ImpP revQi(t) +β11GDP ChU S(t)
+β12GDP ChEU(t) +β13W ill5000Ch(t) +β14V IXCh(t).
(4.7)
In specifications (4.6) and (4.7) the functionhi(t)defines a hazard of subsequent impairment
for companyi,tis time since previous impairment,αi(t)is a baseline hazard, which captures each
CHAPTER 5 RESULTS
5.1 Descriptive Statistics
Descriptive statistics for data used in this study are presented in Tables 1-8. Table 1.1 provides a list of and disclosure examples and counts for all triggering events hand-collected from EDGAR’s annual/quarterly reports. I identify 16 distinct triggering event categories. Industry-specific fac-tors, as well as poor past operational performance and expectation of lower future performance represent the most frequently disclosed impairment indicators with 114, 126 and 144 observations,
respectively. TheN ot disclosedcategory represents 36 reports that did not provide any information
related to the goodwill impairment decision. Additionally, this table provides examples of disclosure
related to observations classified asCompustat errorandRecognition af ter denialto provide
readers with a better understanding of the sample classification process.
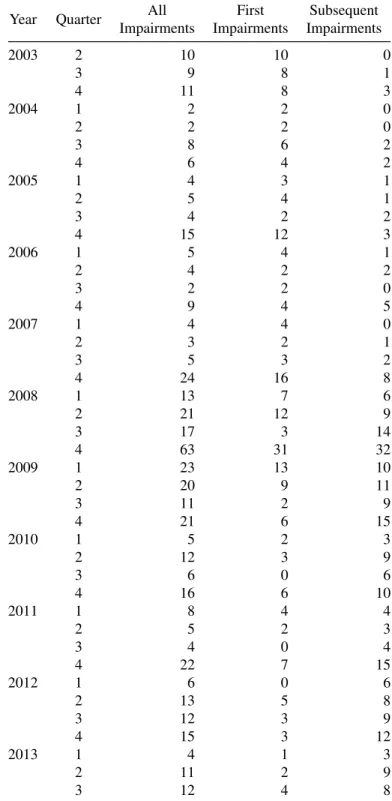
Table 4.2 shows that the number of firms with multiple goodwill impairments (124) exceeds that of firms with just one goodwill write-down (103). Additionally, Table 5.1 classifies multiple
goodwill impairment observations into two categories:F irst impairment, representing the first
impairment recorded by a firm since the beginning of the sample; andSubsequent impairment,
representing all subsequent goodwill write-downs that followed after the F irst impairment
recognition.
Table 5.1: Distribution of Goodwill Impairments by Year/Quarter and Impairment Sequence Number.
Year Quarter All
Impairments
First Impairments
Subsequent Impairments
2003 2 10 10 0
3 9 8 1
4 11 8 3
2004 1 2 2 0
2 2 2 0
3 8 6 2
4 6 4 2
2005 1 4 3 1
2 5 4 1
3 4 2 2
4 15 12 3
2006 1 5 4 1
2 4 2 2
3 2 2 0
4 9 4 5
2007 1 4 4 0
2 3 2 1
3 5 3 2
4 24 16 8
2008 1 13 7 6
2 21 12 9
3 17 3 14
4 63 31 32
2009 1 23 13 10
2 20 9 11
3 11 2 9
4 21 6 15
2010 1 5 2 3
2 12 3 9
3 6 0 6
4 16 6 10
2011 1 8 4 4
2 5 2 3
3 4 0 4
4 22 7 15
2012 1 6 0 6
2 13 5 8
3 12 3 9
4 15 3 12
2013 1 4 1 3
2 11 2 9
population of goodwill impairments available in Compustat, reflecting the influence of the global financial crisis.
Descriptive statistics for goodwill impairing, positive goodwill and zero goodwill samples are reported in Tables 3.3 and 3.4. As expected, all three samples are close in terms of mean and median firm size. Goodwill-impairing firms carry a slightly larger goodwill balance than do positive goodwill firms. On average, firms across all samples are followed by 9 analysts and have a reporting lag of 32 to 36 days. Zero goodwill firms have almost twice as much leverage as do goodwill-impairing and positive goodwill firms. Mean reported loss (negative earnings per share) magnitudes are almost identical for goodwill-impairing and zero goodwill firms (23 and 26 cents per share, respectively). In contrast, positive goodwill firms without goodwill write-downs report an average loss of 8 cents per share.
5.2 The Information Content of Goodwill Impairment Disclosures
Figure 5.1 presents a plot of daily abnormal return volatility (abnormal trading volume) for three sample categories - goodwill impairing, positive goodwill and zero goodwill firms – in event time surrounding goodwill announcements. In particular, following (Landsman et al., 2012), I calculate
dailyARV OL(AT V OL) and regress it on event day fixed effects. The figure plots the coefficient
estimates from this regression, which represent the conditional meanARV OL(AT V OL) on each
day. Consistent with previous research findings ((Beaver, 1968), (Landsman and Maydew, 2002)) I
document an increase in dailyARV OL(AT V OL) in the days surrounding the news announcement
date. Figure 5.1 demonstrates that firms with positive goodwill balances, both goodwill-impairing and non-impairing, experience a higher market reaction to earnings announcement news than do
firms with zero goodwill balances1that represent a benchmark for earnings announcement reactions
with no goodwill implications. This result suggests non-impairment by positive goodwill firms is
informative as reflected by theARV OLandAT V OLmeasures. For example, if the market expects
Figure 5.1: Market reaction to earnings announcements by goodwill-impairing, positive goodwill and zero goodwill firms in 2003-2013, i.e. after SFAS 142 introduction. Left panel presents results for abnormal trading volume, right panel - for abnormal return volatility.
Figure 5.2: Market reaction to earnings announcements by positive goodwill and zero goodwill firms in 1991-2001, i.e. before SFAS 142 introduction. Left panel presents results for abnormal trading volume, right panel - for abnormal return volatility.
a goodwill impairment but a firm does not record it, the market prior expectations’ adjustments manifest themselves through abnormal return volatility and/or abnormal trading volume.
As for goodwill-impairing firms, the magnitude of theARV OLandAT V OLincreases exceed
I repeat the same analysis based on subsamples representing firms with particular triggering events disclosed in financial statements at the time of goodwill impairment news release. For parsimony, I report 3 representative figures for the following categories of triggering events - com-petition, declined market capitalization and economic factors (see Figure 5.3). When competition is disclosed as a triggering event for a goodwill impairment, it induces a significant spike in both abnormal return volatility and abnormal trading volume measures, consistent with a revision of expectations by both the overall market and individual investors. Disclosure of a decline in market capitalization as a reason for the goodwill impairment, on the other hand, does not seem to be associated with the significant market reaction. This is consistent with this information being already priced by the market since the decline in stock market price is easily observable before the impairment announcement. Finally, economic factors seem to be reflected by abnormal return volatility, but not abnormal trading. These initial observations lend support to hypothesis 1 in that they demonstrate a differential market reaction to goodwill announcement news depending on the particular triggering event disclosed by a firm.
Table 5.2 presents results of paired t-tests assessing whether changes in mean abnormal return
volatility (ARV OL) and abnormal trading volume (AT V OL) of goodwill-impairing firms relative
to those of positive-goodwill and zero-goodwill matched firms are statistically significant. For parsimony, triggering events with insignificant results for both information content measures were dropped from the table.
On the day of a goodwill impairment announcement, almost every triggering event results
in a positive and statistically significant change inARV OLif compared to changes in abnormal
return volatility of zero-goodwill firms. M ajor customer loss and Rising costs are the only
exceptions demonstrating a statistically significant positive difference on the next day (day 1) after the goodwill impairment announcement (day 0). As for changes in abnormal trading volume
Next, I compare differences in disclosure’s information content between goodwill-impairing firms and non-impairing positive-goodwill firms since these two company categories closely
re-semble each other based on industry and size. On day 0,Industry−specif ic f actors, increased
Competition, poor operational past and future performance andBusiness restructuringresult
in positive and statistically significant changes inARV OL, indicating changes in expectations
of the market as a whole. As already mentioned above, the market reaction toM ajor customer
lossandRising costs, while initially insignificant, becomes significantly positive on day 1. The
AT V OLmeasure reveals significantly positive coefficients onAsset sale/expectation of sale
and Strategic change, suggesting that these triggering events are associated with revisions of idiosyncratic expectations. Positive coefficients on these impairment indicators reveal an increase
in the information content of the disclosure. Consistent with Figure 5.3 analyzed above,Decline
in market capitalizationdoes not generate a significant market response. Firms that announce
goodwill impairment but provide no further details (N ot disclosed) experience significantly positive
change in abnormal return volatility on day 0. However, this result reverses on day 1 withARV OL
becoming significantly negative.
Taken together, these results strongly support Hypothesis 1. The market reaction to goodwill impairments depends on the nature of the underlying event that resulted in impairment recognition. Positive coefficients for triggering events indicate an increase in information content of goodwill impairment-related disclosure under the SFAS-142 regime. Additionally, this evidence provides a possible explanation to previous research findings that documented non-existent or weak market reaction to goodwill write-downs. First, an insignificant market reaction to some triggering events might obscure the significance of other impairment indicators if an average effect is measured across all impairment observations during a particular period of time. Second, use of two- or three-day moving averages during the market reaction measurement period might also result in insignificant
findings as demonstrated above by theN ot disclosedcategory of events.
triggering event variables into 3 factors. Factors 1 and 3 are positively correlated with firm-level disclosures, while Factor 2 is strongly influenced by the economy- and industry-related disclosure. Table 5.3 reveals that Factor 3 is significantly positive on day 0, while Factor 1 becomes positive and significant on day 1. Factor 2, which is positively correlated with economic- and industry-level factors, is insignificant during both days. This result strongly supports Hypothesis 1a. Positive and significant coefficients on firm-level disclosure factors indicate increased information content of
firm-specific disclosures relative to the economy- and industry-level ones. Results for theAT V OL
measure imply the same inferences, lending support to Hypothesis 1b. Factor 3 is the only factor in this specification with statistically significant positive coefficient. Taken together, the evidence from factor-specific tests suggests that firm-level triggering event disclosure is associated with an increase in the information content of goodwill impairment announcements as measured by abnormal return volatility and abnormal trading volume.
5.3 Market Microstructure Effects of Goodwill Impairment Disclosure
To test my hypotheses related to market asymmetry, I first compare bid-ask spread and liquidity behavior around goodwill impairment announcement dates for goodwill-impairing, positive goodwill and zero goodwill firms. Results are depicted in Figure 5.5. I do not find significant evidence of changes in bid-ask spreads during the extended time before the disclosure, rejecting hypotheses 2 and 3. This result is consistent with the idea that trading before the disclosure date is not based on the private information about an impairment leaked to the market before the earnings announcement. However, consistent with the theoretical predictions of (Kim and Verrecchia, 1994), I find that bid-ask spreads increase at the time of joint goodwill impairment/earnings announcements and
return to previous levels several days after impairment disclosure.2 Differences in bid-ask spread
2Some triggering events (Expectation of lower f uture perf ormance,N ew legislation/regulationand others
related to firm-specific disclosures) demonstrate increases in bid-ask spreads in days leading up to the announcement.
For example,Rising costs(see Figure 5.6c) shows initial increase in bid-ask spreads between the days -2 and -1. This
increases are significant across all three groups of firms. Among the triggering event subgroups (see
Figure 5.6), firms that disclose impairment indicators such asM ajor Customer Loss,Rising
Costs and Strategic Change experience the largest increase in bid-ask spreads. Impairment
recognition without further disclosure (N ot Disclosed) also results in a significant bid-ask spread
increase (see Table 5.4).
Overall, the evidence suggests that goodwill impairment disclosure does not reduce information asymmetry, but rather temporarily increases it around announcement dates. This finding strongly supports Hypothesis 4 and is consistent with (Kim and Verrecchia, 1994)’s idea that certain dis-closures provide information that allows sophisticated traders to make judgments about a firm’s performance that are superior to the judgments of other traders. In particular, the disclosure of firm-specific private information or the decision not to disclose any details about an impairment seem to constitute the main incentives for expert traders to acquire/produce new private information about a goodwill-impairing firm.
As for liquidity, different triggering events are associated with different changes in liquidity
around goodwill impairment announcements. Disclosure of M ajor Customer Loss, Rising
CostsandCompetitionis related to a post-announcement decrease in liquidity. Firms that choose not to disclose details about their goodwill impairment decision experience decrease in liquidity as well. Disclosure of economy- and industry-related triggering events have no effect on liquidity levels. Combined with evidence on changes in bid-ask spreads, presented results strongly support Hypothesis 5, suggesting that firm-specific goodwill impairment disclosure is associated with post-announcement information asymmetry changes, while disclosure related to information that might be publicly available elsewhere is not.
5.4 Tests of the Predictive Power of Goodwill Impairment Disclosure
Table 5.5 presents results of the proportional hazard model estimation to assess whether
goodwill impairment-related disclosures at time t have significant effects on a probability of
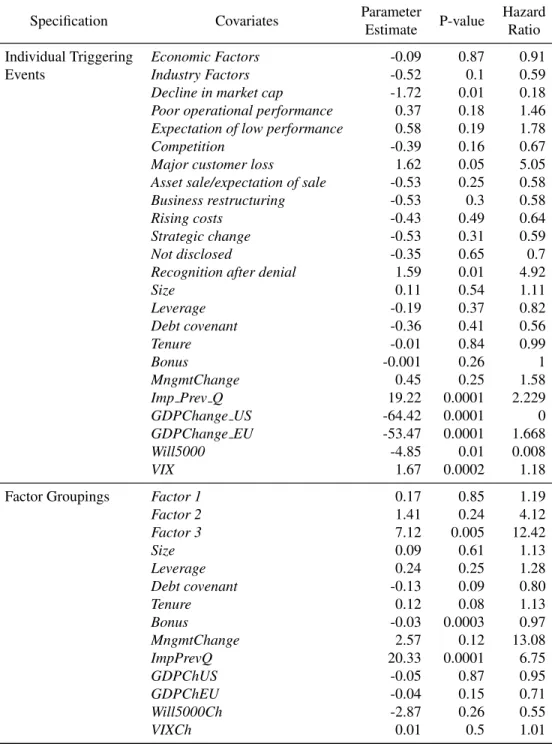
Hazard ratios can be interpreted almost exactly like odds ratios in logistic regression (Allison (2010)). For indicator variables with values of 1 and 0, as is the case with triggering events in this study, the hazard ratio is interpreted as a ratio of the estimated hazard for those with a value of 1 to the estimated hazard for those with a value of 0 (controlling for the other covariates). For example, the estimated hazard ratio for Factor 3, which is highly positively correlated with firm-level disclosures, is 12.42. This means that the hazard of a subsequent goodwill impairment recognition for firms that disclosed triggering events correlated with Factor 3 is 12.42 times higher than for firms that did not make such disclosure. Factor’s 3 significantly positive coefficient also indicates a shorter time to next impairment for firms disclosing firm-specific reasons for goodwill impairment decisions. Factors 1 and 2 have insignificant coefficients indicating that disclosures related to firm-level operational performance and economy- and industry-related triggering events do not have significant effects on subsequent goodwill impairment recognition.
As for the control variables, they generally follow previous research findings. The presence of aBonusin CEO’s compensation reduces the probability of subsequent goodwill write-down
and extends the time to next impairment, as does the presence of a debt covenant. CEO tenure,
Table 5.5: Hazard Model Estimates of the Predictive Power of Individual Triggering Event Disclo-sures and Factor groupings.
Specification Covariates Parameter
Estimate P-value
Hazard Ratio
Individual Triggering Economic Factors -0.09 0.87 0.91
Events Industry Factors -0.52 0.1 0.59
Decline in market cap -1.72 0.01 0.18
Poor operational performance 0.37 0.18 1.46
Expectation of low performance 0.58 0.19 1.78
Competition -0.39 0.16 0.67
Major customer loss 1.62 0.05 5.05
Asset sale/expectation of sale -0.53 0.25 0.58
Business restructuring -0.53 0.3 0.58
Rising costs -0.43 0.49 0.64
Strategic change -0.53 0.31 0.59
Not disclosed -0.35 0.65 0.7
Recognition after denial 1.59 0.01 4.92
Size 0.11 0.54 1.11
Leverage -0.19 0.37 0.82
Debt covenant -0.36 0.41 0.56
Tenure -0.01 0.84 0.99
Bonus -0.001 0.26 1
MngmtChange 0.45 0.25 1.58
Imp Prev Q 19.22 0.0001 2.229
GDPChange US -64.42 0.0001 0
GDPChange EU -53.47 0.0001 1.668
Will5000 -4.85 0.01 0.008
VIX 1.67 0.0002 1.18
Factor Groupings Factor 1 0.17 0.85 1.19
Factor 2 1.41 0.24 4.12
Factor 3 7.12 0.005 12.42
Size 0.09 0.61 1.13
Leverage 0.24 0.25 1.28
Debt covenant -0.13 0.09 0.80
Tenure 0.12 0.08 1.13
Bonus -0.03 0.0003 0.97
MngmtChange 2.57 0.12 13.08
ImpPrevQ 20.33 0.0001 6.75
GDPChUS -0.05 0.87 0.95
GDPChEU -0.04 0.15 0.71
Will5000Ch -2.87 0.26 0.55
VIXCh 0.01 0.5 1.01
This table presents the results of estimating equations (4.6) and (4.7) on a subsample of firms with multiple impairments.
The dependent variable is a functionhi(t)which defines a hazard of subsequent impairment for companyi. Control
Figure 5.3: Market reaction to goodwill impairment disclosure that names economy-wide devel-opments, competition or decline in market capitalization as a triggering event. Positive and zero goodwill firms represent companies matched to impairing firms by size and industry. Left panels present results for abnormal trading volume, right panels – for abnormal return volatility.
(a) ATVOL: economy-wide developments (b) ARVOL: economy-wide developments
(c) ATVOL: competition (d) ARVOL: competition
Figure 5.4: Bid-ask spreads and market liquidity around earnings announcement days of positive goodwill and zero goodwill firms in 1991-2001, i.e. before SFAS 142 introduction. Market liquidity is measured by the Amihud measure. Left panel demonstrates bid-ask spreads, right panel shows Amihud measure.
Figure 5.6: Bid-ask spreads and market liquidity around goodwill impairment/earnings announce-ment days of goodwill-impairing, positive goodwill and zero goodwill firms in 2003-2013. Goodwill-impairing group of firms consists only of those that disclosed major customer loss, rising costs as a triggering event or did not disclose any details about a goodwill write-down. Market liquidity is measured by the Amihud measure. Left panel demonstrates bid-ask spreads, right panel shows Amihud measure.
(a) BAS: major customer loss (b) Amihud: major customer loss
(c) BAS: rising costs (d) Amihud: rising costs
CHAPTER 6 CONCLUSIONS
BIBLIOGRAPHY
Allison, P. (2010). Survival Analysis Using SAS: A Practical Guide, volume 64. SAS Institute.
Atiase, R. K. and Bamber, L. S. (1994). Trading volume reactions to annual accounting earnings
announcements. The incremental role of predisclosure information asymmetry. Journal of
Accounting and Economics, 17(3):309–329.
Ball, R. and Brown, P. (1968). An Empirical Evaluation of Accounting Income Numbers. Journal
of Accounting Research, 6(2):159–178.
Beatty, A. and Weber, J. (2006). Accounting discretion in fair value estimates: An examination of
SFAS 142 goodwill impairments. Journal of Accounting Research, 44(2):257–288.
Beaver, W. H. (1968). The Information Content of Annual Earnings Announcements. Journal of
Accounting Research, 6(1-2):67.
Bens, D. a., Heltzer, W., and Segal, B. (2011). The Information Content of Goodwill Impairments
and SFAS 142. Journal of Accounting, Auditing & Finance, 26(3):527–555.
Blankespoor, E., Miller, B. P., and White, H. D. (2014). Initial evidence on the market impact of the
xbrl mandate. Review of Accounting Studies, 19(4):1468–1503.
Bushman, R. M., Hendricks, B. E., and Williams, C. D. (2016). Bank competition: Measurement,
decision-making, and risk-taking. Journal of Accounting Research, 54(3):777–826.
Chen, C., Kohlbeck, M., and Warfield, T. (2008). Timeliness of impairment recognition: Evidence
from the initial adoption of SFAS 142. Advances in Accounting, 24(1):72–81.
DeFond, M., Hung, M., and Trezevant, R. (2007). Investor protection and the information content of
annual earnings announcements: International evidence.Journal of Accounting and Economics,
43(1):37–67.
Demerjian, P. R. and Owens, E. L. (2016). Measuring the probability of financial covenant violation
in private debt contracts. Journal of Accounting and Economics, 61(2-3):433–447.
EY (2016). Goodwill and Other Intangibles. Technical Report July, Ernst&Young LLP, New-York. FASB (2001). Goodwill and Other Intangible Assets. Statement of Financial Accounting Standards
142. Norwalk(CT):FASB.
Francis, J., Hanna, J. D., and Vincent, L. (1996). Causes and Effects of Discretionary Asset
Write-Offs. Journal of Accounting Research, 34(3):117–134.
Gu, F. and Lev, B. (2011). Overpriced shares, Ill-advised acquisitions, and goodwill impairment. Accounting Review, 86(6):1995–2022.
Hatcher, L. (1994). A Step-by-Step Approach to Using the SAS System for Factor Analysis and
Hayn, C. and Hughes, P. J. (2006). Leading indicators of goodwill impairment. Journal of Accounting, Auditing and Finance, 21(3):223–265.
Hirschey, M. and Richardson, V. J. (2002). Information content of accounting goodwill numbers. Journal of Accounting and Public Policy, 21(3):173–191.
Hodder, L., Hopkins, P., and Schipper, K. (2013). Chapter 4: Verifiability of Fair Value
Mea-surements: 4.1: Verifiability in the FASB’s conceptual framework. Foundations & Trends in
Accounting, 8(3/4):223–227.
Kim, O. and Verrecchia, R. E. (1991). Trading Volume and Price Reactions to Public Announcements University of Chicago Stable URL : http://www.jstor.org/stable/2491051 Trading Volume and
Price Reactions to Public Announcements. Journal of Accounting Research, 29(2):302–321.
Kim, O. and Verrecchia, R. E. (1994). Market liquidity and volume around earnings announcements. Journal of Accounting and Economics, 17(1-2):41–67.
Knauer, T. and Wohrmann, A. (2016). Market reaction to goodwill impairments. European
Accounting Review, 25(3):421–449.
Kothari, S. P. (2001). Capital Markets Research in Accounting. Jounral of Accounting and
Economics, 31:105–231.
Landsman, W. R. and Maydew, E. L. (2002). Has the Information Content of Quarterly Earnings
Announcements Declined in the Past Three Decades? Journal of Accounting Research,
40(3):797–808.
Landsman, W. R., Maydew, E. L., and Thornock, J. R. (2012). The information content of
annual earnings announcements and mandatory adoption of IFRS. Journal of Accounting and
Economics, 53(1-2):34–54.
Li, K. K. and Sloan, R. G. (2015). Has Goodwill Accounting Gone Bad? (Available on SSR). CAAA Annual Conference 2011, (December):1–52.
Li, Z., Shroff, P. K., Venkataraman, R., and Zhang, I. X. (2011). Causes and consequences of
goodwill impairment losses. Review of Accounting Studies, 16(4):745–778.
Ramanna, K. and Watts, R. L. (2012). Evidence on the use of unverifiable estimates in required
goodwill impairment. Review of Accounting Studies, 17(4):749–780.
Rees, L., Gill, S., and Gore, R. (1996). An Investigation of Asset Write-Downs and Concurrent
Abnormal Accruals. Journal of Accounting Research, 34(3):157–169.
Riedl, E. J. (2004). An Examination of Long-Lived Asset Impairments. The Accounting Review,
79(3):823–852.
Strong, J. S. and Meyer, J. R. (1987). Asset Writedowns: Managerial Incentives and Security
Therneau, T. M. and Grambsch, P. M. (2000). Modeling survival data: extending the Cox model. Springer Science & Business Media.
Wei, L. J., Lin, D. Y., and Weissfeld, L. (1989). Regression Analysis of Multivariate Incomplete Failure Time Data by Modeling Marginal Distributions.
Zucca, L. J. and Campbell, D. R. (1992). A Closer Look at Discretionary Writedowns of Impaired