STI 2018 Conference Proceedings
Proceedings of the 23rd International Conference on Science and Technology Indicators
All papers published in this conference proceedings have been peer reviewed through a peer review process administered by the proceedings Editors. Reviews were conducted by expert referees to the professional and scientific standards expected of a conference proceedings.
Chair of the Conference
Paul Wouters
Scientific Editors
Rodrigo Costas Thomas Franssen Alfredo Yegros-Yegros
Layout
Andrea Reyes Elizondo Suze van der Luijt-Jansen
The articles of this collection can be accessed at https://hdl.handle.net/1887/64521
ISBN: 978-90-9031204-0
© of the text: the authors
© 2018 Centre for Science and Technology Studies (CWTS), Leiden University, The Netherlands
Indicators
Bitnari Yun*, June Young Lee*, Jinhyuk Yun* and Sejung Ahn*†
*[email protected]; [email protected]; [email protected]; [email protected];
Future Technology Analysis Center, Korea Institute of Science and Technology Information, 66 Hoegiro, Dongdaemun-gu, Seoul, 02456 (Korea)
Introduction
The application of scientometric indicators is crucial to both research evaluation and the advance of science itself also (Chen & Song, 2017). Since indicators provide objective and comparable figures for research publications, individual researchers, and specific research units, they are considered as key elements that are used not only in research assessment but also in the decision making process regarding promotions or funding (Durieux & Gavenois, 2010). Indeed, the development and application of scientometric indicators have been performed by various institutes, universities and relevant companies (Leydesdorff & Milojevič, 2015).
In keeping with these trends, Korea Institute of Science and Technology Information(KISTI) developed the ‘Insightful Integrated Indicators-Metrics(i*Metrics)’ to calculate scientometric indicators for journal papers analysis. It is distinguished from other systems in that it aims at large-scale data processing with comprehensive data coverage and various normalized indicators. We can create profiles by country or discipline by using i*Metrics. In this study, we investigate the research trend and characteristics by country in the field of gender studies using journal papers published from 1999 to 2016 by KISTI i*Metrics system with selected indicators.
Data and methods
In this study, we used the SCOPUS Database developed at KISTI from the SCOPUS XML Custom Data provided by Elsevier. For investigating the characteristics of gender studies, we created the dataset using ASJC codes classification system of SCOPUS for the ‘gender studies’. The top 10 countries were selected based on the number of publications, and South Korea was added for comparison. Thus, we analyzed 29,219 research publications with document type of article, conference page, and review, which were published from 1999 to 2016 for 11 countries.
STI Conference 2018 · Leiden
Attractivity Index(AAI), Mean Normalized Citation Score(MNCS), and Excellent Journal Rate(EJR) were chosen to measure influence and excellence. Third, Paper Collaboration Size(PCS) was selected to present collaboration. Lastly, Diffusion Rate to Others(DRO), and Absorption Rate from Others(ARO) were picked to show technological progress and diffusion.
Results & Discussion
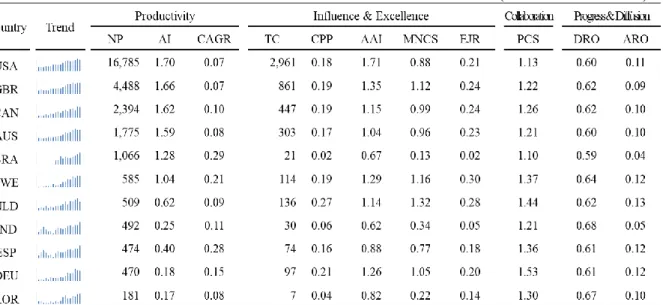
Table 1 shows the scientometric indicators of gender studies for 11 countries. All figures for each indicator excluding NP and TC are averaged for the yearly calculated values. The United states has the highest NP and AI, and European countries have relatively high values in many indicators. Meanwhile, Asian countries such as India and South Korea presented relatively low values in productivity and influence & excellence categories, but showed similar values to other countries in the other two categories.
Table 1. Scientometric indicators for ‘Gender Studies’ of 11 countries (From 1999 to 2016).
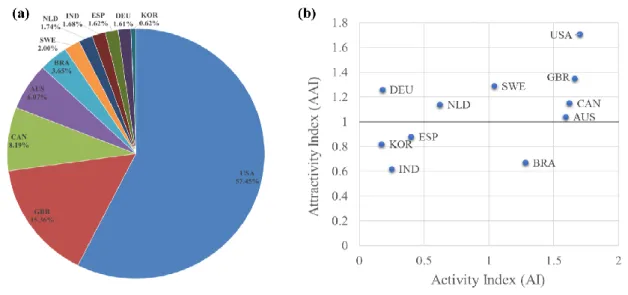
Figure 1. Research activities of 11 countries in the field of gender studies through (a) the distribution of the number of publications by country, (b) AI and AAI indicators by country.
We carried out the indicator combination analysis for more specific comparative analysis. Figure 2(a) presents the combination of MNCS, EJR, and NP which is represented by node size. The upper-right side is the area where having higher MNCS and EJR than the world average. The countries such as Sweden, the Netherlands, the United Kingdom, Canada, Australia, the United States, and Germany are located on the area. In contrast, the bottom-left side area including South Korea, India, and Brazil is an area having low MNCS and EJR, and the countries in this area had the less number of publications also.
Figure 2(b) show the level of technological absorption and diffusion between gender studies and other research fields and international collaboration size of each countries. The result shows that gender studies of many countries has interdisciplinary characteristics strongly in term of citing references from other fields rather than being cited by other fields. Many countries such as the Netherlands, Spain, Germany, Sweden, the United States, and Canada are located on the upper side of quadrant where having high ARO value. However, since Brazil shows the lowest ARO, DRO and PCS among 11 countries, there was little cooperation with other fields and countries. Generally, gender studies is referred as interdisciplinary field (Tsay & Li, 2017). The results partially support this opinion for gender studies.
STI Conference 2018 · Leiden
Conclusion
In this study, we investigate the research trend and characteristics of gender studies by country using scientometric indicators. As a result of analysis, research achievements of the United States and some European countries were noticeable in the field of global women’s studies. The United States has played a leading role in terms of productivity, and the achievements of Sweden and the Netherlands, and Germany are remarkable when it comes to collaboration among countries and other disciplines. In particular, the influence and excellence of research publications in Sweden and the Netherlands were also identified by indicators such as EJR and MNCS.
References
Chen, C., & Song, M. (2017). Measuring Scholarly Impact. In Representing Scientific Knowledge: The Role of Uncertainty (pp.139-204). Springer.
Durieux, V., & Gevenois P.A. (2010). Bibliometric indicators: quality measurements of scientific publication. Radiology, 255(2), 342-351.
Leydesdorff, L., & Milojevič, S. (2015). Science and Technology Studies. In Michael Lynch (Ed.), International Encyclopedia of Social and Behavioral Sciences (2nd ed., pp.322-327). Oxford: Elsevier.