ORIGINS OF RELIGIOUS LANGUAGE IN GUBERNATORIAL SPEECHES
Monica L. Moore
A thesis submitted to the faculty of the University of North Carolina at Chapel Hill in partial fulfillment of the requirements for the degree of Master of Arts in the Department of Political Science.
Chapel Hill 2012
ABSTRACT
MONICA L. MOORE: Origins of Religious Language in Gubernatorial Speeches (Under the direction of Thomas M. Carsey.)
ACKNOWLEDGMENTS
TABLE OF CONTENTS
LIST OF TABLES . . . v
LIST OF FIGURES . . . vi
Introduction . . . 1
Religious Rhetoric . . . 5
Hypotheses . . . 7
Data and Methods . . . 8
Content Analysis . . . 10
Main Independent Variables . . . 11
Control Variables . . . 12
Analysis . . . 14
Descriptive Results . . . 14
Results . . . 15
Conclusions and Implications . . . 17
Figures and Tables . . . 19
Appendix . . . 25
LIST OF TABLES
Table
1 Governors’ Religious Speech: Negative Binomial Regression Results* . 23
2 Religious Language Dictionary . . . 25
3 Pew Religious Landscapes Question Wording . . . 26
4 Model Exploration of Gubernatorial Religious Speech . . . 27
LIST OF FIGURES
Figure
1 Distribution of the Dependent Variable: Frequencies of Religious Lan-guage Use . . . 19 2 Distribution of IV: Population with High Religious Importance . . . 20 3 Distribution of IV: Population with High Religious Traditionalism . . . 21 4 Distribution of IV: Index of Religiosity (Importance + Traditionalism) . 22 5 Effect of State Religiosity on Religious Language Use (with all other
Introduction
How do elected officials decide how to communicate with their constituents? These officials have many different appearances and publicized statements throughout their tenure in office, and the ways in which they choose to communicate with the voters could reflect their underlying electoral strategies. Assuming that public officials’ pri-mary goal is reelection (Mayhew, 1974), their public communication can be viewed as a prime outlet to maintain and grow approval ratings among the population of their possible and likely supporters. Building a relationship of trust with constituents is one way in which an elected official can sway voters into his or her camp. A notion of trust can be forged between official and voter in a few ways, the most prominent of which is for an official to be able to appear to relate to their citizens on a personal level (Fenno, 1978). In this paper, I argue that one of the ways in which public officials seek to appear relatable to their citizens is on the level of personal religious beliefs. Under these assumptions, an elected official should respond to a religious constituency with reinforcing themes of religion appearing in their public communication.
Public officials have many ways of expressing their viewpoints, but one of the most direct and explicit ways is through their public speech. These officials speak to their citizens in many different forums on any number of occasions throughout the year. Each of these speeches is meant to communicate specific ideas to the audience. It follows that the language officials chose to be include in speeches is not random; they use their speeches to convey a message to their specific audience at the time of the speech as well as the broader constituency.
If the language in public speeches is intentionally chosen to convey a certain mes-sage to an audience, it follows that the speaker is seeking to appeal to her audience in a way that would induce support. To whom would an elected official want to appeal or reach out to for support using these speeches? Elected officials in general must ap-peal broadly to different interest coalitions to be elected and remain in office (Axelrod, 1972, 1986). Unlike political systems with multiple viable parties who pander to the interests of a narrow set of interests, candidates of the two major political parties in the United States must create broad coalitions of various interests in order to gain power and elected offices. Assuming that one of an elected official’s most important goals is to gain re-election, being able to appeal to a large enough set of interest coalitions–specifically enough to gain a majority of votes–is essential.
partisanship in the candidate evaluations of some voters, and therefore politicians who can identify with voters who are outside the boundaries of their traditional party base would not be targeting based on their party’s own likely voters, but based on voters of any political leaning that may relate to and appreciate a leader with a given personal characteristic.
The inclusion of politicians’ personal characteristics does seem to exist in speeches across the universe of public communication. A more specific example of this can be seen on the state level, as many different gubernatorial attributes have been observed as appearing in State of the State addresses of governors in the United States. These characteristics have included their own personality characteristics (Barth and Ferguson, 2002) as well as an expression of political ideology that is more likely to be consis-tent with the voters’ideology than the governor’s (Coffey, 2005; Weinberg, 2010) All of these measurable concepts and personal characteristics–along with many more that have not been measured yet or cannot likely be measured–weave together to form the language of a speech that is generally meant to communicate a specific stance or plan on an issue while strategically attempting to lift spirits (and approval numbers) among the citizenry and the legislature (Van Assendelft, 1997; Rosenthal, 1990).
If we assume that public officials includes linguistic manifestations of certain latent concepts or appeals such as personal characteristics and ideological leanings in their speeches to convey a certain worldview to the political audience, it seems likely that other latent concepts can be woven into the language to tailor this worldview to the receptive citizens of any given state. One of these concepts that has continually and increasingly shown up in the arena of political rhetoric is religion. If in fact politicians are deliberately reaching out to their audience in ways that help them to identify with citizens, one way in which they could achieve this goal would be mentioning religious themes or phrases in front of a receptive audience of interest coalitions.
com-munications data. One specific speech common to all U.S. state governors is the “State of the State” speech. Modeled after the State of the Union address, these speeches are presented by governors in front of state legislators and publicized state-wide. The vast majority of states require a State of the State address every year (usually in late January), though a few states only require such an address every two years (usually in odd-numbered years.) This consistency in occurrence and timing makes State of the State addresses an important unit of analysis for the study of state politics; they offer a comparable unit of analysis across states in any given year and also across time. Another consistent feature of these addresses across states is that they are all policy-oriented in nature (DiLeo, 1997; Herzik, 1991). Governors use these speeches as a direct statement of their most valued legislative goals, and they also use them as a way to shift salience to new issues and garner support for future legislative goals (Jackson and Kingdon, 1992; Van Assendelft, 1997).
Another characteristic of all State of the State addresses is the general consensus that they are intentional in nature. In other words, governors have particular goals in mind while they are formulating these speeches, and those goals shape the content and style of the language they choose to include. Past research has provided evidence to support the claim that the main goal of these speeches is to exert influence on both the state’s public opinion and the state legislative processes (Van Assendelft, 1997; Rosenthal, 1990). Being intentional in nature, we are–as mentioned previously–able to gather that these speeches can allow us to gauge what type of appeals are being communicated to the audience, and to what extent these appeals are employed. Specifically for this study, the speeches’ intentional nature allow us to gauge the amount of religious appeals used when communicating to constituents.
a large segment of the electorate in the United States. According to the Pew Forum on Religion in Public Life, seventy nine percent of Americans on average identify reli-giously with some form of the Christian religious tradition, while sixteen percent do not identify with any religious tradition1 . This leaves only five percent of the population on average to split between U.S. adherents to any other world faith tradition. While I do not mean to imply that this five percent does not exist or is not important, it seems reasonable to assume that the much larger–and consequentially much more politically valuable–sector of the population identifying with the Christian tradition would be of much more interest to elected officials on average2.
Religious Rhetoric
Civic culture in the U.S. rests on many ideals, one of which is that church and state should be kept separate to the degree that is possible; however, it is obvious that a certain pervasive notion of religious thought permeates American politics to varying degrees over time and space. Kenneth Wald defines civil religion as “the idea that a nation tries to understand its historical experience and national purpose in religious terms... Civil religion reflects an attempt by citizens to imbue their nation with a transcendent value. The nation is recognized as a secular institution, yet one that is somehow touched by the hand of God.” (Wald, 2003, 55)
Civil religion and its themes can be seen most prominently through its appearance in political rhetoric. The conjecture has been made that the American people have come to expect the leader of the executive branch to publicly profess a religious identity (Black, 2004), and–more concretely–U.S. presidents have been shown to routinely make ref-erences to divine power, religious texts, and general religious themes in their public
1This information and other data from the survey can be found at http://religions.pewforum.org/
affiliations
2Of course, some local areas include substantially larger concentrations of people from different
speeches. In her content analysis of presidential inaugural addresses, Toolin (1983) finds evidence of a civil religious dimension embedded within presidents’ publicized speech. She concludes that the inclusion of religious language and themes in an exec-utive’s public speeches are employed to perform strategic functions, two of which are to affirm culture and to help the speaker appear as a legitimate leader. For example, a religious statement “may legitimize behavior, such as involvement in a war,” or it can affirm culture by “pointing out how self-less the United States is to help others, as she always has” (Toolin, 1983, 46-47). These two strategic uses of religious language in presidential speech harken back to Fenno’s trust-building objective of being able to em-pathize and identify with one’s constituents. By using religious references to legitimize herself as a leader and to affirm the cultural norms of society, the speaker is demonstrat-ing that what is important to her constituents is also important to her, and therefore is intentionally using their language to build trust with the audience.
environment with the voters.
Hypotheses
The inclusion of religious language in gubernatorial rhetoric–to the extent that it exists in State of the State addresses, specifically–could be a function a governor’s desire to identify and empathize with the religious citizens in the state. The governor could be accommodating the religious interest of the public in a way that is directly related to the strength and size of the broadly defined religious coalition in a given state. This would suggest that the size of the group of citizens in a state that would be receptive to a religious appeal would be an important factor for a governor to consider in her speech delivery. Within this broadly defined religious coalition of interest, there are two possible characteristics of the coalition members to which governors may be receptive and responsive.
The first possibility is that governors are responding the proportion of their state’s population to whom religion is held as animportantpart of daily life. This expectation requires a governor to respond only to an overall sense of the prominence of religion in the lives of her state’s citizens. It does not require her to identify and distinguish between particular beliefs held by the public; she must only be able to respond to the intensity of religiosity in her state, regardless of subsets of beliefs or denominations within that overarching religiosity.
religious traditionalists because they are more expressedly politicized in the U.S. than their modernist counterparts. This expectation rests on the idea that a governor is re-sponding to a specific subset of the population that is defined based on the substance of their religious beliefs and not on the intensity of their religious beliefs.
This leads to the following hypotheses:
H1: The proportion of citizens in a state who hold religion to be very
im-portant has a positive impact on the prevalence of religious language in a
governor’s State of the State address.
H2: The proportion of traditionalistic religious citizens in a state has a
positive impact on the prevalence of religious language in a governor’s
State of the State address.
Data and Methods
The source for the data on religious language for this project will be the text of the annual “State of the State” (SotS) speeches presented by state governors in front of state legislators and publicized state-wide. The State of the State speeches are the only public gubernatorial speeches that are consistent in format, timing, and subject matter across all fifty states. Choosing random gubernatorial speeches across time and across the fifty states for the source of data for this project would likely bring together speeches that may not be appropriate for direct comparison (example: a commencement address and a speech to fundraisers would not be comparable).
gubernatorial speeches that are (generally) available publicly and consistently for any year in the recent past, or since about 2004. The text of these speeches is available freely online: most are on stateline.org. Others can be found on governors’ websites, C-SPAN video archives, or other similar governmental sources.
One argument against comparing these speeches to one another might be the po-tential influence of election effects. If a governor’s election is approaching within the coming year, her speech may look much different than a similar speech given in a year without an election. In addition, not all governors are up for election at the same time. They all share the commonality of four-year terms, but the ends of their terms are stag-gered: some are elected in presidential election years, some are elected in midterm election years, and a few are even elected in odd-numbered years. To anticipate this issue, I have chosen to collect the state of the state speeches from 2004, 2006, 2006, and 2010. This corrects two problems: first, it covers a wide enough swath of time to be able to control for impending election effects evenly across states; second, it controls for the fact that a few states only require a State of the State address every two years.
The period of analysis for this study will be 2004-2011. As mentioned above, four state-wide gubernatorial speeches will be collected for each state during this period, totalling 200 speeches. For those states whose governors only deliver addresses in odd numbered years, their 2005, 2007, 2009, and 2011 speeches will be used alongside the 2004, 2006, 2008, and 2010 speeches collected from the majority of the states sampled. I have no reason to believe that this small time frame shift in a handful of cases will cause problems for my analysis3 ; the samples used for all states–no matter what year their speeches appear–all span the same 6 year period and include two speeches from times closer to gubernatorial election years and two speeches not near an imminent election.
3As a diagnostic, I dropped these states’ speeches from my sample, ran my analysis, and did not find
Content Analysis
I used a basic dictionary-specified method of content analysis to gauge the rela-tive amount of religious language in each governor’s speech. Dictionary methods of text analysis require the researcher to specify a determined list of words to search for within the dataset of speeches, and then returns a frequency of the chosen words in each speech (Grimmer and Stewart, 2011). To decide what words to include in my religious dictionary, I used a “training” set of thirty-five speeches from years not included in my analysis, and hand-coded them for religious references or religiously connoted words to get an idea of what type of religious language is likely to infuse the speeches.
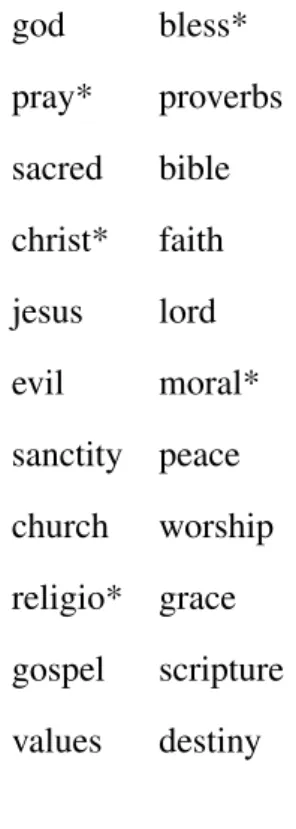
Subsequently, as a secondary method of compiling religious language and also as a rough robustness check on my dictionary, I conducted an auxiliary content analysis on the Christian Coalition’s 2010 Legislative Agenda.4 I again scanned this document for religious references that tend to be used alongside policy language, and I was able to add two extra words5 to my dictionary that I had not found in my training set, while also confirming that my original compilation of religious words existed in more than one source of policy language. I would by no means argue that my dictionary includes all possible religious language, but these words do seem to cover a great deal of the religious language that is the most likely to turn up in State of the State addresses. For-tunately, there is little ambiguity in the religious language that appears in these speeches, so the chance that any of my religious dictionary‘s words will capture an instance when it was used in a non-religious context is very slim. The dictionary used is included in Table 2 in the appendix. Words with asterisks are treated as word stems, which means that the content analysis software will pick up not only that word, but also any variant of that word and code it as a religious reference.
After the creation of the dictionary, I used the content analysis software MAXQDA to find the frequencies with which these words appeared in my sample of State of the State speeches. The frequencies of religious mentions for each speech are used as the
values of the dependent variable.
Main Independent Variables
The size of the population in a state that would be receptive to religious language because of their own religious orientations can be conceptualized and measured in two separate ways. The first is as the proportion of a state’s citizens who report that religion is very important to them. This measure comes from the Pew Religious Landscapes Sur-vey, which included a question assessing the concept of personal religious importance: one asking about church attendance and one asking about the centrality of religion in one’s daily life. The possible responses ranged on a three point scale ranging from low religious importance to high religious importance.6 The proportion of respondents in a state who fell into the highest category of religious importance is the value of this main independent variable for each observation.
The second operationalization of a receptive audience is the proportion of a state’s population holding beliefs that exhibit religious traditionalism. This measure also comes from data produced by the Pew Religious Landscapes Survey. Respondents were asked about their interpretation of holy scripture; possible responses were that their religion’s holy scripture is the literal word of God, that it is the metaphorical word of God, or that the scripture was written by men with no intervention from God. This question taps into an essential characteristic of religious traditionalism: the inerrant na-ture of religious texts. The proportion of respondents per state who answered that their holy scripture was the literal word of God will provide the value for each observation on this measure.
One possibility is that these two measures are so highly correlated that it may not make sense to attempt to tease them apart as characteristics existing separately from one another. In this case, I can use both measures to create an additive index of reli-gious traditionalism and relireli-gious importance. This index would combine both “highly
6Exact question wording from the Pew Religious landscapes survey is included in Table 3 in the
religious” characteristics into one measure, combining measures of both thoughts on religious importance and religious beliefs into a single indicator of high religiosity. If needed, this index will be measured as the proportion of respondents in a state who an-sweredboththat religion is very important to themandthat they interpret Holy Scripture as the literal word of God.
Control Variables
There are possibly other intervening factors which could exert influence on the amount of religious language that appears in governors’ speeches. One possibility is that governors may not be using their religious speech to try to appeal to voters more than they may be exhibiting a personal trait that helped them gain election in the first place. In other words, variation in the amount of religious language governors use may be caused by variation in the personal religious views of the governors themselves across the states. I would ideally operationalize this concept as a measure that captures a governor’s assessment of religious importance that is similar to the citizen measure of religious importance, but no data exists on the importance of religion to governors.
While it may not be feasible to measure a governor’s sense of religious importance, it is still possible to control for characteristics of a governor’s religious beliefs that may affect their inclusion of religious language in speeches. Particularly, one measure that could capture a relevant characteristic of a governor’s religious beliefs would be if a governor associates herself as an adherent to an Evangelical Christian denomination. Evangelical Christian denominations are driven by a strong emphasis on public displays of religion, and one of the main tenets of their faith–in comparison to other Christian denominations–is the priority which is placed on evangelizing. Adherents to this faith tradition would theoretically be more likely than non-Evangelicals to employ religious rhetoric. This concept will be operationalized as a dichotomous variable noting whether a governor is (1) or is not (0) associated with Evangelical Christianity.
is speaking. As mentioned previously, research shows that Republican Party platforms at the state level contain significant amounts of religious language and themes (Conger, 2010a). Because of this close alignment of the visible Religious Right movement with the Republican Party, one might expect for Republican governors to be more likely to include higher levels of religious language in their addresses. To control for this possibility, I include a dichotomous variable noting if the governor in question identifies as a Republican (1) or a Democrat (0).
The mean ideology of a state’s citizens may cause them to appear to the governor to be more receptive to religious language. If a state is overwhelmingly conservative, a governor may assume that more voters are likely to be religious based on their con-servative stances on issues. A governor may then feel more comfortable using religious rhetoric in her speech. The foundation for this conjecture lies in the research linking the Christian Right movement to the Republican Party and to more conservative voters in general in the United States (Layman, 2001; Green, Rozell, and Wilcox, 2006; Conger, 2010b). I control for the public’s ideology by using a measure from the Cooperative Congressional Elections Study of respondents’ ideology on a scale of 1 to 7. These scores were then collapsed into a continuous 3 point measure (from conservative to lib-eral) and the mean response within a particular state was recorded the state’s ideology score.
Another factor to control for that I include in this analysis is a dummy variable for whether or not the speech came from a state that is in the census-defined region of the South. This is the closest approximation I can find to control for a possible effect of simply being in the loosely defined area known as “the Bible Belt,” which perhaps exudes a certain contextual or cultural effect on expectations for the inclusion of an undertone of religious themes and language in political speech.
of time she is speaking. To control for speech length, I include a natural log-transformed measure of the simple word count of each speech.
Analysis
Descriptive Results
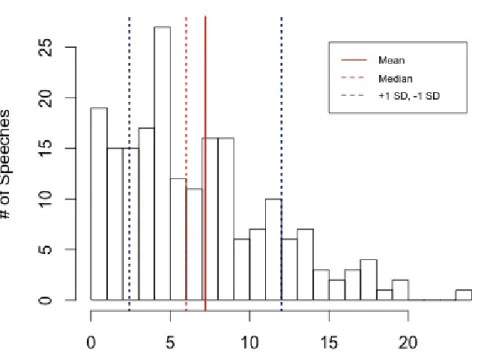
The distribution of the dependent variable, as shown in Figure 1, depicts how the level of inclusion of religious language varies across the sample of speeches. A sizeable peak at zero mentions is followed by another peak around the modal category for four religious mentions, and the counts trail off in frequency after that, until the single speech with twenty four mentions (from Governor Tom Vilsack of Iowa in 2004) in the right tail of the distribution. The median number of religious mentions was six, while the mean was 7.2 mentions. When religious language did show up in a speech, almost half the time it was in the form of “God” (23% of mentions) or some variant of “bless” (24% of mentions). These words were followed by “values,” “faith,” “pray,” and “Christ;” which together constituted 32% of religious language use in speeches. The most seldom used words were “gospel” with only one mention (0.07%) and “proverbs” with only three mentions (0.21%).
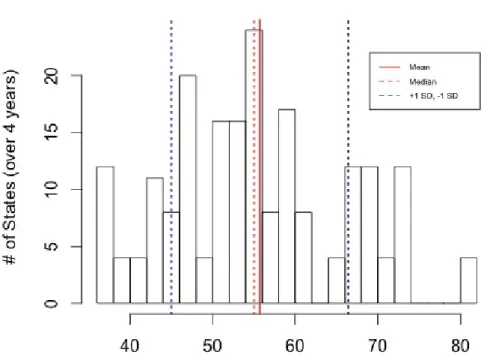
The a histogram of the distribution of the first main independent variable–the pro-portion of a state’s population who hold religion as very important–is shown in Figure 2. These proportions have been transformed into simple percentages for ease of inter-pretation, and they range from a low of 36% in Vermont and Hew Hampshire to a high of 82% in Mississippi. The median value of the distribution is 55%, and the mean is 56%.
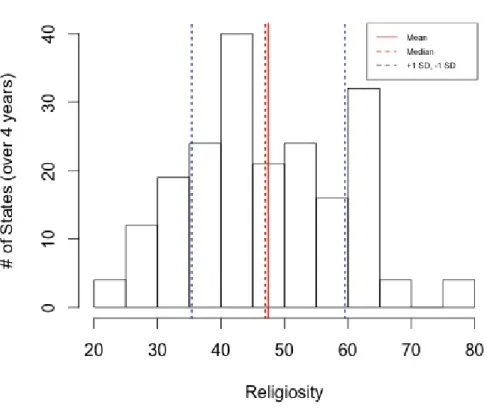
As was suspected, these two measures mentioned above are highly correlated with one another (with a correlation coefficient of 0.83 at the individual respondent level). Also, when a joint F test is preformed to assess their value of inclusion in the model, it becomes apparent that these two variables–with effects indistinguishable from zero when both included in the model–are somehow jointly exerting an effect on religious language inclusion that is statistically distinguishable from zero.7 To be able to pro-vide epro-vidence for my hypotheses, I compile both main independent variables and merge them into an index of overall religiosity in each state. This index combines concepts of personal religious importance and traditional religious behaviors to provide a more well-rounded measure of state religiosity. It is measured as the proportion of survey respondents in each state who responded as having high religious importance and hav-ing a traditionalistic view of scripture.8 This measure ranges from a low of 23.6% in Vermont to a high of 76.8% in Mississippi, with a mean and median of 47%. 9
Results
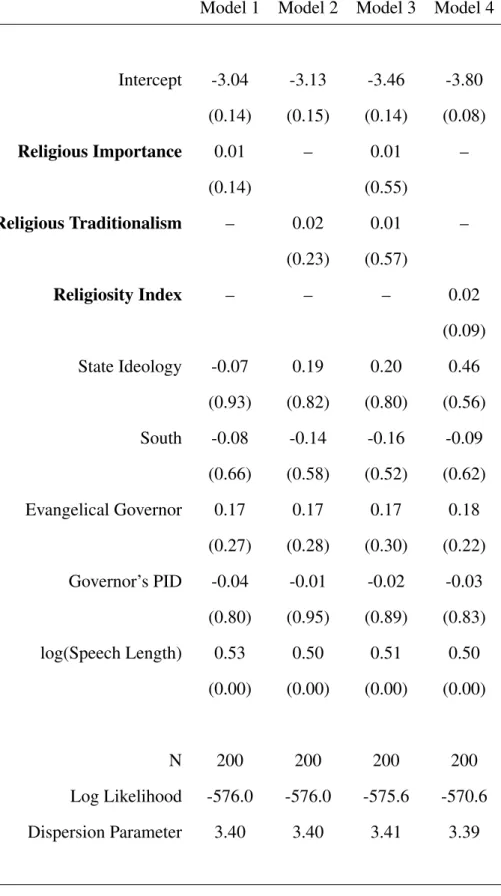
The results of my negative binomial regression models are presented in Table 1. The p-values presented alongside the coefficient estimates were calculated using Bootstrap Cluster Standard Errors, which are robust to the clustering on the state that occurs in the data.10 I present four models: Model 1 includes state religious importance as the main independent variable, Model 2 includes state religious traditionalism as main the independent variable, Model 3 includes both main independent variables to assess the degree to which their multicollinearity affects their effect estimation, and Model 4 drops both main independent variables in favor of the additive index of the two referred to as the State Religiosity Index. The first three models are included for the reader’s information, but I will focus my interpretation on the results from Model 4.
The main finding in these results is that the percent of the state population who hold
7F=2.76, p=0.06
8See appendix (Table 3) for exact question wording.
9A histogram of this Religiosity Index is displayed in Figure 4.
both high religious importance and religious traditionalism has a positive effect on a governor’s inclusion of religious language in State of the State speeches when both of these concepts are combined into a single measure. The exponentiated coefficient is the multiplicative effect of a one unit increase in the percent highly religious population on the rate of religious language occurrence in SotS addresses. In other words, for every one unit increase in the percent of the state population who are highly religious, there is a positive two percent impact(e0.016)on the rate of religious language occurring.
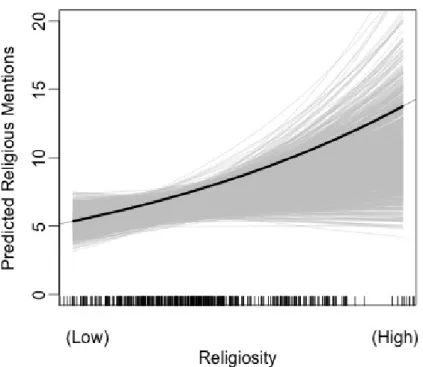
More substantively, this means that if we hold all other variables at their means (or modes in the case of dichotomous variables)11 , a shift in the value observed on the Religiosity Index from the minimum of 23.6% to the median of 47% would result in an increase of expected religious word usage from 5.6 words to 8.1 words. If the value of the Religious Index variable was increased to it’s maximum of 76.8%, the expected religious language use would increase to 13.1 words.12 To observe the results in another, arguably more plausible scenario, let us again hold all variables at their means or modes except the governor will now be classified as an Evangelical Christian. In this scenario, a mean value on the Religiosity Index would be associated with an estimate of 9.7 religious mentions, while the maximum of 76.8% on the Religiosity Index would be associated with approximately 15.5 religious references. 13
Of the remaining independent variables, only the speech length seemed to matter when explaining the amount of religious language used. Its statistically significant effect can likely be attributed to the fact that as one speaks for a longer amount of time (or as one uses more words), the likelihood that one of those words will be in the religious dictionary of terms increases.
While it is surprising that none of the other variables such as the governor’s party identification show any effects distinguishable from zero, it is interesting to see
evi-11This translates to observing a moderate state, not in the South, with a Democratic, non-Evangelical
governor giving an average-length speech
12This relationship is presented graphically in Figure 5
13I am confident in the stability and reliability of the estimate of the effect of the main independent
dence that religious beliefs among the constituency, free of partisan, ideological, or regional associations, may be the underlying force in religious language inclusion by governors. One concern would lie with the multicollinearity between the variables. As a diagnostic, I checked each independent variable’s variance inflation factor by regress-ing each independent variable on the other independent variables.14 15 The variance inflation factor for each independent variable depicts the severity of the collinearity that each variable shares with the other variables. The standard rule of thumb accepted in previous research is that a VIF of greater than 10 means that serious multicollinearity problems are present in the model. All of the variance inflation factors for the indepen-dent variables in my model are well below this standard rule of thumb recommendation; the values themselves can be found in Table 5 in the appendix.
Conclusions and Implications
The first conclusion drawn from the preceding results is support for the literature that focuses on public officials’ need to secure the votes of various interest coalitions. It is clear that, with all other factors held constant, the size of the religious population in a state (defined by their religious importance and religious traditionalism) drives a gov-ernor’s use of religious references. Second, the patterns in the data support the idea that governors reach out to this valuable religious coalition of voters using “homestyle” lin-guistic tactics to build trust with these voters. More generally, another conclusion is that governorsare responding to their citizens; they are telling their constituents what they want to hear based on their constituents’ worldview. Even when taking into account the possibility that governors may be using religious language because they are them-selves products of the religious environment of their state, the effect of direct response to voters remains evident. One interesting caveat to this conclusion is that a measure of
14followed by extracting the R-squared for each of these auxiliary regressions and substituting the
auxiliaryR2s into the formula 1
1−R2 [whereR2is the newR2from each auxiliary regression]
15VIF tests were run on the parameters included in Model 4; this does not include previously assessed
the population’s religious importance or a measure of religious traditionalism (without combining them) does not reveal a statistically significant effect on religious language inclusion, but combining the two measures into an index does give leverage when dis-tinguishing an effect. This suggests that religious interest coalitions are marked by many distinguishable characteristics, and governors are not responding to only one or the other. It seems that governors are responding to a multifaceted portrait of religiosity in their state.
If it is true that governors are responding to their religious constituencies in the form of religious language in their speeches to appeal to these voters, there could be many important implications for state and national politics across the board. Most obviously, it would be an indication that religionisan important determining factor in how politi-cians communicate with an relate to their citizens.
In addition, we have already observed more widespread inclusion of religious themes in public official’s speeches over time (Toolin, 1983)16 . If leaders are actu-ally appealing to religious voters this way, and they are doing it in speeches that focus on policy agendas as the State of the State addresses certainly do, this could lead to an increasing level of religious themes or frames being used to describe policy issues. While part of the governor’s decision to employ religious references in speeches may be based on the desire to identify with citizens or to legitimize herself as a leader, a possibly unintended side effect may be an increased likelihood of talking about policy in terms of religion or morality instead of in objective terms. This could lead to a higher level of use (and possibly a higher level of public acceptance) of religiously-based frames of political issues as they become accustomed to hearing these languages used hand in hand. This opens the door for future research that could examine in greater detail exactly what issues appear to be tied to religious language in public officials’ speech.
16Toolin observed that the distribution of explicit religious references in presidential speech was
Figures and Tables
Fig. 1:Distribution of the Dependent Variable: Frequencies of Religious Language Use
Fig. 2:Distribution of IV: Population with High Religious Importance
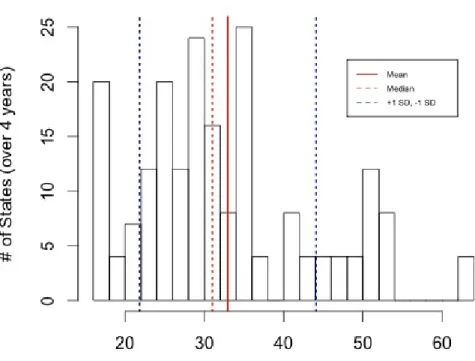
Fig. 3: Distribution of IV: Population with High Religious Traditionalism
Fig. 4: Distribution of IV: Index of Religiosity (Importance + Traditionalism)
Table 1:Governors’ Religious Speech: Negative Binomial Regression Results*
Model 1 Model 2 Model 3 Model 4
Intercept -3.04 -3.13 -3.46 -3.80 (0.14) (0.15) (0.14) (0.08)
Religious Importance 0.01 – 0.01 –
(0.14) (0.55)
Religious Traditionalism – 0.02 0.01 –
(0.23) (0.57)
Religiosity Index – – – 0.02
(0.09)
State Ideology -0.07 0.19 0.20 0.46
(0.93) (0.82) (0.80) (0.56)
South -0.08 -0.14 -0.16 -0.09
(0.66) (0.58) (0.52) (0.62)
Evangelical Governor 0.17 0.17 0.17 0.18
(0.27) (0.28) (0.30) (0.22) Governor’s PID -0.04 -0.01 -0.02 -0.03
(0.80) (0.95) (0.89) (0.83)
log(Speech Length) 0.53 0.50 0.51 0.50
(0.00) (0.00) (0.00) (0.00)
N 200 200 200 200
Log Likelihood -576.0 -576.0 -575.6 -570.6
Dispersion Parameter 3.40 3.40 3.41 3.39
*Note: results presented as Coefficient (P-value)
Fig. 5:Effect of State Religiosity on Religious Language Use (with all other variables held at
Appendix
Table 2:Religious Language Dictionary
god bless*
pray* proverbs sacred bible christ* faith jesus lord
evil moral*
sanctity peace church worship religio* grace gospel scripture values destiny
*Note: words followed by asterisks (word*) are treated as
Table 3: Pew Religious Landscapes Question Wording
Q21. How important is religion in your life - very important, somewhat important, not too important, or not at all important?
1) Very important 2) Somewhat important 3) Not too important 4) Not at all important 9) Don’t know/Refused
(categories 3 and 4 were collapsed together.)
Q37. Which comes closest to your view of Holy Scripture? 1) [Holy book] is the word of God
2) [Holy book] is a book written by men and is not the word of God 3) Other
9) Don’t know/Refused
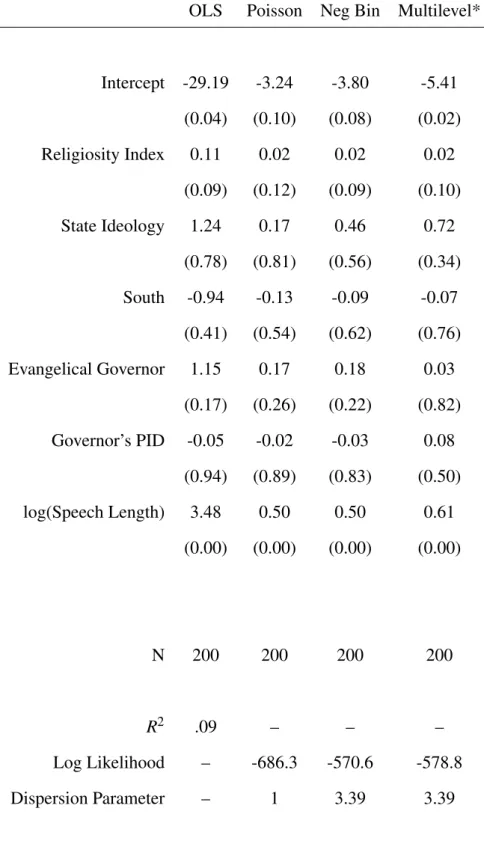
Table 4: Model Exploration of Gubernatorial Religious Speech
OLS Poisson Neg Bin Multilevel*
Intercept -29.19 -3.24 -3.80 -5.41 (0.04) (0.10) (0.08) (0.02)
Religiosity Index 0.11 0.02 0.02 0.02
(0.09) (0.12) (0.09) (0.10)
State Ideology 1.24 0.17 0.46 0.72
(0.78) (0.81) (0.56) (0.34)
South -0.94 -0.13 -0.09 -0.07
(0.41) (0.54) (0.62) (0.76) Evangelical Governor 1.15 0.17 0.18 0.03
(0.17) (0.26) (0.22) (0.82) Governor’s PID -0.05 -0.02 -0.03 0.08
(0.94) (0.89) (0.83) (0.50)
log(Speech Length) 3.48 0.50 0.50 0.61
(0.00) (0.00) (0.00) (0.00)
N 200 200 200 200
R2 .09 – – –
Log Likelihood – -686.3 -570.6 -578.8
Dispersion Parameter – 1 3.39 3.39
*Multilevel negative binomial model with state random effects
Note: results presented as Coefficient (p-value)
Table 5:Variance Inflation Factors of Explanatory Variables in Model 4
Religiosity Index 3.06
State Ideology 2.28
Party ID 1.10
South 1.90
Evangelical Governor 1.33
References
Axelrod, Robert. 1972. “Where the Votes Come From: An Analysis of Electoral Coalitions, 19521968.”American Political Science Review. Vol. 66, pp. 1120. Axelrod, Robert. 1986. “Presidential Election Coalitions in 1984.”American Political
Science Review. Vol 80, pp. 2814.
Barth, Jay and Margaret R. Ferguson. 2002. “American Governors and their Con-stituents: The Relationship between Gubernatorial Personality and Public Ap-proval.”State Politics and Policy Quarterly. Vol. 2: no. 3, pp. 268-282.
Black, Amy E. 2004. “With God on Our Side: Religion in George W. Bushs Foreign Policy Speeches.” Prepared for presentation at the annual meeting of the Ameri-can Political Science Association; Chicago, Illinois, September 2-5, 2004. Coffey, Daniel. 2005. “Measuring Gubernatorial Ideology: A Content Analysis of
State of the State Speeches.State Politics and Policy Quarterly. Vol. 5: no. 1, pp. 88-103.
Conger, Kimberly H. 2010a. “Party Platforms and Party Coalitions: The Christian Right and State-Level Republicans.Party Politics. Vol. 16: no. 5, pp. 651-668. Conger, Kimberly H. 2010b. “A Matter of Context: Christian Right Influence in U.S.
State Republican Politics.State Politics and Policy Quarterly. Vol. 10: no. 3, pp. 248-269.
DiLeo, Daniel. 1997. “Dynamic Representation in the United States: Effects of the Public’s Mood on Governors‘ Agendas.” State and Local Government Review. Vol. 29, pp. 98-109.
Fenno, Richard F., Jr. 1978. Home Style: House Members in Their Districts. Boston: Little, Brown.
Fiorina, Morris P., Abrams, Samuel J., and Jeremy C. Pope. 2010. Culture war?: the myth of a polarized America, Third Edition. Pearson Longman Publishers. Green, John C., Rozell, Mark, and Clyde Wilcox. 2006. The Values Campaign? The
Christian Right and the 2004 Elections.Georgetown University Press.
Glass, David P. “Evaluating Presidential Candidates: Who Focuses on Their Personal Attributes?”Public Opinion Quarterly. Vol 49: no. 4, pp. 517-534.
Grimmer, Justin and Brandon M. Stewart. 2011. “Text as Data: The Promise and Pitfalls of Automatic Content Analysis Methods for Political Texts. (Working paper.)
Herzik, Eric B. 1991. “Policy Agendas and Gubernatorial Leadership.” in Gubernato-rial Leadership and State Policy, eds. Eric B. Herzik and Brent W. Brown. Santa Barbara, CA: Greenwood Press.
Jackson, John E., and John W. Kingdon. 1992. “Ideology, Interest Group Scores, and Legislative Votes.American Journal of Political Science. Vol 36, pp. 80523. Layman, Geoffrey C., and Edward G. Carmines. 1997. “Cultural Conflict in American
Politics: Religious Traditionalism, Postmaterialism, and U.S. Political Behavior. Journal of PoliticsVol. 59 (3): 75177.
Layman, Geoffrey C. 2001. The Great Divide: Religious and Cultural Conflict in American Party Politics.New York: Columbia University Press.
Rosenthal, Alan. 1990.Governors and Legislators: Contending Powers. Washington, DC: CQ Press.
Toolin, Cynthia. 1983. “American Civil Religion from 1789 to 1981: A Content Anal-ysis of Presidential Inaugural Addresses.”Review of Religious Research. Vol. 25, pp. 39-48.
Van Assendelft, Laura A. 1997.Governors, Agenda Setting, and Divided Government. Lanham, MD: University Press of America.
Wald, Kenneth D. 2003. Religion and Politics in the United States. 4th Edition. Lan-ham: Rowman and Littlefield Publishers, Inc.