NONCANCER MORTALITY AMONG ADOLESCENTS AND YOUNG ADULTS WITH CANCER
Chelsea Anderson
A dissertation submitted to the faculty at the University of North Carolina at Chapel Hill in partial fulfillment of the requirements for the degree of Doctor of Philosophy in the Department
of Epidemiology in the Gillings School of Global Public Health.
Chapel Hill 2019
Approved by: Hazel Nichols Jennifer Lund Andrew Olshan
ii
iii ABSTRACT
Chelsea Anderson: Noncancer mortality among adolescents and young adults with cancer (Under the direction of Hazel Nichols)
Background: As a result of cancer treatment-related exposures, cancer survivors may be at elevated risk for several noncancer conditions. We used data from the Surveillance,
iv
nervous system tumors (SMR=3.38), head and neck cancers (SMR=2.09), and cervical/uterine cancers (SMR=2.03). Aim 2: All noncancer mortality was significantly increased among non-Hispanic Black AYAs (HR vs non-non-Hispanic White: HRWomen=2.31; HRMen=2.17) and those in the South (HR vs. Northeast: HRWomen=1.18; HRMen=1.42) or in rural counties (HR vs metro:
v
ACKNOWLEDGEMENTS
I would first like to thank my advisor and dissertation committee chair, Hazel Nichols, for her continued guidance and support throughout my time in the doctoral program. I would also like to thank my committee members, Andrew Olshan, Jennifer Lund, Mark Weaver, and
vi
TABLE OF CONTENTS
LIST OF TABLES ...x
LIST OF FIGURES ... xiii
LIST OF ABBREVIATIONS...xiv
CHAPTER 1. INTRODUCTION ...1
CHAPTER 2. REVIEW OF THE LITERATURE ...3
2.1. Background ...3
2.1.1. Descriptive epidemiology of cancer in AYAs ...3
2.1.2 Unique characteristics of the AYA cancer patient population...4
2.1.3. Potential adverse effects of cancer treatment in AYAs ... 10
2.2. Critical review of the literature... 16
2.2.1. Cardiovascular outcomes ... 16
2.2.2. Infectious disease outcomes ... 20
2.2.3. Renal outcomes ... 21
2.2.4. Pulmonary outcomes ... 22
2.2.5. Gastrointestinal and liver outcomes ... 23
2.2.6. Mortality disparities among AYAs with cancer by race and socioeconomic status .... 25
vii
CHAPTER 3. AIMS... 29
CHAPTER 4. METHODS... 32
4.1. Data source ... 32
4.2. Aim 1 ... 33
4.2.1. Study population ... 33
4.2.2. Key variables... 33
4.2.3. Statistical analysis ... 35
4.3. Aim 2 ... 36
4.3.1. Study population ... 36
4.3.2. Key variables... 37
4.3.3. Statistical analysis ... 39
CHAPTER 5. NONCANCER MORTALITY AMONG ADOLESCENTS AND YOUNG ADULTS WITH CANCER ... 41
5.1 Background ... 41
5.2 Methods ... 42
5.2.1 Data source ... 42
5.2.2 Study population ... 42
5.2.3 Noncancer causes of death ... 43
5.2.4 Statistical analysis ... 43
5.3 Results ... 44
viii
5.3.2 Cardiovascular disease mortality ... 46
5.3.3 Infectious disease mortality ... 46
5.3.4 Mortality from other noncancer causes ... 47
5.3.5 Sensitivity analyses ... 47
5.4 Discussion ... 48
5.5 Tables ... 54
CHAPTER 6. DISPARITIES IN MORTALITY FROM NONCANCER CAUSES AMONG ADOLESCENTS AND YOUNG ADULTS WITH CANCER ... 81
6.1 Background ... 81
6.2 Methods ... 82
6.2.1 Study population ... 82
6.2.2 Patient characteristics ... 83
6.2.3 Noncancer deaths ... 84
6.2.4 Statistical analysis ... 84
6.3 Results ... 85
6.4 Discussion ... 88
6.5 Tables and figures ... 93
CHAPTER 7. DISCUSSION ... 119
7.1 Main findings ... 119
7.2 Strengths and limitations ... 120
ix
7.4 Future Directions ... 122
APPENDIX 1. SEER AYA SITE RECODE/WHO 2008 DEFINITION ... 124
APPENDIX 2. NONCANCER CAUSE OF DEATH CLASSIFICATION IN SEER ... 128
x
LIST OF TABLES
Table 1.1 Cardiotoxicities associated with cancer therapies that may be used in
AYA patients ... 11
Table 4.1 Noncancer causes of death in SEER... 34
Table 4.2 Cancers examined in site-specific analyses, defined using AYA Site Recode/WHO 2008 ... 36
Table 4.3 Rural-Urban Continuum Code Definitions for 2003 and 2013 ... 38
Table 4.4. Geographic regions defined using SEER registries ... 39
Table 5.1. Characteristics of AYAs diagnosed with cancer, SEER 9, 1973-2015 ... 54
Table 5.2. Rates of mortality from noncancer causes among AYAs with cancer compared to the general population ... 55
Table 5.3. SMRs for mortality from all noncancer causes, infectious diseases, cardiovascular diseases, and respiratory diseases among AYAs with cancer according to patient characteristics ... 57
Table 5.4. SMRs for mortality from gastrointestinal (GI) and liver diseases, renal diseases, external causes, and other causes among AYAs with cancer according to patient characteristics ... 59
Table 5.5. SMRs for mortality from all noncancer causes, infectious diseases, cardiovascular diseases and respiratory diseases among AYAs with cancer according to stage, stratified by cancer type ... 61
Table 5.6. SMRs for mortality from gastrointestinal (GI) and liver diseases, renal diseases, external causes, and other causes among AYAs with cancer according to stage, stratified by cancer type ... 63
Table 5.7 SMRs for mortality from all noncancer causes, infectious diseases, cardiovascular diseases, and respiratory diseases among AYAs with cancer according to time since diagnosis, stratified by cancer type ... 65
xi
Table 5.9. SMRs for mortality from all noncancer causes, infectious diseases, cardiovascular diseases, and respiratory diseases among AYAs with cancer
according to age at diagnosis, stratified by cancer type ... 71 Table 5.10. SMRs for mortality from gastrointestinal (GI) and liver diseases, renal diseases, external causes, and other causes among AYAs with cancer according to age at diagnosis, stratified by cancer type ... 74 Table 5.11. Sensitivity analysis varying the latency exclusion period ... 77 Table 5.12. Sensitivity analysis of cause of death misclassification, varying the extent to which observed deaths from noncancer causes among AYAs with cancer are overestimated ... 79 Table 6.1. Characteristics of AYAs diagnosed with cancer, SEER 18, 1985-2015 ... 93 Table 6.2. Cumulative incidence of all noncancer deaths among AYA women with cancer, SEER 18, 1985-2015 ... 95 Table 6.3 Cumulative incidence of cardiovascular disease death among AYA women with cancer, SEER 18, 1985-2015 ... 96 Table 6.4 Cumulative incidence of infectious disease deaths among AYA women with cancer, SEER 18, 1985-2015 ... 97 Table 6.5. Cumulative incidence of all noncancer deaths among AYA men with cancer, SEER 18, 1985-2015 ... 98 Table 6.6 Cumulative incidence of cardiovascular disease deaths among AYA men with cancer, SEER 18, 1985-2015 ... 99 Table 6.7 Cumulative incidence of infectious disease deaths among AYA men with cancer, SEER 18, 1985-2015 ... 100 Table 6.8. Hazard ratios for all noncancer deaths according to patient characteristics among AYA women with cancer, 1985-2015 ... 107 Table 6.9. Hazard ratios for cardiovascular disease deaths according to patient
characteristics among AYA women with cancer, 1985-2015 ... 108 Table 6.10. Hazard ratios for infectious disease deaths according to patient
xii
Table 6.12. Hazard ratios for cardiovascular disease deaths according to
patient characteristics among AYA men with cancer, 1985-2015 ... 111 Table 6.13. Hazard ratios for infectious disease deaths according to patient
characteristics among AYA men with cancer, 1985-2015 ... 112 Table 6.14 Hazard ratios for all noncancer deaths according to patient characteristics among AYA women with cancers other than Non-Hodgkin lymphoma, 1985-2015 ... 113 Table 6.15 Hazard ratios for cardiovascular disease death according to patient
characteristics among AYA women with cancers other than Non-Hodgkin lymphoma, 1985-2015 ... 114 Table 6.16 Hazard ratios for infectious disease death according to patient
characteristics among AYA women with cancers other than Non-Hodgkin lymphoma, 1985-2015 ... 115 Table 6.17 Hazard ratios for all noncancer deaths according to patient
characteristics among AYA men with cancers other than Non-Hodgkin lymphoma, 1985-2015 ... 116 Table 6.18 Hazard ratios for cardiovascular disease death according to patient
characteristics among AYA men with cancers other than Non-Hodgkin lymphoma, 1985-2015 ... 117 Table 6.19 Hazard ratios for infectious disease death according to patient
xiii
LIST OF FIGURES
Figure 6.1. Cumulative incidence of mortality from all noncancer causes
according to race/ethnicity among AYA women with cancer, SEER 18, 1985-2015 ... 101 Figure 6.2. Cumulative incidence of mortality from cardiovascular diseases
according to race/ethnicity among AYA women with cancer, SEER 18, 1985-2015 ... 102 Figure 6.3. Cumulative incidence of mortality from infectious diseases according to race/ethnicity among AYA women with cancer, SEER 18, 1985-2015 ... 103 Figure 6.4. Cumulative incidence of mortality from all noncancer causes
according to race/ethnicity among AYA men with cancer, SEER 18, 1985-2015 ... 104 Figure 6.5. Cumulative incidence of mortality from cardiovascular diseases
according to race/ethnicity among AYA men with cancer, SEER 18, 1985-2015 ... 105 Figure 6.6. Cumulative incidence of mortality from infectious diseases
xiv
LIST OF ABBREVIATIONS
ACS American Community Survey
AER Absolute excess risk
ALiCCS Adult Life after Childhood Cancer in Scandinavia ALL Acute lymphocytic leukemia
AYA Adolescents and young adults
BRFSS Behavioral Risk Factor Surveillance System CCSS Childhood Cancer Survivor Study
CHF Congestive heart failure
CI Confidence interval
CNS Central nervous system CVD Cardiovascular disease
FIPS Federal Information Processing Standards
GI Gastrointestinal
HER2 Human epidermal growth factor receptor 2
HIV Human immunodeficiency virus
HL Hodgkin lymphoma
HR Hazard ratio
HSCT Hematopoietic stem cell transplantation
ICD-O-3 International Classification of Diseases for Oncology, third edition
ID Infectious disease
IRR Incidence rate ratio
xv
NCCN National Comprehensive Cancer Network NCI National Cancer Institute
NHL Non-Hodgkin lymphoma
RR Rate ratio
SMR Standardized mortality ratio
US United States
1
CHAPTER 1. INTRODUCTION
Adolescents and young adults (AYAs) with cancer represent an understudied patient group in the United States (U.S.), falling between the childhood and older adult cancer patients who are more often the focus of cancer survivorship research. The National Cancer Institute defines AYAs with cancer as those diagnosed between the ages of 15 and 39 years.[1] Though a heterogenous group within themselves, AYAs with cancer are distinguished from childhood and older adult cancer patients in their cancer type distribution, disease and host biology, patterns of treatment, and psychosocial and other patient characteristics,[2] all of which may contribute to a unique risk profile for both short- and long-term health outcomes among AYA cancer patients and survivors.
A number of cancer treatments may increase risk of morbidity and mortality from
noncancer causes among individuals with cancer relative to the general population. Perhaps most notoriously, many chemotherapeutic agents have immunosuppressive and/or cardiotoxic
2
childhood cancer survivors are unlikely to adequately reflect their risk, making this a critical gap in the current evidence base.
3
CHAPTER 2. REVIEW OF THE LITERATURE
2.1. Background
2.1.1. Descriptive epidemiology of cancer in AYAs
More than 70,000 AYAs are diagnosed with invasive cancer each year in the U.S., representing about 4% of all new cases,[2] and approximately seven times as many diagnoses as in children younger than 15 years.[3, 4] In recent decades, overall cancer incidence in AYAs in the U.S. has been slowly increasing, though patterns vary by cancer type, and the increase overall is largely driven by recent increases in thyroid cancer diagnoses.[5] The most common cancer types diagnosed across the AYA age range differ markedly from those most commonly diagnosed among children and older adults. In AYAs, thyroid cancers are most common
overall,[6] though leukemia and lymphoma are most frequent among 15-24 year-olds, and breast cancer and melanoma occur most often in 25-39 year-olds.[7] Testicular cancer and bone
sarcomas, including osteosarcoma and Ewing sarcoma, peak in incidence among AYAs,[5] and thyroid cancer in females also starts to become more common in this age group.[7] In total, the incidence of cancer in AYAs is slightly higher among females than males,[2] largely due to breast and thyroid cancers at the upper end of the AYA age spectrum. Across racial/ethnic groups, cancer incidence in AYAs is highest in non-Hispanic whites, and lowest in American Indians/Alaska Natives.[1]
4
gains in AYAs have lagged behind those observed in childhood and older adult cancer
patients.[8] Among AYAs, there are notable differences in five-year relative survival across the more common cancer sites, ranging from approximately 56% among those with carcinomas of the gastrointestinal (GI) tract (70% for colon and rectum; <40% for stomach, pancreas, and liver) and 64% among those diagnosed with leukemia, to nearly 100% among those diagnosed with thyroid cancer.[9] Thus even for cancers with the poorest prognosis on average, many AYA patients will go on to survive at least five years beyond their original diagnosis. Consequently, the long-term health of AYA cancer survivors, including late effects of cancer treatment on noncancer morbidity and associated mortality, has become a priority area for research. 2.1.2 Unique characteristics of the AYA cancer patient population
AYAs have been defined as a distinct cancer patient population due to well-recognized differences from children and older adults in disease and host biology, patient characteristics and psychosocial aspects, and patterns of treatment. All of these factors have the potential to impact survival from both cancer and noncancer causes, supporting the study of long-term health outcomes in AYA cancer survivors as a group separate from childhood or older adult survivors. Disease and host biology
5
Noteworthy examples of cancers types with a potentially unique biology in AYAs include breast cancer, colorectal cancer, and acute lymphocytic leukemia. Breast cancers diagnosed among younger women, including AYAs, tend to be less-hormone sensitive, of a higher grade, and with greater lymph nodal involvement than those diagnosed among older women. Tumors lacking receptors for estrogen, progesterone, and HER2, known as triple-negative tumors, are more common in younger women, and are associated with fewer treatment options and poorer prognosis than other tumor subtypes.[10-12] Other gene expression
signatures, such as enriched growth factor signaling, are more common in younger women, when accounting for subtype distribution.[13, 14] Even within hormone-receptor positive tumor
subtypes, younger women may have poorer survival than older women,[15] suggesting a more aggressive tumor biology. These differences contribute to the more aggressive treatment typically received by younger women, which may lead to different treatment-related sequelae and patterns of noncancer morbidity and mortality than those reported in older women.
6
different treatment strategies, which may in turn contribute to different long-term risk profiles for adverse late effects.
Acute lymphocytic leukemia (ALL) is most common in children and AYAs, but may present with different biological characteristics in the two groups. Characteristics which are more common in AYAs, and associated with poorer prognosis, include L2 morphology, pro-T cell immunophenotype, the t(9,22) BCR-ABL translocation, and the Hox+ subtype. The TEL-AML1 chromosomal translocation, associated with favorable prognosis,[18] is significantly less
common in AYAs.[5, 10] On the other hand, certain growth-regulating kinase tumor suppressor genes are more methylated in adult patients than in children,[19] and a potential target for anti-cancer drugs that act on hypermethylation sites. Newer therapies that are utilized more
commonly in adults may have long-term health implications that differentiate AYA from childhood cancer patients.
Along with these distinguishing features of cancer biology, various aspects of host biology may also distinguish AYAs from younger and older patient groups. Physiological changes, particularly those related to hormonal changes, are an important consideration in the treatment and outcomes of AYAs, with the potential to affect drug metabolism and clearance, toxicities, and treatment efficacy.[10] Other host biological differences, such as a higher prevalence of obesity in AYAs compared with younger patients, and changes in body
7
Patterns of treatment
While children diagnosed with cancer in the U.S. are often treated in specialized pediatric cancer centers, AYAs are more likely to be treated in community-based settings than in
academic centers, which can limit access to clinical trials and influence the treatment protocols used.[2, 22] For some cancers in AYAs, such as ALL and rhabdomyosarcoma, treatment with pediatric protocols has been associated with superior outcomes. For others, such as Hodgkin and non-Hodgkin lymphoma, the evidence does not suggest a benefit of pediatric over adult
treatment protocols.[22] As noted previously, the distinctive biology of many cancers in AYAs may necessitate distinct treatment strategies from those used in other age groups. Consequently, it is critical that AYAs are seen by oncologists with specialized expertise and experience in treating cancers common in this age group. In general, AYAs have fewer comorbidities than older adult patients and can thus tolerate more intensive treatment regimens, and clinical guidelines from the National Comprehensive Cancer Network (NCCN) suggest that, though approaches will vary by diagnosis, most AYA without contraindications should be treated with aggressive therapy.[22] These aggressive treatment approaches may prove beneficial for improving survival from the original cancer diagnosis, but may also be associated with adverse early and late effects that contribute to mortality from noncancer causes.
Patient characteristics and psychosocial aspects
Individuals with cancer as AYAs may face special challenges related to insurance status and healthcare access, financial security before and after treatment, and the need for
8
of receiving the recommended follow-up and survivorship care,[24-27] which may be critical for early detection of recurrences, second malignancies, and late effects of treatment. Being
uninsured has also been associated with higher all-cause mortality in cancer patients diagnosed as AYAs.[28] Furthermore, findings from the Behavioral Risk Factor Surveillance System (BRFSS), a nationally representative survey, have suggested that, although the proportion
uninsured may be similar between survivors of cancer and controls, cancer survivors in the AYA age group may be more likely to forgo medical care due to costs, even for those with health insurance.[29] This is likely attributable to greater care needs and the associated costs for individuals with a cancer history. It is unclear how recent healthcare legislation changes will affect care among young people with medical conditions such as a cancer diagnosis. However, it remains likely that loss of health insurance coverage, either through loss of employment or aging out of parents’ insurance, will be a critical issue for many young adults. For AYA cancer
survivors, forgoing care due to costs, lack of insurance, or both, could negatively influence long-term survival from both cancer and noncancer causes.
9
long-term surveillance for second cancer events and late effects of treatment. A 2012 online LIVESTRONG survey found that most AYA cancer patients had to take time off from work or school, switch to part-time work, or find a less demanding job, and many reported that their overall productivity at work was adversely affected by their cancer diagnosis.[3] Results from the 2009 BRFSS suggest that individuals with an AYA cancer history are more likely to be out of work or unable to work than their age-matched peers without a history of cancer.[31] Such interruptions or transitions in employment may strain personal finances, with the potential for long-lasting effects on health and well-being.
Finally, having cancer as an AYA can be a major life stressor in other aspects of life, bringing with it the need for age-appropriate psychological and social support. Late adolescence and early adulthood are critical periods for establishment of personal identity and independence, which may be disrupted by the need to rely on others during cancer treatment and recovery.[32] Other possible life disruptions may include those related to peer relations, family dynamics, and self-esteem, as well as future plans.[3] Furthermore, emotional development may not yet be complete in some AYAs,[33] who may benefit from psychological services to learn adequate coping strategies. AYAs with cancer may also have unique information and service needs related to fertility, body-image, financial issues, and mental health, which may require additional
intervention. Prior reports have shown that as many as two-thirds of AYAs have unmet
10
2.1.3. Potential adverse effects of cancer treatment in AYAs
Established negative sequelae of cancer treatment include both short-term and long-term adverse effects, many of which may precipitate early death from noncancer causes. These effects include, among others, infectious, cardiovascular, pulmonary, renal, and gastrointestinal
complications.[2] However, the preponderance of evidence to date on adverse effects has come from studies of cancer survivors diagnosed as children or older adults, rather than AYAs. For example, much of the evidence used to guide the assessment of long-term outcomes in AYAs comes from the reports from the Childhood Cancer Survivor Study (CCSS),[37] comprised of childhood and adolescent cancer survivors diagnosed before age 21. Given that age at treatment modifies the risk of several late effects,[22] there is a critical need to consider these outcomes among AYAs as a distinct group. A specific lack of evidence on long-term treatment-related effects in the AYA population has been noted in NCCN guidelines, particularly for cancers typically diagnosed at the upper end of the AYA age range.[22] The following sections describe possible adverse effects of cancer treatments on various organ systems that may be relevant for assessing noncancer mortality risk among AYAs with cancer.
Cardiovascular effects
11
Systemic antineoplastic agents, including chemotherapeutic agents and molecular targeted therapies, can adversely impact cardiovascular function through either direct effects on the heart itself or peripheral effects on hemodynamics (i.e. hypertension or thrombotic
events).[39] Metabolic abnormalities may also be an indirect effect of some systemic anticancer therapies, with a subsequent increase in risk for later cardiac events.[42] Anthracyclines, such as doxorubicin, epirubicin, and daunomycin, are the most common chemotherapeutic agents
associated with cardiotoxicity. These drugs are often used in the treatment of several AYA cancers, including breast cancer, sarcomas, lymphomas, and leukemias, and are thought to act through direct damage to cardiac myocytes, leading to possible left ventricular dysfunction,
Table 1.1 Cardiotoxicities associated with cancer therapies that may be used in AYA patients*
Class Drugs Cardiac toxicity Associated cancer types common in AYAs
Radiation --
Coronary artery disease, acute pericarditis,
myocarditis, CHF, valvular disease, conduction disease
Breast, cervix, colorectal, thyroid, leukemia, non-Hodgkin
lymphoma, Hodgkin lymphoma
Chemotherapy Anthracyclines Doxorubicin, epirubicin, idarubicin, Daunorubicin
Left ventricular dysfunction, CHF, pericarditis and/or myocarditis
Leukemia, breast, Hodgkin lymphoma, Non-Hodgkin lymphoma, thyroid, soft tissue and bone sarcomas
Taxanes Paclitaxel, Docetaxel Left ventricular dysfunction, cardiac ischemia, QT
prolongation, bradycardia Breast
Alkylating
Agents Cyclophosphamide, Ifosfamide, Cisplatin Left ventricular dysfunction, CHF, thrombosis
Leukemia, breast, Hodgkin lymphoma, Non-Hodgkin lymphoma, testicular, osteosarcoma, cervical
Antimetabolites Capecitabine, Fluorouracil, Cytarabine
Cardiac ischemia,
pericarditis, CHF Breast, colorectal, leukemia
Monoclonal Antibodies
Trastuzumab, Pertuzumab, Bevacizumab
Left ventricular dysfunction, CHF, arterial thrombosis, angina, myocardial infarction, hypertension
Breast, cervical, colorectal
Tyrosine kinase Inhibitors Lapatinib, Imatinib, Dasatinib, Nilotinib, Sorafenib, Sunitinib, Ponatinib
Left ventricular dysfunction, CHF, QT prolongation, cardiac ischemia, hypertension
Breast, leukemia
12
congestive heart failure, pericarditis, or myocarditis.[42] Acute cardiotoxicity following
anthracycline infusion is relatively rare (<1%) across age groups and is generally reversible.[39] Both early-onset (<1 year post-treatment) and late-onset (≥1 year post-treatment) chronic
progressive anthracycline-induced cardiotoxicity are more common (~2-5% of patients) and are usually irreversible. Higher doses, co-administration with other cardiotoxic agents, pre-existing cardiovascular disease (CVD), and female sex are among the risk factors for cardiotoxicities caused by anthracyclines.[43, 44] Risk is also greater with increasing age, especially over 65 years,[42] suggesting that studies of long-term cardiovascular outcomes among older adult patients may not adequately reflect the risk profile for individuals treated with anthracyclines as AYAs.
Cyclophosphamide, an alkylating chemotherapeutic agent often used in the treatment of leukemia and breast cancer, has also been associated with acute toxicities such as left ventricular dysfunction[39] and congestive heart failure.[42] Cisplatin, another alkylating agent, has been linked to acute myocardial ischemia and diastolic heart failure in adults,[45] as well as in younger patients treated for testicular cancer,[46] a cancer type most common in AYAs. Other chemotherapy drugs which may be used in AYA patients and have been associated with cardiotoxicities include taxanes (e.g. paclitaxel), antimetabolites (e.g. 5-fluorouracil), and tyrosine kinase inhibitors (e.g. imatinib), with effects ranging from arrhythmias and left
13
In addition to cardiovascular risk from systemic therapies, toxicities from chest radiation, often used to treat breast cancer or Hodgkin’s lymphoma, may include coronary artery disease, valvular disease, chronic pericardial disease, arrhythmias, cardiomyopathy, or carotid artery stenosis.[47, 48] Evidence also suggests a potential increased risk of stroke among those treated with radiation to the brain and/or neck.[48] Many of these effects may manifest long after treatment, with a latent period of up to 20 years until symptoms occur.[47] With modern
radiation techniques, the incidence of cardiotoxicities is lower than that observed among patients treated in earlier eras.[47]
Infectious complications
Infections in cancer patients are a major cause of morbidity and mortality, often resulting from multiple complex factors which interact to cause disease. These factors may include
treatment-induced immunosuppression, in addition to potential effects of the patient’s underlying immunodeficiencies and/or effects of the malignancy itself.[49-51] In patients with hematologic malignancies, the neoplasm can directly interfere with immune function as a consequence of its location within the immune system.[51] Similarly, in patients with solid malignancies, the location of the tumor itself may impede normal immune function, or may disrupt barriers that normally act to help prevent infection.[52]
14
53, 54] For patients with solid tumors receiving conventional chemotherapies, the risk of serious infectious complications is fairly low. However, hematologic cancer patients are generally considered to be at higher risk, due to treatment protocols which tend to induce more extreme and protracted neutropenia.[55] While immune system function recovers in most patients by 6-12 months after therapy, some may have infectious complications years later.[56-60] Those receiving allogenic hematopoietic stem cell transplantation are particularly at risk for infectious disease associated with chronic graft-versus-host disease and impaired immune
reconstitution.[61] However, some evidence suggests that other therapies, such as total body irradiation, may also be associated with late morbidity and mortality from infectious causes.[62] Renal effects
Several cancer therapies have been associated with renal impairment, increasing the risk of both acute toxicities and long-term dysfunction, and contributing to morbidity, reduced quality of life, and potentially even mortality. Adverse effects may include declines in glomerular
filtration rate, tubular dysfunction, albuminuria, and hypertension.[63] Renal failure, though rare, may also result from exposure to cancer treatments. Among the more common causes of
15
transplantation, methotrexate, anti-infective drugs, immunosuppressive drugs, radiation to the kidneys, or nephrectomy.[64]
Pulmonary effects
A number of studies have reported abnormal pulmonary function in children and adults with cancer, with effects observed acutely or several years after treatment completion. Lung injury following cancer treatment may involve the lung parenchyma, conducting airways, pleura, or pulmonary circulation,[64] depending on the treatment received. The most well-studied pulmonary effects are those induced by bleomycin, a chemotherapeutic agent, and mediastinal radiation. Bleomycin is often used to treat germ cell tumors and Hodgkin lymphoma, cancer types common in AYAs, and, depending on the patient population studied, the estimated incidence of bleomycin-induced pneumonitis is as high as 46%.[47] A minority of patients (<5%) may also develop pulmonary fibrosis following receipt of bleomycin, which may prove fatal in a small proportion of cases.[64] Mediastinal radiation may result in pneumonitis in patients treated for Hodgkin lymphoma or breast cancer, though it is less common in these patients than in those with lung cancer. Radiation-related pneumonitis usually occurs 1-3 months after completing therapy and is soon completely resolved, but in some cases it may develop into progressive pulmonary fibrosis at 6-24 months after treatment.[47] Patients with hematologic malignancies may also be subject to pulmonary complications following hematopoietic stem cell transplantation, with chronic dysfunction in the form of restrictive or obstructive lung
disease.[64]
Gastrointestinal and liver effects
16
treatment completion. However, others, such as diarrhea, can be severe enough to require hospitalization and, in some cases, may prove fatal.[67] In addition to acute effects, some therapies, particularly abdominal surgery and radiation, are also thought to have possible long-term consequences for the gastrointestinal tract and the liver,[67] ranging from constipation, which may adversely impact quality of life,[68] to more severe conditions such as liver cirrhosis, which may contribute to mortality.[69] These late effects, and the potential for excess mortality from gastrointestinal and liver diseases, have not been well-studied among cancer survivors diagnosed as AYAs.
2.2. Critical review of the literature
The following sections summarize studies that have investigated excess morbidity and/or mortality from noncancer conditions among AYA cancer survivors, highlighting gaps in the current evidence base on noncancer mortality risk in this population.
2.2.1. Cardiovascular outcomes
17
defined exclusively by clinical events, including myocardial infarction, congestive heart failure, and stroke. The excess risk was greatest among survivors of leukemia (IRR: 4.23; 95% CI: 1.73, 10.31) and breast cancer (IRR: 3.63; 95% CI: 2.41, 5.47). AYA cancer survivors also had a higher incidence of diabetes (IRR: 1.48; 95% CI: 1.31, 1.66) and dyslipidemia (IRR: 1.17; 95% CI: 1.08, 1.27), but not hypertension, than the comparison group. The number of events was insufficient to report cancer site-specific estimates for sites other than breast, lymphoma,
leukemia, melanoma, and thyroid, and relative risks for CVD-specific mortality for AYA cancer survivors versus the comparison group were not investigated.
Recent studies from Denmark have similarly documented higher rates of hospitalization for cardiovascular disease among AYA cancer survivors identified from the national cancer registry compared to age-matched controls selected from a national population registry.[71, 72] Rugbjerg et al. reported a rate ratio (RR) of 1.30 (95% CI: 1.28, 1.33) for first hospitalization for cardiovascular disease for AYA cancer survivors versus comparisons, which corresponded to an absolute excess risk (AER) of 400 and 350 extra cases per 100,000 person-years among
18
suggest that the risk of life-threatening cardiovascular conditions, such as those requiring hospitalization, is elevated among AYA cancer survivors relative to individuals without cancer.
In a study from Finland, Kero et al. compared rates of hospitalization for cardiovascular morbidities in five-year survivors of childhood and young adult cancers (diagnosed at ages 0-34 years) with those of siblings.[73] In general, magnitudes of association were greater for those diagnosed at ages 0-19 years than for those diagnosed at ages 20-34 years. However, hazard ratios in the 20-34 year age group for survivors compared to siblings were significantly elevated for cardiomyopathy/cardiac insufficiency (HR=3.6; 95% CI: 2.8-4.6), atherosclerosis/brain vascular thrombosis (HR=1.7; 95% CI: 1.4-2.0), myocardial infarction/cardiac ischemia (HR=1.8; 95% CI: 1.5-2.1), and cardiac arrhythmia (HR=1.4; 95% CI: 1.2, 1.7). Though
numbers were small within categories of cancer type, the excess of these outcomes seemed most pronounced among survivors of Hodgkin lymphoma, non-Hodgkin lymphoma, and testicular cancer. The differences in relative risk for those diagnosed at younger versus older ages in this study suggest the importance of quantifying long-term morbidity and mortality outcomes in AYA cancer survivors as a group distinct from childhood cancer survivors.
19
Though lacking general population rates for comparison, Keegan et al. recently reported rates of CVD, defined as hospitalization or death from cardiovascular conditions, among 2-year AYA cancer survivors in California.[75] Cancer types with the highest cumulative incidence of CVD at 10 years post-diagnosis included central nervous system tumors (7.30%), acute
lymphoid leukemia (6.85%), acute myeloid leukemia (6.84%), and non-Hodgkin lymphoma (4.12%). Other characteristics associated with higher CVD incidence included distant stage disease, receipt of chemotherapy or stem cell transplant, black race, low neighborhood
socioeconomic status, and having either public or no health insurance, suggesting disparities in CVD outcomes among patients with an AYA cancer history.
20
Hodgkin lymphoma (SMR=6.6; 95% CI: 4.8-8.9), though the number of observed deaths was too small to produce stable estimates within strata of most other cancer types.[77] Kero et al.
reported similar findings for excess cardiovascular disease deaths in another study of five-year childhood and AYA cancer survivors in Finland.[78] To our knowledge, no prior U.S.-based study has quantified the excess incidence of cardiovascular mortality among AYA survivors of all cancer types compared to the general population.
2.2.2. Infectious disease outcomes
21
2.2.3. Renal outcomes
A number of reports have documented renal effects in childhood cancer patients,[80-84] including an excess incidence of acute renal failure, chronic kidney disease, and other renal diseases.[82, 85] Studies investigating renal outcomes specifically among AYA cancer patients are less common, though patients ages 15-19 are often included in studies of late effects in childhood cancer. A study of renal and urinary outcomes in childhood cancer survivors in Nordic countries, which included patients with a maximum age at diagnosis of 19 years, found an
elevated rate of first hospitalization for any glomerular diseases, renal tubule-interstitial diseases, acute renal failure, and chronic kidney disease in one-year survivors relative to a matched
comparison group.[82] The magnitude of the rate ratio for any renal or urinary tract disease was the lowest, though still statistically significant, in the subgroup of patients aged 15 to 19 years at diagnosis (RR=2.1; 95% CI: 1.9-2.2). Cancer types associated with the greatest excess of
hospitalizations for acute renal failure and/or chronic kidney disease included leukemia,
lymphomas, malignant bone tumors, soft tissue sarcomas, and germ cell neoplasms, all cancers common in AYAs. Similarly, in a study using data from the Kaiser Permanente Southern California health plan, Chao et al. found a higher incidence of renal failure among childhood cancer survivors, with a maximum age at diagnosis of 18 years, than among age-matched
controls (IRR=13.7; 95% CI: 3.3-57.6).[85] However, renal failure was a relatively rare outcome overall, with an incidence of only 1.3 per 1000 person-years in the cancer survivor group. The most common cancer types among patients included in this study were leukemia and
lymphomas.
22
reported a modestly elevated rate among five-year survivors in Denmark compared to matched controls (RR=1.28; 95% CI: 1.25-1.31), which was somewhat higher among men than among women. Among five-year AYA survivors diagnosed at ages 20-24 years in British Columbia, Zhang et al. also found an excess of hospitalization for genitourinary diseases relative to a matched comparison group (RR=1.34; 95% CI: 1.09-1.63).[74] The extent to which these estimates reflect hospitalization for kidney diseases, as opposed to other urinary tract conditions, is unclear, as is the extent to which estimates may have been influenced by bias due to increased surveillance among cancer survivors. However, taken together with reports from studies of childhood cancer survivors, these findings suggest that renal late effects severe enough to require hospitalization may be an important contributor to excess morbidity and mortality among AYA cancer survivors.
2.2.4. Pulmonary outcomes
In the study by Rugbjerg et al. from Denmark, rates of hospitalization for diseases of the respiratory system were significantly elevated among five-year AYA cancer survivors compared to a matched comparison group (RR=1.47; 95% CI: 1.43, 1.52).[71] The excess of
hospitalizations for respiratory causes was most pronounced among survivors diagnosed with leukemia (RR=4.9; 95% CI: 4.0-6.0). Likewise, Zhang et al. reported a rate ratio of 1.71 (95% CI: 1.26, 2.31) for hospitalization for respiratory diseases for AYAs diagnosed at ages 20-24 in British Columbia relative to a matched noncancer cohort.[74]
person-23
years of follow-up, with 13 of these occurring among patients diagnosed at ages 20-34.[77] This corresponded to an SMR of 2.3 (95% CI: 1.3-3.8) overall, and 2.4 (95% CI: 1.3-4.1) in the 20-34 year age group. The number of deaths was insufficient to produce stable estimates within strata defined by cancer type. A second report from Finland, with more recent years of follow-up, also found excess mortality from respiratory diseases among AYAs diagnosed at ages 20-34
(SMR=1.7; 95% CI: 1.1-2.4).[78] Site-specific analyses were performed for central nervous system (CNS) tumors (SMR=5.5), Hodgkin lymphoma (SMR=6.6), and Non-Hodgkin
lymphoma (SMR=5.0), though the numbers of observed deaths in each group were only 6, 10, and 4, respectively, and estimates were imprecise.
Though limited by small sample sizes, these studies from Finland suggest that the excess of deaths from respiratory causes may be smaller in AYA cancer survivors than in childhood cancer survivors. In the U.S.-based Childhood Cancer Survivor Study, for example, Mertens et al. reported an SMR of 8.8 (95% CI: 6.8, 11.2) for deaths from pulmonary causes.[86] For those with diagnoses of Hodgkin or Non-Hodgkin lymphoma, SMRs were 10.8 and 9.1, respectively. To our knowledge, no study has evaluated SMRs for respiratory causes among AYA cancer survivors in the U.S., which may differ from Finland in background cause-specific mortality rates. Differences in respiratory mortality according to factors such as time since diagnosis have also not been examined.
2.2.5. Gastrointestinal and liver outcomes
Studies of childhood cancer survivors, with patients as old as 19 or 20 years at diagnosis, have demonstrated an increased occurrence of gastrointestinal and liver conditions, or
24
examined self-reported conditions of the liver and upper and lower gastrointestinal tract, and found that more than 40% of childhood cancer survivors had experienced one or more of these complications by 20 years after cancer treatment.[87] Though relatively uncommon overall, the rate of liver cirrhosis, beginning at 5 years post-diagnosis, was nearly 9 times as high in
survivors as in cancer-free siblings (RR=8.9; 95% CI: 2.0-40.0). Rates of ulcers, esophageal disease, gallstones, intestinal polyps/diverticular disease, and colostomy/ileostomy were also significantly elevated among survivors. Abdominal radiation and surgery were associated with late-onset complications, as were high-dose alkylating agents and anthracyclines. Unexpectedly, older age at diagnosis (10+ years) was also a significant predictor of complications.
25
Morbidity and mortality from gastrointestinal and liver diseases have not been well-characterized among young adults with cancer. Rugbjerg et al. reported an increased rate of hospitalization for diseases of the digestive organs (RR=1.39; 95% CI: 1.35, 1.42) in five-year AYA cancer survivors compared to sex- and age-matched controls in Denmark.[71] Likewise, Zhang et al. found a modestly elevated rate of hospitalization for any digestive conditions among five-year AYAs survivors (diagnosed at ages 20-24) in British Columbia relative to a matched comparison group (RR=1.29; 95% CI: 1.07-1.56).[74] To date, mortality from gastrointestinal conditions such as liver disease and cirrhosis or ulcers has not been specifically examined in AYA cancer survivors compared to the general population.
2.2.6. Mortality disparities among AYAs with cancer by race and socioeconomic status
Studies of potential disparities among AYA cancer patients have generally restricted their analyses to cancer-specific and overall survival, with little investigation into deaths from specific noncancer causes. Notably, almost all prior AYA-specific studies of race- and socioeconomic status-related disparities have exclusively used data on patients diagnosed in California. In a report using data from the California Cancer Registry, DeRouen et al. examined overall survival among all AYAs diagnosed with a first invasive cancer from 2001-2011.[89] Independent of age, neighborhood socioeconomic status, and insurance status, Black AYAs with breast cancer, testicular cancer, Hodgkin lymphoma, leukemia, and cervical cancer experienced poorer overall survival than white AYAs with the same cancer type. Being in the lowest quintile of
26
Others have investigated survival disparities in studies focused on specific cancer types. Among AYAs diagnosed with Hodgkin lymphoma in California from 1988-2011, Keegan et al. reported significantly lower overall survival for Black patients compared to white patients (HR=1.40; 95% CI: 1.14-1.71), with slightly greater than half of all deaths in both groups due to Hodgkin lymphoma.[90] Likewise, AYAs in the lowest, compared to the highest, quintile of neighborhood socioeconomic status, had an HR or 1.88 (95% CI: 1.53-2.30) for death from all causes. These associations largely persisted in analyses stratified by disease stage. In a separate report, Keegan et al. examined disparities in survival among AYAs diagnosed with differentiated (papillary or follicular) thyroid cancer in California between 1988 and 2010.[91] While
27
Despite the overall paucity of research addressing disparities in noncancer mortality among AYAs, there is some evidence to suggest that, among U.S. childhood and AYA cancer survivors, mortality from cardiovascular disease may differ significantly according to race. Berkman et al. identified cases diagnosed from 1973 to 2011 at ages 0-34 years in the SEER registries, and estimated hazard ratios (HR) for death from cardiovascular causes for blacks compared to whites.[95] For all cancers types combined, the HR for cardiovascular disease death was 2.13 (95% CI: 1.85, 2.46), though this varied somewhat by cancer type. In the subgroup of those aged 15-34 years at diagnosis, the magnitude of this association was smaller and non-significant, though imprecise (HR=1.33; 95% CI: 0.60, 2.95). Individuals diagnosed at ages 35-39 were not included, and estimates of race-specific incidence of cardiovascular disease
mortality were not reported. 2.3. Summary of literature review
28
29
CHAPTER 3. AIMS
Each year, more than 70,000 adolescents and young adults (AYAs) ages 15-39 are diagnosed with cancer in the United States. Over the past three decades, 5-year relative survival among AYAs has steadily increased, and currently stands at over 80% for all sites combined.[2] These gains are largely attributable to advances in cancer treatments, which, while extending survival from the original cancer diagnosis, may also contribute to future morbidity and mortality from noncancer causes.
30
cancers, particularly for those typically diagnosed at the upper end of the AYA age range (e.g. breast cancer).[22]
This research investigated mortality from noncancer causes among AYA cancer patients diagnosed during 1973-2015 and included in the Surveillance, Epidemiology, and End Results (SEER) database. Noncancer causes of deaths in SEER were ascertained from death certificates and categorized into 25 groups, which included, among others, diseases of the heart,
cerebrovascular disease, suicide and self-inflicted injury, pneumonia and influenza, and other infectious and parasitic diseases. The specific aims were:
Aim 1: To examine mortality from noncancer causes among AYA cancer patients
compared to the general population. We estimated SMRs for all noncancer causes combined and for cause-specific categories, both overall and in subgroups defined by cancer type, stage, age at diagnosis and time since diagnosis.
We hypothesized that noncancer mortality would be significantly elevated among AYA patients, particularly for infectious disease mortality and cardiovascular disease mortality.
Aim 2: To examine characteristics associated with noncancer mortality within the AYA
31
32
CHAPTER 4. METHODS
4.1. Data source
The Surveillance, Epidemiology, and End Results (SEER) program, funded by the
National Cancer Institute (NCI) since 1973, is a system of population-based cancer registries that collects and publishes data on cancer incidence and survival in the U.S. Since the 1970’s, the SEER program has expanded from its original 9 registries (SEER 9) to the 20 registries included today (SEER 18). These registries are located strategically across the country and cover
approximately 35% of the total U.S. population. SEER areas are demographically representative of the entire U.S., and include 32% of whites, 30% of African Americans, 44% of Hispanics, 49% of American Indian/Alaska Natives, 57% of Asians, and 69% of Native Hawaiian/Pacific Islanders.[98]
33
4.2. Aim 1
4.2.1. Study population
For Aim 1 analyses, we used SEER*Stat (version 8.3.5)[100] to identify all patients in the SEER 9 database with a first primary malignancy diagnosed at ages 15 to 39 years between January 1, 1973 and December 31, 2015. We selected only cases with a known patient age and a neoplasm with malignant behavior. Death certificate and autopsy only cases were excluded, as were those for whom the state death certificate was not available, or was available but did not have cause of death information. We also excluded patients with Kaposi sarcoma because high rates of infectious disease mortality associated with this cancer type were expected to inflate overall estimates of noncancer mortality among AYAs with cancer relative to the general population. Because general population mortality rates are not produced for individuals of unknown race, AYA cancer patients with unknown race (~1% of all patients[101]) were excluded for analyses in Aim 1.
4.2.2. Key variables
SEER defines variables for the major cancer site groups using the International
34
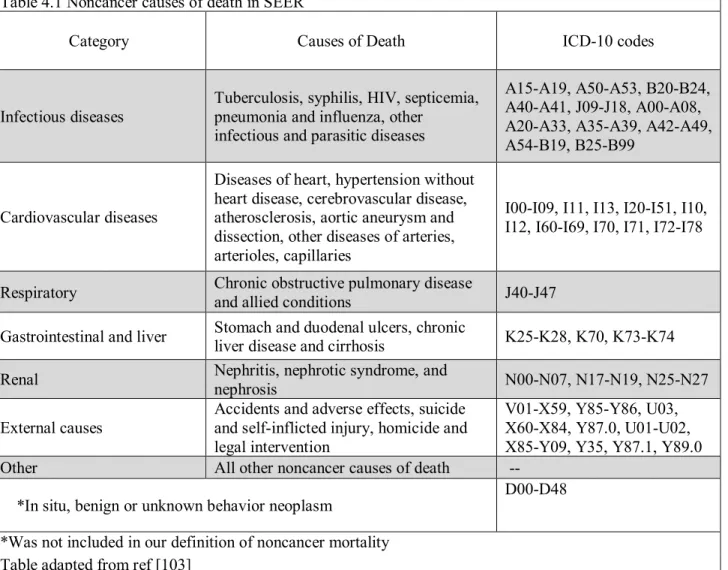
Cause of death information in SEER is ascertained from death certificates. Using ICD versions 8-10 (depending on the year of death), SEER defines noncancer causes of death using 25 categories (Table 4.1; Appendix 2).[103] These categories have been consistently defined over time and include, ‘Diseases of the Heart,’ ‘Septicemia,’ ‘Pneumonia and Influenza,’ and ‘Suicide and Self-Inflicted Injury,’ and other noncancer causes listed among the leading causes of death in the U.S.[104] SEER also defines deaths from in situ, benign, or unknown behavior neoplasms as a separate category of noncancer deaths.[103] However, for our analyses in Aims 1 and 2, we did not include these deaths in our definition of ‘all noncancer deaths.’
Table 4.1 Noncancer causes of death in SEER
Category Causes of Death ICD-10 codes
Infectious diseases Tuberculosis, syphilis, HIV, septicemia, pneumonia and influenza, other infectious and parasitic diseases
A15-A19, A50-A53, B20-B24, A40-A41, J09-J18, A00-A08, A20-A33, A35-A39, A42-A49, A54-B19, B25-B99
Cardiovascular diseases
Diseases of heart, hypertension without heart disease, cerebrovascular disease, atherosclerosis, aortic aneurysm and dissection, other diseases of arteries, arterioles, capillaries
I00-I09, I11, I13, I20-I51, I10, I12, I60-I69, I70, I71, I72-I78
Respiratory Chronic obstructive pulmonary disease and allied conditions J40-J47
Gastrointestinal and liver Stomach and duodenal ulcers, chronic liver disease and cirrhosis K25-K28, K70, K73-K74
Renal Nephritis, nephrotic syndrome, and nephrosis N00-N07, N17-N19, N25-N27
External causes Accidents and adverse effects, suicide and self-inflicted injury, homicide and legal intervention
V01-X59, Y85-Y86, U03, X60-X84, Y87.0, U01-U02, X85-Y09, Y35, Y87.1, Y89.0 Other All other noncancer causes of death --
*In situ, benign or unknown behavior neoplasm D00-D48 *Was not included in our definition of noncancer mortality
35
4.2.3. Statistical analysis
All analyses in Aim 1 were conducted using SEER*Stat.[100] For noncancer causes of death available in SEER, we estimated standardized mortality ratios (SMR) comparing the number of observed deaths among AYAs with cancer to that expected in the general population with the same distribution of age, sex, and race over the same time period. General population mortality rates available in SEER were obtained from the Centers for Disease Control and Prevention’s National Center for Health Statistics. Within SEER*Stat, the number of expected deaths was calculated as the product of the general population mortality rate for each cause of death and the person-time at risk in the AYA cancer patient sample. For all calculations, we allowed a 2-month latency exclusion period. This was the default setting in SEER*Stat and represented the number of months after cancer diagnosis during which person-time at-risk and potential events of interest were ignored. Thus person-time was accrued from two months after the date of cancer diagnosis until death, the date of last contact, or December 2015, whichever occurred first. The 95% confidence intervals for SMRs were estimated using exact methods. We also reported absolute excess risks (AER), calculated as the difference between the observed and expected deaths, divided by the total person-years of observation. These were multiplied by 10,000 to yield the number of excess deaths per 10,000 person-years. SMRs and AERs were estimated for all noncancer causes of death combined, for each of the 25 individual noncancer causes of death, and for cause-specific categories defined as infectious, cardiovascular,
respiratory, gastrointestinal and liver, renal, external, and other causes, as shown in abbreviated form in Table 4.1, and in full in Appendix 2.
36
<10 years, 10-<20 years, 20+ years). For the 12 most common cancer types (Table 4.2), we also conducted site-specific analyses, according to age at diagnosis, cancer stage, and time since diagnosis. Stage was categorized using Ann Arbor staging (I, II, III, IV; diagnosis years 1983+) for lymphomas and SEER Historic Stage A (localized, regional, distant) for most other
malignancies. Analyses according to stage could not be performed for leukemias and central nervous system tumors due to lack of a consistently defined stage variable over the entirety of the study period.
In sensitivity analyses, we considered latency exclusion periods of 0 months (i.e. person-time begins at diagnosis) or 6 months, to assess the sensitivity of results to varying the start of follow-up for noncancer deaths. We also
conducted sensitivity analyses to assess the potential influence of varying degrees of cause of death misclassification on SMR estimates. For example, for all noncancer deaths combined, we re-estimated SMRs assuming that 10% (or 20% or 30%) of observed deaths were actually attributable to cancer, but were misclassified as noncancer deaths.
4.3. Aim 2
4.3.1. Study population
In Aim 2, we used SEER*Stat to identify all patients in the SEER 18 registries with a first primary cancer at ages 15-39 years during 1985-2015, selecting only those with a known
Table 4.2 Cancers examined in site-specific analyses, defined using AYA Site Recode/WHO 2008
Leukemias
Non-Hodgkin lymphoma Hodgkin lymphoma
Central nervous system tumors Soft tissue sarcomas*
Melanoma Thyroid carcinoma
Other head and neck carcinomas Breast carcinoma
Cervical/uterine carcinomas Colorectal carcinomas Testicular cancer** *Excludes Kaposi sarcoma
37
patient age and a neoplasm with malignant behavior. Patients diagnosed prior to 1985 were excluded to facilitate analyses of county-level socioeconomic characteristics, which were only reported for selected years (see section 4.3.2). As in Aim 1, we excluded patients with Kaposi sarcoma, unknown race, death certificate and autopsy only cases, and those for whom the state death certificate was not available, or was available but did not have cause of death information. 4.3.2. Key variables
Person-time of follow-up for each patient was calculated from the date of diagnosis to either the date of last contact or the date of death in the SEER database. This variable is recorded in SEER in months, rather than days, due to confidentiality issues regarding the reporting of days in some U.S. registries.
SEER registries do not collect individual-level information on education, income, or other socioeconomic characteristics. However, county-level information, based on data from the U.S. Census Bureau,[105, 106] is linked to patient data by state-county Federal Information Processing Standards (FIPS) codes and is available in the SEER database. For our analyses, we focused on two county attributes: percent of persons below poverty and percent of persons with less than a high school education. In SEER, these variables are currently defined from the decennial census for the years 1990 and 2000,[106] and from the American Community Survey (ACS) for the years 2007-2015.[107] The ACS is conducted each year by U.S. Census Bureau, and five-year estimates for demographic and social characteristics for U.S. counties are
38
using 1990 cut points for patients diagnosed during 1985-1994, using 2000 cut points for patients diagnosed during 1995-2004, and using 2008-2012 cut points for patients diagnosed during 2005-2015.
We also performed analyses according to the county’s rural-urban continuum code, a classification scheme which was developed by the U.S. Department of Agriculture[108] and is also linked to
patient data within the SEER database. These variables have been defined for each county for the years 1974, 1983, 1993, 2003, and 2013. For our
analyses, we used rural-urban designations for the years 2003 and 2013. Although coding schemes are available for earlier years, as listed above, they are not fully comparable with those of 2003 and 2013, due to changes in the definitions of metro vs nonmetro areas,[108] and cannot be used together in the same analysis. Therefore analyses according to rural-urban continuum were restricted to patients diagnosed in 1998 and later, so that a maximum of 5 years was allowed between cancer diagnosis and the year for which the rural-urban continuum code was defined. We used the rural-urban continuum variable from 2003 for patients diagnosed during 1998-2007, and from 2013 for patients diagnosed during 2008-2015. The 2003 and 2013 coding schemes assign counties to one of nine categories, which range from metro counties with a
Table 4.3 Rural-Urban Continuum Code Definitions for 2003 and 2013
Code Description for analysis Category
1 Counties in metro areas of 1 million or more
Metro 2 Counties in metro areas of 250,000 to 1 million
3 Counties in metro areas of fewer than 250,000
4 Urban population of 20,000 or more, adjacent to metro area
Urban 5 Urban population of 20,000 or more, not adjacent to metro area
6 Urban population of 2,500 to 19,999, adjacent to metro area 7 Urban population of 2,500 to 19,999, not adjacent to metro area
Rural 8 Completely rural or less than 2,500 urban population, adjacent to metro area
9 Completely rural or less than 2,500 urban population, not adjacent to metro area
39
population of one million or more, to nonmetro counties that are not adjacent to a metro area and have a population of less than 2,500.[108] We redefined categories as metro, urban, and rural, a recategorization scheme which has been used in previous SEER analyses (Table 4.3).[109]
Disparities were also evaluated according to geographic region. We categorized SEER registries into West, South, Northeast, and Midwest, as shown in Table 4.4.[110] Due to small numbers of patients in the Alaska Native and Hawaii registries, we excluded these registries from analyses according to region.
4.3.3. Statistical analysis
All analyses in Aim 2 were stratified by sex to accommodate adjustment for cancer type, including male-only and female-only cancers as separate categories, in statistical models. Cause-specific hazard ratios for all noncancer deaths, cardiovascular disease deaths, and infectious disease deaths (see Appendix 2) according to race, county-level socioeconomic characteristics, rural-urban continuum, and geographic region were estimated using Cox proportional hazards regression models. For individuals with 0 months of survival, we assigned a survival time of 0.5 months for consistency with previous literature.[111] The proportional hazards assumption was assessed through visual inspection of plots of the survival function versus time, and the log(-log(survival)) versus log(time). Multivariable models accounted for age at diagnosis, cancer type, year of diagnosis, and race, covariates that were determined a priori and are available
Table 4.4. Geographic regions defined using SEER registries
Region SEER registries
West San-Francisco-Oakland; San-Jose Monterey; Los Angeles; Greater California; New Mexico; Seattle/Puget Sound; Utah
South Atlanta; Rural Georgia; Greater Georgia; Kentucky; Louisiana Northeast Connecticut; New Jersey
40
41
CHAPTER 5. NONCANCER MORTALITY AMONG ADOLESCENTS AND YOUNG ADULTS WITH CANCER
5.1 Background
Each year, more than 70,000 adolescents and young adults (AYAs, ages 15-39 years) are diagnosed with cancer in the U.S.[113] Though a heterogeneous group, AYAs with cancer have been increasingly recognized as a distinct patient subpopulation, differing from childhood and older adult cancer patients in cancer type distribution, underlying disease biology, and treatment protocols.[5] Despite the unique characteristics associated with cancers in this age group, few studies have examined long-term health outcomes among patients diagnosed as AYAs.
Five-year relative survival among AYAs with cancer has steadily increased over the past few decades, and currently stands at >80% for all invasive cancers combined.[8] Among patients diagnosed at young ages, improvements in survival are largely attributable to recent advances in cancer treatments, which, while preventing death from the primary cancer, may increase risk of future morbidity and mortality from noncancer causes. The cardiotoxic and/or
42
beyond diagnosis,[114] but the extent to which deaths from causes other than cancer may contribute has rarely been examined.[76-78]
The objective of this study was to compare rates of mortality from noncancer causes among AYA cancer patients with those in the general U.S. population using nationally representative cancer registry data.
5.2 Methods 5.2.1 Data source
We identified AYA patients using data from the Surveillance, Epidemiology, and End Results (SEER) program,[98] a system of population-based cancer registries that collects and reports data on cancer incidence and survival in the U.S. Patient information collected by SEER includes demographic information, primary tumor site and morphology, stage, and first course of treatment. SEER also conducts active follow-up for patient vital status and reports the number of months survived since cancer diagnosis and the cause of death as ascertained from death
certificates. U.S. general population mortality rates from the National Center for Health Statistics are accessible through the SEER program.
5.2.2 Study population
43
association with HIV infection,[116] and the likelihood of high infectious disease mortality rates within this group. We categorized cancer type using an AYA-specific recode of International Classification of Diseases for Oncology 3rd Edition (ICD-O-3) primary site and histology codes.[117]
5.2.3 Noncancer causes of death
SEER recodes ICD 8-10 codes from death certificates and categorizes deaths from noncancer causes in 26 major groups.[103] These groups have been defined consistently over time and include many of the leading causes of death in the U.S., such as ‘Diseases of the Heart,’ ‘Pneumonia and Influenza,’ and ‘Suicide and Self-Inflicted Injury.” We further consolidated these groups into 7 broad categories of infectious diseases, cardiovascular diseases (CVD), respiratory diseases, gastrointestinal and liver diseases, renal diseases, external causes, and other causes, as shown in Appendix 2. Although SEER also includes deaths from ‘In situ, benign or unknown behavior neoplasm’ among its 26 groups of noncancer deaths,[103] we did not consider these deaths as noncancer deaths for our analyses.
5.2.4 Statistical analysis
We estimated standardized mortality ratios (SMRs) as the number of observed deaths from noncancer causes among AYAs with cancer divided by the number expected in the general population with the same distribution of age, sex, race, and calendar year. The number of
44
whichever occurred first. Exact methods were used to calculate 95% confidence intervals (CI) for all SMRs. We also estimated absolute excess risks (AER), calculated as the difference between observed and expected noncancer deaths, divided by the total person-years of observation, and reported as the number of excess deaths per 10,000 person-years.
In subgroup analyses, SMRs were estimated according to cancer type, age at diagnosis, and time since diagnosis. For selected cancers, we also performed cancer type-specific analyses, and estimated SMRs according to age at diagnosis, time since diagnosis and disease stage. Ann Arbor staging was used for lymphomas (diagnosed in 1983 and later), and SEER Historic Stage A, a summary staging measure, was used for most other cancer types.[118] We did not conduct analyses according to stage for central nervous system (CNS) tumors or leukemias, due to lack of a consistently defined stage variable across the study period in SEER. We also re-estimated SMRs excluding patients with non-Hodgkin lymphoma (NHL), to further reduce the influence of HIV-related deaths on estimates among all AYAs with cancer combined. All analyses were performed using SEER*Stat, version 8.3.5.[119]
In sensitivity analyses, we considered latency exclusion periods of 0 and 6 months, rather than 2 months, for estimation of SMRs among AYAs of all cancer types combined. We also conducted a sensitivity analysis to assess the potential influence of cause of death
misclassification on SMR estimates. This was done by re-estimating SMRs under the assumption that a specified proportion (10%, 20%, or 30%) of observed noncancer deaths from a particular cause had been misattributed.
5.3 Results
45
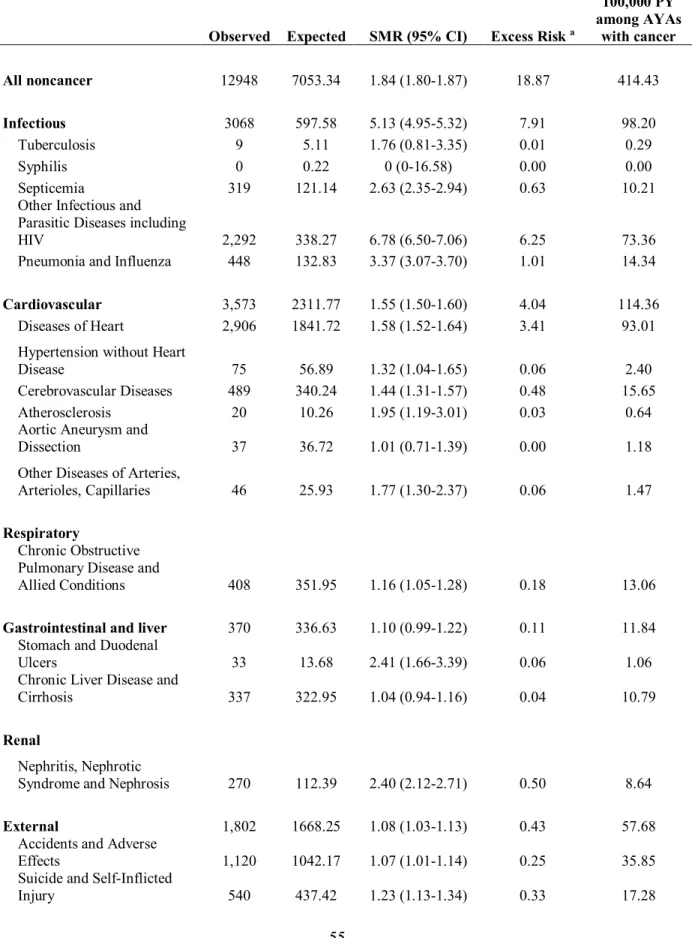
follow-up (Table 5.1). The majority of included AYAs were female (60%), diagnosed at ages 30-39 years (65%), and diagnosed between 1993 and 2015 (60%). Overall, noncancer mortality among AYA cancer survivors was 1.84 (95% CI: 1.80-1.87) times that in the general U.S. population, reflecting an excess of approximately 19 noncancer deaths per 10,000 person-years among survivors (Table 5.2). SMRs were particularly elevated for the cause-specific categories of infectious diseases (SMR=5.13; 95% CI: 4.95-5.32), cardiovascular diseases (SMR=1.55; 95% CI: 1.50-1.60), renal diseases (SMR=2.40; 95% CI: 2.12-2.71), and other causes
(SMR=2.06; 95% CI: 2.00-2.13), but were also weakly elevated for respiratory diseases (SMR= 1.16; 95% CI: 1.05-1.28) and external causes (SMR= 1.08; 95% CI: 1.03-1.13). When AYAs with NHL (N=14,209 patients, N=2,212 noncancer deaths) were excluded, SMRs for all noncancer deaths (SMR=1.60) and infectious disease deaths (SMR=2.74) were attenuated but still elevated among AYA cancer survivors. SMRs for other broad cause of death categories were not substantially changed when NHL patients were excluded (data not shown).
5.3.1 All noncancer mortality
46
be higher among AYAs with a more advanced disease stage, but were significantly elevated even for those with localized disease for soft tissue sarcomas, head and neck cancers, cervical/uterine cancers, and colon and rectal cancers, and for those with stage I HL or NHL (Table 5.5). 5.3.2 Cardiovascular disease mortality
The highest SMRs for cardiovascular disease mortality were observed for AYAs with HL (SMR=4.44), CNS tumors (SMR=3.32), and leukemias (SMR=3.06), followed by those with NHL (SMR=2.05), cervical/uterine cancers (SMR=1.83), and head and neck cancers
(SMR=1.80). SMRs were also significantly elevated for those with breast cancer (SMR=1.38) and colon and rectal cancers (SMR=1.35) (Table 5.3). There was a clear trend of decreasing SMRs with increasing age at diagnosis overall (Table 5.3), and among AYAs with NHL, HL, and breast cancer (Table 5.9). SMRs for cardiovascular diseases also decreased with increasing time since diagnosis for most cancer types, although an increase at 10+ years post-diagnosis was apparent for AYAs with HL and CNS tumors (Table 5.7).
5.3.3 Infectious disease mortality


![Synthesis, characterization and antimicrobial activities of [Fe(II), Co(II), Ni(II),Cu(II) and Zn(II)] mixed ligand complexes schiff base derived from amoxicillin drug and 4 (dimethylamino)benzaldehyde with nicotinamide](data:image/gif;base64,R0lGODlhAQABAIAAAP///wAAACH5BAEAAAAALAAAAAABAAEAAAICRAEAOw==)