i
CLINICAL DECISION-MAKING AND PEDIATRIC BIPOLAR DISORDER
Melissa M. Jenkins
A thesis submitted to the faculty of the University of North Carolina at Chapel Hill in partial fulfillment of the requirements for the degree of Master of Arts in the Department of
Psychology (Clinical Psychology).
Chapel Hill 2009
Approved by:
Eric A. Youngstrom, PhD Enrique W. Neblett, Jr., PhD
ii
ABSTRACT
MELISSA M. JENKINS: Clinical Decision-Making and Pediatric Bipolar Disorder (Under the direction of Eric A. Youngstrom, PhD)
Clinical decision-making in mental health could greatly benefit from evidence-based decision tools, particularly in diagnosing challenging, high-stakes conditions such as
pediatric bipolar disorder. The current literature indicates that clinicians are prone to a host of cognitive biases that impede optimal diagnostic and treatment decisions. These biases are especially salient in the assessment of bipolar illness. Bipolar disorder is frequently misdiagnosed, and recent evidence suggests that mental health professionals often
overdiagnose bipolar in youths. Although actuarial approaches have taken root in the medical community to assess the likelihood of various conditions, the mental health field has not widely disseminated or implemented such strategies. In fact, little research has attempted to validate the clinical utility of actuarial assessment methods. This study examines the
effectiveness of an actuarial approach in diagnosing pediatric bipolar disorder by comparing Bayesian estimates (i.e., actuarial approach) to the current gold standard in clinical
iii
TABLE OF CONTENTS
LIST OF TABLES... v
LIST OF FIGURES ... vi
CLINICAL DECISION-MAKING AND PEDIATRIC BIPOLAR DISORDER…...1
Decision-Making in Mental Health...4
Assessment of Pediatric Bipolar Disorder...6
Gold Standard for Clinical Assessment……….………8
Bipolar Phenotypes……….…...9
Actuarial Decision-Making: The Nomogram……..………12
Threshold Model………..……17
The Parent General Behavior Inventory (PGBI)………...………..20
Limitations of the Nomogram………...……….……..…21
Significance and Broader Impact……...……….…22
Hypotheses………...………24
Methods.………..………..……….……25
Procedure……..………...25
Clinical Assessment………..………...25
Actuarial Assessment………...26
Prevalence……...……….………....26
iv
Participants……...………...……….……….………..28
Measures Administered………….……….…………...30
Reference Standard: Semistructured Diagnostic Interview Using the Schedule of Affective Disorders and Schizophrenia for Children ……….…....30
The Parent General Behavior Inventory (PGBI) ……...…...31
Mini International Neuropsychiatric Interview (MI………....31
Results…..………..………...…...………35
Power Analysis.………..………….………..35
Descriptives and Missing Data……….………36
Agreement between Clinician Confidence and the Nomogram…...……….38
. Agreement about Next Clinical Action……….……….…38
Relationship between Clinician Confidence and Type of Bipolar..…….…..39
Potential Moderators of Agreement between Clinician Confidence and Nomogram…………...…....………....40
Generalizability of Nomogram Approach……….…...……….…………....40
Discussion………..………42
Current Literature…….……….………42
Present Study…...……….……….42
Study Findings………..…….43
Limitations………..………...47
Future Directions.……….………51
APPENDICES ...,...67
v
LIST OF TABLES
Table
1. Glossary of Terms.………...………...54
2. Errors in Decision-Making………...55
3. Participant Demographic and Diagnostic Characteristics...56
4. DLRs Associated with Test Scores on the PGBI (28-item)...57
5. Family Risk Status………...………...58
6. DLRs Assigned for MINI Diagnosis by Type of Relative...59
7. Variable Descriptives...60
8. Agreement between Clinical and Actuarial Approaches (kappa = .21, p < .0005)...61
vi
LIST OF FIGURES
FIGURE
1. Agreement between Clinician Confidence and the Nomogram...63 2. Clinician Confidence and Actuarial Estimates by Type of Bipolar...64 3. Diagnosis as Moderator of Agreement between Nomogram
and Clinical Confidence…...……...65 4. Correlation between Bayesian risk estimates and logistic
vii
LIST OF ABBREVIATIONS
BP-I Bipolar I Disorder BP-II Bipolar II Disorder
BP-NOS Bipolar Disorder Not Otherwise Specified
DSM Diagnostic and Statistical Manual of Mental Disorders
KSADS Schedule of Affective Disorders and Schizophrenia for Children LEAD Longitudinal Expert All Data
MH Mental Health
1
CLINICAL DECISION-MAKING AND PEDIATRIC BIPOLAR DISORDER Decision-making algorithms can facilitate more timely, accurate, and effective decisions and can be applied to a number of situations, including inference, choice, group deliberations, and moral issues (Jenkins, Youngstrom, Youngstrom, & Algorta, 2008; Todd & Gigerenzer, 2007). Unfortunately, humans typically do not use purely rational or
2
Clinical assessment is a major professional role largely unique to psychologists in the MH field (Krishnamurthy et al., 2004). Test interpretation is typically done using clinical judgment instead of actuarial approaches (Dawes, Faust, & Meehl, 1989; Meehl, 1954), which apply mathematical and statistical methods to assess risk. This finding is disconcerting for a number of reasons. First, there is poor agreement between clinical judgment and
actuarial judgment (Dawes et al., 1989). Second, clinical judgment has been shown to suffer from cognitive biases and errors that can reduce accuracy in decision-making (Galanter & Patel, 2005; Youngstrom & Kogos Youngstrom, 2005). Third, research has shown that the validity of clinical judgment and the amount of clinical experience are unrelated (Lueger, 2002). In short, research indicates a tendency for clinical judgment to derail accurate decision-making, and this derailment does not self-correct with additional clinical experience.
3
diagnosis (Marchand, Wirth, & Simon, 2006). Misdiagnosis and treatment delays can have harmful, if not life threatening, consequences for individuals with bipolar disorder, thus, intensifying the need for accurate and efficient decision-making for cases with bipolar.
Despite the potential for substantial improvement in assessment practices, to date almost no research has examined how actuarial decision-making performs in comparison to psychiatric assessments of real-world clients. More concretely, we do not know if actuarial risk estimates gel with diagnostic estimates generated from more sophisticated assessment methods, such as semi-structured approaches like the Kiddie-Schedule for Affective Disorders and Schizophrenia (KSADS) (Kaufman et al., 1997), above and beyond routine clinical judgment. Moreover, it remains unclear if different clinical presentations of
psychiatric disorders affect the level of agreement between actuarial and clinical assessment methods. For example, there are narrow phenotypic versus more heterogeneous presentations of PBD (Leibenluft, Charney, Towbin, Bhangoo, & Pine, 2003); and it is uncertain if these related yet distinct clinical presentations influence or limit the precision of actuarial
approaches. This consideration is highly relevant given that clinical assessment instruments have been shown to vary in sensitivity and specificity for different bipolar presentations. Specifically, in assessing the validity of the Mood Disorder Questionnaire (MDQ), Miller and others (2004) found that although the MDQ shows good sensitivity in bipolar I (BP-I) cases, it demonstrates less sensitivity in cases of other bipolar spectrum disorders such as bipolar II II), cyclothymic disorder, and bipolar disorder not otherwise specified (BP-NOS).
4
approach, the nomogram, in estimating the risk of a complex, frequently misdiagnosed mental disorder, bipolar illness. The overarching goal of this project is to examine how the nomogram performs in comparison to the current gold standard clinical assessment of PBD. Specific aims include better understanding: (1) the agreement between PBD research
diagnoses and actuarial risk estimates based on the combination of family history and test score on the Parent General Behavior Inventory (Youngstrom, Findling, Danielson, & Calabrese, 2001); (2) the agreement between “Longitudinal Expert evaluation of All Data” (LEAD) (Spitzer, 1983) confidence ratings and Bayesian estimates when an EB assessment intervention threshold model is applied; (3) the relationship between clinician confidence in bipolar diagnoses and the type of bipolar spectrum illness; (4) the role of bipolar type in the agreement between PBD research diagnoses and actuarial risk estimates; and, (5) the correlation between Bayesian risk estimates using independent, published diagnostic likelihood ratios and logistic regression estimates of the probability of having a bipolar diagnosis using optimal weights for the sample (generalizability).
Decision-Making in Mental Health
5
but many interviews have been shown to be unreliable (Piacentini et al., 1993). Assessing child psychopathology is often challenging and complex; consequently, clinicians routinely employ clinical judgment to navigate the decision-making process. Research shows,
however, that clinical judgment is prone to a host of errors (Elstein & Schwartz, 2002), further complicating assessment. See Table 2 for examples of common faulty heuristics and cognitive errors in the decision-making literature.
MH professionals differ widely in their diagnoses of child psychopathology (Galanter & Patel, 2005). Inter-rater reliability among clinicians conducting unstructured interviews has been shown to be inadequate (Piacentini et al., 1993), and there is only moderate
agreement between diagnoses based on standardized research interviews and those based on clinical chart reviews (Ezpeleta et al., 1997; Lewczyk, Garland, Hurlburt, Gearity, & Hough, 2003; Vitiello, Malone, Buschle, Delaney, & Behar, 1990; Vitiello & Stoff, 1997). Moreover, research shows that diagnoses and treatment vary across settings, which can lead to adverse outcomes for children (Galanter & Patel, 2005; Pappadopulos et al., 2002). One concrete example of this phenomenon involves prescription practices. Pappadopulos and colleagues (2002) found substantial variability in prescribed antipsychotic medications across different New York State inpatient long-term hospitals. This is problematic and potentially harmful because if clinicians evaluate the same individual and reach different diagnoses, one can infer that at least some individuals are misdiagnosed and therefore not receiving optimal services. In sum, evidence suggests that clinicians within and between clinical settings differ in their assessment approaches and interpretations of diagnostic information.
6
clinician behavior often have not been successful (Galanter & Patel, 2005). Peterson (2004) comments, “For many of the most important inferences professional psychologists have to make, practitioners appear to be forever dependent on incorrigibly fallible interviews and unavoidably selective, reactive observations as primary sources of data” (p. 202). Some experts consider the current state of EB assessment as neglected (Mash & Hunsley, 2005). There is an apparent need to identify EB methods that appeal to clinicians and that they are willing to adopt into practice. This need is especially great for complex cases, such as those exhibiting bipolar symptomology.
Assessment of Pediatric Bipolar Disorder
PBD is a controversial diagnosis that has recently received a lot of attention in MH research and in the media (e.g., Kluger & Song, 2002; Papolos & Papolos, 1999). There has been a 40-fold increase in the number of young people diagnosed and treated for bipolar disorder in the span of a decade (Blader & Carlson, 2007; Moreno et al., 2007). The sizeable increase in rates of PBD is alarming. Two major concerns include the misdiagnosis of bipolar in youths (low accuracy, including low sensitivity) and the tendency for clinicians to
overdiagnose PBD (low diagnostic specificity). Misdiagnosed youths face a number of serious consequences, including delays in
7
is also evidence that suggests medications, such as antidepressants and/or
methamphetamines, can bring about mania or mixed episodes in youth with bipolar (cf. Joseph, Youngstrom, & Soares, 2009). Suicidality represents another big concern associated with these medications (Olfson, Marcus, & Shaffer, 2006; Tondo, Isacsson, & Baldessarini, 2003). Overall, more research is needed to better understand the role of
psychopharmacological agents in the treatment of PBD (Smarty & Findling, 2007). Weller, Danielyan, & Weller (2004) highlight the need for confident bipolar diagnoses before starting medication. Unfortunately, it is difficult to arrive at correct bipolar diagnoses with such confidence. For example, research indicates an average delay of more than 10 years between first episode and diagnosis of bipolar illness (Hirschfeld, Lewis, & Vornik, 2003). Another recent study found that 5 or more years elapsed from the onset of symptoms until making a bipolar diagnosis for 52.4% of youth patients in a community MH setting (Marchand et al., 2006).
8
case conceptualizations and treatment plans (Youngstrom et al., 2005). Second, overlapping symptomatology complicates diagnoses because it is hard to tease out bipolar symptoms from symptoms of more prevalent diagnoses, such as ADHD, unipolar depression, or
conduct disorder. Third, common diagnostic instruments used in research, such as structured and semi-structured interviews, can be impractical for use in clinical settings due to issues of training, burden, and reimbursement (Youngstrom, Meyers, Youngstrom, Calabrese, & Findling, 2006). Fourth, the cyclical aspect of PBD threatens the reliability of diagnostic impressions and can make diagnostic decisions difficult. For example, classic BP-I disorder can present as florid mania, severe depression, a mixed state, or as normal functioning (Kraepelin, 1921).
Gold Standard for Clinical Assessment
9 evaluation.
Several studies have since employed the LEAD standard (Klassen, Miller, & Fine, 2006; Miller, 2001, 2002; Miller, Dasher, Collins, Griffiths, & Brown, 2001; Peters & Andrews, 1995; Pilkonis, Heape, Ruddy, & Serrao, 1991). For example, Pilkonis and others (1991) investigated the reliability, stability, and clinical and predictive validity of Axis II diagnoses in patients with depression. Specifically, researchers tested the validity of two personality disorder instruments, the Personality Disorder Examination (Loranger, Susman, Oldham, & Russakoff, 1987), and the Personality Assessment Form (Pilkonis & Frank, 1988; Shea, Glass, Pilkonis, & Watkins, 1987) using the LEAD approach. Study findings provided preliminary support for using LEAD standard methodology. Further, Miller conducted a series of studies comparing the Structured Clinical Interview for the Diagnostic Statistical Manual for Mental Disorders-Clinical Version (SCID-CV) and computer-based decision support systems to consensus diagnoses (i.e., consensus diagnoses were arrived at using Spitzer’s LEAD standard) (Miller, 2001, 2002; Miller, Dasher et al., 2001). For example, psychiatric diagnoses from a computer assisted diagnostic interview (CADI) were compared to consensus diagnoses from Spitzer’s LEAD standard and were found to be in agreement = 86% and kappa = 0.81 (‘excellent’) (Miller et al., 2001). The Miller studies are highly relevant given that Miller used LEAD diagnoses to assess the validity of novel decision heuristics (i.e., a computer assisted diagnostic instrument), which represents a similar goal of the present proposal (i.e., compare LEAD diagnoses to Bayesian estimates).
Bipolar Phenotypes
10
and broad. The narrow phenotype consists of recurrent episodes of major depression and
mania/hypomania (Nottelmann et al., 2001). According to this classification system, BP-I and BP-II fall under the narrow phenotype. The broad phenotype has various definitions; nevertheless, chronic mood instability or lability (versus discrete mood episodes) and irritability (minus euphoria or depression) represent common features of the broad phenotype. Diagnoses falling under the broad phenotype include BP-NOS, cyclothymic disorder, or subsyndromal bipolar disorder.
Despite the complexity involved in the assessment of bipolar disorder in children and adolescents, there is a growing consensus in the research community, at least, about the validity and clinical presentation of BP-I (Ghaemi et al., 2008; Youngstrom, Birmaher, & Findling, 2008). In particular, BP-I may be readily recognizable if symptom presentation closely aligns with the criteria outlined in the Diagnostic and Statistical Manual of Mental
Disorders (4th ed. [DSM-IV]; American Psychiatric Association, 1994), including increased
energy, feelings of grandiosity, and conventional symptoms of mania (excluding ‘flight of ideas’ and hypersexuality, which occurred much less frequently in study samples) (Axelson et al., 2006; Kowatch et al., 2005; Soutullo et al., 2005). Further, recent research indicates that MH professionals are more likely to agree on a bipolar diagnosis when the clinical presentation is classic BP-I (i.e., classical cases of mania) (Dubicka, Carlson, Vail, & Harrington, 2008).
11
more likely to have bipolar if he/she has a first degree (biological) relative with bipolar (Hodgins, Faucher, Zarac, & Ellenbogen, 2002; Smoller & Finn, 2003; Youngstrom & Duax, 2005). Overall, there is more agreement around narrow phenotype bipolar, especially in cases of BP-I, when family risk is present.
In contrast to the growing consensus around BP-I, the rest of the bipolar spectrum (i.e., BP-II and the “broad phenotype”) continues to be more difficult to recognize and diagnose. Current diagnostic nosology is challenged by the heterogeneity of bipolar and the role of developmental influences on its clinical presentation (Leibenluft et al., 2003). Moreover, chronic and oscillating mood presentations associated with broad phenotype bipolar cause substantial impairment and seem to be more prevalent than BP-I (Lewinsohn, Klein, & Seeley, 1995; Youngstrom et al., 2008). Experts have various recommendations for addressing bipolar spectrum and the problems associated with current diagnostic definitions. For example, Leibenluft and others (2003) propose multiple phenotypes (i.e., narrow,
intermediate, broad) based on characteristics of the manic or hypomanic episodes, while others argue that bipolar disorder represents a continuum of illness lacking any point of ‘real cleavage’ from unipolar depression (Phelps, Angst, Katzow, & Sadler, 2008). These different perspectives underscore the current state of the field; there is a dearth of empirical
information to guide next steps in addressing diagnostic classification of broad phenotype bipolar (i.e., DSM-V). Despite the need for a greater understanding of this clinical
population, clearly there is a group of youths who endure impairing bipolar symptoms but do not fit neatly into current diagnostic categories, no doubt complicating assessment,
12
of tremendous range of opinion among practicing clinicians about how to label cases with “soft spectrum” bipolar presentations (Dubicka et al., 2008; Jenkins et al., 2008).
Actuarial Decision-Making: The Nomogram
According to Sedlmeier & Gigerenzer (2001), “Unlike reading and writing, statistical literacy- the art of drawing reasonable inferences from such numbers, is rarely taught. The result of this has been termed ‘innumeracy’ (Paulos, 1988).” Statistical reasoning techniques could largely benefit decision-making in the clinical assessment of PBD and other
challenging diagnoses. Bayes’ Theorem is a highly accurate means of combining information about risk (Youngstrom et al., 2005). Evidence suggests that the presentation of information can significantly affect one’s ability for learning how to use interpretative methods. For example, Bayesian computations appear easier to perform using natural frequencies than with probabilities (Sedlmeier & Gigerenzer, 2001). Children have successfully applied Bayes’ Rule when information was presented in natural frequencies (Zhu & Gigerenzer, 2006). These findings support the feasibility of teaching statistically advanced techniques to individuals of varying educational, scientific, and occupational backgrounds.
Most training programs do not teach application of Bayes’ Theorem, nor are these tools routinely used in spite of decades of research demonstrating their advantages in the laboratory (Gigerenzer, Hell, & Blank, 1988). Despite the evidence that people can be taught to think like “natural frequentists,” a more user-friendly technique is needed for Bayes’ Theorem to actually take root in real-world MH settings. Nomograms, which have gained popularity in EB medicine over the last ten years, are attractive tools because they
13
nomogram approach involves connecting the dots correctly to estimate revised, posterior probabilities, whereas computing natural frequencies involves first calculating the dots to
connect (see Appendix A). The nomogram is an EB decision aid that significantly increases assessment accuracy
and significantly decreases interpretation variation among clinicians (Jenkins et al., 2008). Jaeschke, Guyatt, & Sackett (1994) recommend the “nomogram” as a simple, practical method for combining information about risk with the “diagnostic likelihood ratios” associated with test results or other clinical findings. The nomogram allows clinicians to work directly with probabilities without requiring any mathematical computation
(Youngstrom & Duax, 2005). Although the nomogram approach is central in EB medicine for assisting with diagnostic and treatment decisions (Guyatt & Rennie, 2002; Straus, Richardson, Glasziou, & Haynes, 2005), it is not commonly used among psychologists and other MH professionals.
A Bayesian approach can be particularly effective in guiding challenging, high-stakes diagnoses, such as PBD. The nomogram correctly combines three pieces of information (i.e., base rate, familial risk, and test score) into consistent (less spread in opinion), unbiased (neither systematically over- or under-estimating risk), and efficient (using a parsimonious amount of information to arrive at the posterior probability) estimates (Jenkins et al., 2008; Youngstrom & Duax, 2005). The nomogram could also synthesize other sources of
information. This estimate, the Bayesian posterior probability, can be used in the assessment of PBD to determine the likelihood that a youth has PBD, and to guide next steps in
14
(Davidow & Levinson, 1993), the nomogram offers particular clinical utility in the assessment of PBD.
A recent clinical vignette study provides empirical evidence that the nomogram significantly increases assessment accuracy and decreases interpretation variation among national and international MH professionals (Jenkins et al., 2008). In addition, use of the nomogram generated positive feedback from a majority of professionals, many of whom were clinicians on the front line of service provision. Given that participants came from diverse clinical backgrounds, this finding suggests that the nomogram has the potential to be implemented and positively received in a variety of clinical settings.
More specifically, study findings were consistent with qualms that MH professionals are prone to overdiagnose PBD and to interpret identical information differently. When participants estimated the risk of PBD via clinical judgment alone, interpretations ran the full gamut (0-100). Giving professionals another piece of relevant information (i.e., a CBCL score) did not significantly improve diagnostic accuracy or increase consensus between groups. This finding is disconcerting in light of the dramatic increase in PBD diagnoses; it suggests that bipolar diagnoses made using clinical judgment risk inaccuracy and
disagreement across MH professionals. However, the use of a nomogram led to dramatic improvements in interpretation of assessment information by practicing MH professionals. The nomogram resulted in increased accuracy and consistency (i.e., less variability in
estimates around the “true” Bayesian probability). A brief (< 30 minute training) was
15
real-world PBD cases. One important next step will be identifying cases that may not be well-suited for the tool (i.e., narrow versus broad bipolar phenotypes, etc.).
To assess the likelihood that a youth has PBD, clinicians can use the nomogram and arrive at a precise Bayesian estimate without doing any mathematical computation
(Youngstrom & Duax, 2005). The nomogram combines the base rate, familial risk, and a standardized test score. To use the nomogram, a clinician would follow these steps:
1) Plot the base rate estimate on the far left line. This is the starting probability of PBD (i.e., the prevalence of PBD in a given clinical setting, geographic region, etc.). This estimate can be found in the literature or, a clinical setting can fairly easily compute a more tailored base rate given the number of PBD clients receiving services at their clinic. Base rates will fluctuate some depending on the setting. For example, clinical settings that offer more immediate and intensive care, such as inpatient settings, hospital emergency rooms, or bipolar specialty clinics, likely necessitate higher starting base rates because individuals seeking treatment at these types of service settings typically represent more severe
populations and are thus at greater risk of having bipolar illness. Research has suggested base rates of 30% for inpatient settings (Carlson & Youngstrom, 2003), 34% for acute psychiatric hospitalizations (Blader & Carlson, 2007), and between 15 and 17% for specialty outpatient services (Biederman et al., 1996). It is typical that inpatient settings have higher base rates of PBD than outpatient settings. Youngstrom and Duax (2005) recommend a PBD base rate of 6% for outpatient settings, in the absence of any other information about the local setting.
2) Plot familial risk estimate on the middle line. Research indicates family history as
16
follows: biological parent (or other first degree relative) with bipolar disorder = 5; second degree relative = 2.5; “fuzzy” family history of bipolar disorder = 2; no family history of bipolar disorder = 1 (Hodgins et al., 2002; Tsuchiya et al., 2003; Youngstrom & Duax, 2005). Note that second degree relatives are associated with a risk estimate half that of first degree relatives. By way of genetic composition, individuals’ second degree relatives carry half the genes of first degree relatives; therefore, they contribute roughly half the risk of individuals’ first degree relatives.
“Fuzzy” family history entails either a past diagnosis of uncertain validity, or else a different diagnosis for which bipolar is often mistaken in a minority population (e.g.,
schizophrenia or conduct disorder) (DelBello, Lopez-Larson, Soutullo, & Strakowski, 2001; Strakowski, McElroy, Keck, & West, 1996). See Methods for additional information
regarding the “fuzzy” category.
3) Connect the left and middle dots and extend the line across the far right vertical axis. The number on the right axis provides the posterior probability or the Bayesian estimate of PBD. This estimate is fairly precise and will be close to the Bayesian exact estimate (Guyatt & Rennie, 2002). Any errors introduced will be due to visual interpolation between the anchors, and due to imprecision connecting the dots and extending the line.
17
for the left line and the diagnostic likelihood ratio associated with the test score for the middle line (Youngstrom & Kogos Youngstrom, 2005). Alternately, the DLRs could be multiplied together and the product used in single pass through of the nomogram; however, this approach would require the use of some arithmetic.
The risk estimates associated with family history and standardized test scores are diagnostic likelihood ratios (DLRs). A DLR is the sensitivity divided by the false alarm rate (i.e., complement of diagnostic specificity). The likelihood ratio indicates how often the risk factor, sign, or test score would occur in cases of bipolar disorder, compared to the rate of the same risk factor, sign, or score in cases without bipolar disorder (Jaeschke, Guyatt, &
Sackett, 1994a, 1994b; Straus et al., 2005).
Threshold Model
The last step of the nomogram provides the Bayesian posterior probability, or the likelihood that a youth has bipolar disorder. This estimate falls somewhere between 0
18
that lie between the two thresholds (wait and treat) necessitate additional assessment because the likelihood of illness is not extreme enough to rule bipolar out (low end) or initiate
treatment (high end).
A threshold model appeals for a number of reasons. First, this EB framework affords flexibility. The different thresholds can be tailored to important factors, such as client
preferences. For example, given the serious side effects associated with the medications used to treat bipolar disorder, some clients and their families may want to delay
psychopharmacological treatment (i.e., set a more conservative or higher treatment
threshold), whereas others may be less concerned about potential side effects (e.g., weight gain and acne) and instead prefer to initiate psychopharmacological treatment immediately (i.e., set a more liberal or lower treatment threshold). Further, flexible thresholds may empower clients by giving them the opportunity to evaluate pros and cons of treatment (or further testing) and determine thresholds that meet their individual needs (Sackett et al., 2000).
Second, sophisticated calculations can be performed to establish test-treatment thresholds. Alternately, Straus et al. (2005) recognize and support intuitive test-treatment thresholds that rely on clinical expertise. Regardless of how test-treatment thresholds are decided, the threshold model represents an innovative approach that judiciously combines actuarial estimates with clinical insight. Practitioners in some clinical settings may want to implement an assessment intervention threshold model with wait/assess/treat thresholds based on statistical algorithms (see Gray, 2005 for more information about these
19
more clinical expertise for cases approaching test-wait and test-treat thresholds). Third, using a threshold model to guide next steps in patient care helps prevent
cognitive biases and faulty heuristics from creeping back into the decision-making process. For example, not providing wait/assess/treat ranges makes clinicians vulnerable to
misinterpreting probabilities. Research shows that clinicians tend to interpret the same piece of diagnostic information very differently (Jenkins et al., 2008), so providing test-wait and test-treat thresholds can help guard against such inconsistencies in clinical practice.
Moreover, if nomograms are adopted into practice for multiple disorders (e.g., ADHD and PBD) then it will be important for clinicians to recognize that post-test probabilities may have different consequences for different disorders (similar to how thresholds can be adjusted depending on patient preferences). For example, one might argue that a post-test probability of 85% for ADHD surpasses the test-treat threshold and triggers treatment, including
psychostimulant medication, whereas an 85% post-test probability for bipolar may not be high enough to start treatment with mood stabilizers or atypical antipsychotic medications given the potentially serious consequences associated with prematurely starting medication. It is possible to incorporate information about the risks and benefits into calculations that select optimal thresholds (Kraemer, 1992; Straus et al., 2005), but a practical limitation is that normative data are often not available for quantitative estimates of risk and benefit. This does not prevent using the individual patient preferences, and skilled users of the nomogram could incorporate patient preferences into the decision-making process.
20
process (Youngstrom, 2008). Given the current state of assessment practices in MH, a user-friendly actuarial approach (the nomogram) used in conjunction with flexible interpretation guidelines (the threshold model) has significant appeal and could go a long way in improving MH services.
The Parent General Behavior Inventory (PGBI)
To achieve the most accurate actuarial estimate possible, it is important to select the best available screening instrument. In 2004, Youngstrom and others compared six index tests to determine diagnostic efficiency in predicting PBD, including the Parent Young Mania Rating Scale (PYMRS) (Gracious et al., 2002), the General Behavior Inventory (GBI) (Danielson et al., 2003; Depue et al., 1981), the Parent General Behavior Inventory (PGBI) (Youngstrom et al., 2001), Child Behavior Checklist (CBCL) (Achenbach, 1991a), the Youth Self Report (YSR) (Achenbach, 1991c), and the Teacher Report Form (TRF) (Achenbach, 1991b). This study has a number of noteworthy strengths. First, it used two relatively large samples and followed the STARD guidelines for reporting diagnostic test results (see Bossuyt et al., 2003). Second, this study involved the simultaneous inclusion of multiple index tests, which allowed for comparisons between different measures and different
informants (parent, teacher, and youth). Third, evaluation of diagnostic efficiency used both global estimates and multilevel DLRs, which provide clinical utility for test interpretation. Finally, analyses were replicated on an independent sample of younger youth and
bootstrapping procedures were incorporated providing nonparametric estimates of confidence intervals (i.e., less influenced by statistical outliers). Both of these features serve to enhance
generalizability of study results.
21
First, based on the areas under the curve (AUC) from Receiver Operating Characteristic (ROC) analyses and logistic regression results, parent report appears to be more useful than teacher or self report in detecting and diagnosing PBD in five to seventeen year olds. AUCs for the PGBI, CBCL, and PYMRS (.84, .78, and .80 respectively) were significantly larger than AUCs for the GBI, YSR, or TRF (.67, .71, and .70 respectively) in the older sample. Second, the PGBI represents the preferred rating scale in terms of changing the likelihood of PBD to a substantial degree when there are existing risk factors or clinical concerns of bipolar. The PYMRS has performed substantially less well in subsequent replication (Youngstrom et al., 2005). Third, none of the index tests alone are sufficient or intended as diagnostic instruments. Even though the PGBI demonstrated an AUC of .84, the most
sensitive and specific of the six tests, this instrument used by itself is not sufficient to clinch a bipolar diagnosis.
In summary, the PGBI has evidenced impressive diagnostic efficiency in a well designed study comparing six popular index tests (Youngstrom et al., 2004). Parent report is currently the best source of information on questionnaires, and the PGBI appears to be a leading parent measure for detecting mania in PBD populations.
Limitations of the Nomogram
Despite the appeal of the nomogram as an effective, user-friendly decision aid, like all heuristics, it is not without limitations. First, the prevalence of PBD is a hot and
contentious topic. In spite of the growing consensus about the validity of bipolar in children and adolescents, the research community continues to disagree about what constitutes broad phenotype bipolar and the frequency at which such diagnoses occur. This issue is
22
clinical setting- specifically, knowing the current prevalence of PBD and being able to calculate the base rate; and, (b) base rates in any setting will most likely change as the field evolves, with changes in definitions and shifts in local practices or referral patterns.
Periodically recalculating base rates will prove necessary to generating accurate Bayesian estimates with the nomogram.
A second limitation is that local base rates may be highly problematic in many clinics as a starting point because they will be based on clinical diagnoses. Therefore, local base rates are often likely to either underestimate (e.g., clinicians are conservative in diagnosing PBD) or overestimate (e.g., clinicians use broad definitions of bipolar) the actual base rate.
Third, the pieces of information used to arrive at the posterior probability may in some cases lack independence. This possibility represents a technical issue of the tool. For example, using the nomogram to combine responses from the same parent on multiple different questionnaires is likely inappropriate because the questionnaire scores will be highly correlated with each other, and will not contribute independent information. Logistic regression can accommodate correlated predictors and adjust the regression weights to consider the joint prediction and unique contributions of each predictor- something the nomogram cannot. DLRs are typically based on bivariate estimates of the sensitivity and specificity of predictors. This is most likely to be a problem when using multiple tests from the same informant (e.g., when a mother completes more than one questionnaire about the same child).
Significance and Broader Impact
Improving clinical decision-making has become a priority in the MH field
23
not being regularly utilized in practice (Mass, 2003). The nomogram represents one of these underutilized strategies, but it is unique for a number of reasons. The nomogram is
essentially free, requires brief training, and takes relatively little time to execute in practice. More importantly, it can help multiple stakeholders (i.e., therapists, clients, and clients’ families) in the assessment of challenging diagnoses. Diagnostic decisions in cases with PBD represent one area where the nomogram could have a significant impact but this approach could also be applied to other often challenging diagnostic decisions, such as cases with ADHD. In addition, unlike other clinical decision-making tools, such as logistic regression or decision trees, which one must abandon when a predictor variable is missing, the nomogram is flexible and allows one to proceed with whatever pieces of information are available.
The nomogram has the potential to substantially improve the quality of MH services. However, before the nomogram can be successfully disseminated and implemented across clinical settings, it is necessary to first evaluate how the nomogram performs in comparison to the current reliable and valid assessment instruments. To our knowledge, no prior
24
Hypotheses
1.1 Agreement between Clinician Confidence and the Nomogram.
There will be a correlation between the LEAD ratings (clinician confidence in bipolar spectrum diagnoses) and the Bayesian estimates (nomogram probabilities of having PBD) based on the combination of family history and test score on the Parent General Behavior Inventory.
1.2 Agreement about Next Clinical Action.
Applying an EB assessment intervention “threshold model” (wait/assess/treat) to LEAD confidence ratings and Bayesian estimates will evidence clinically significant agreement between the two assessment methodologies (e.g., Cicchetti et al., 2006). 1.3 Relationship between Clinician Confidence and Type of Bipolar.
LEADconfidenceratings for BP-I will be significantly higher than LEAD ratings for other bipolar spectrum diagnoses, including BP-II, cyclothymic disorder, and BP-NOS. Clinicians will be more confident in a bipolar diagnosis when the clinical presentation is
classic BP-I (i.e., classical manic symptoms).
1.4 Potential Moderators of Agreement between Clinician Confidence and Nomogram.
Agreement between LEAD ratings and Bayesian estimates will be higher for BP-I than for broad phenotypes of pediatric bipolar disorder (i.e., type of bipolar will statistically moderate agreement).Significance of the interaction terms will be the direct test of the hypothesis.
1.5 Generalizability of Nomogram Approach.
25 Methods
Procedure
Clinical Assessment.
All study procedures were approved by the Institutional Review Boards of University Hospital of Cleveland, Case Western Reserve University, and Applewood Centers,
Incorporated. Written consent was obtained from parents or guardians for the participation of their children and written assent was obtained from all youths for their participation. The KSADS diagnostic interview (intake assessment) was administered by a highly trained research assistant to all participants and their families.
Parents completed a series of questionnaires while youths were interviewed, including the Parent General Behavior Inventory (PGBI) (Youngstrom et al., 2001), Child Behavior Checklist (CBCL) (Achenbach, 1991a), and the Parent Young Mania Rating Scale (PYMRS) (Gracious et al., 2002). Youth ages 11 to 17 completed the Youth Self Report (YSR) (Achenbach, 1991c) and the General Behavior Inventory (GBI) (Danielson et al., 2003; Depue et al., 1981), while the parent completed the KSADS interview. Rating scale responses were kept confidential so that youths and parents did not have knowledge of each other’s responses. Upon completion of the interview, KSADS were scored. KSADS
diagnoses were blind to rating scales.
26
developmental history; (3) family history of mental illness; and, (4) psychiatric history, including any current diagnoses. Clinical chart reviews often provided information regarding youths’ developmental and psychiatric histories. For each diagnosis, the expert clinician assigned a LEAD confidence rating based on how likely he/she viewed the diagnosis given all of the available information. These diagnoses and corresponding LEAD confidence ratings (likelihood of illness from 0-100%) represent the current gold standard in clinical assessment and will be compared to the Bayesian estimates.
Actuarial Assessment.
Procedures for actuarial assessments involved four steps. First, the prevalence or starting base rate for the study population was determined. Second, family history of bipolar illness and test scores on the PGBI were obtained for all cases in the aforementioned study. Third, family history of bipolar illness and test scores on the PGBI for these cases were translated into diagnostic likelihood ratios (DLRs). Fourth, the base rate of PBD and the DLRs for family history and PGBI scores were combined via Bayesian methods to provide the probability or likelihood of a bipolar diagnosis (i.e., the actuarial or Bayesian estimate). More detailed information about individual components of this process is provided below.
Prevalence.
27
base rate in light of clinical context. For example, the literature suggests a starting base rate of roughly 6% for outpatient settings (Geller et al., 2002; Youngstrom et al., 2005), 30% for inpatient settings (Carlson & Youngstrom, 2003), 34% for acute psychiatric hospitalizations (Blader & Carlson, 2007).
In the present study, the type of setting where participants were assessed was a blend of outpatient care and specialty clinics. Because these two settings differ substantially, there is no clear choice for the best starting base rate (i.e., there are no published data about recommended starting base rates for blended settings). We do know that a base rate of 6% is currently recommended for outpatient settings (Geller et al., 2002; Youngstrom et al., 2005) and that a base rate between 15 and 17% is recommended for specialty outpatient services (Biederman et al., 1996). Taking into account prevalence estimates found in the literature and base rate information for the present sample which was approximately 18%, a starting base rate of 12% was agreed upon for the present project. This process is an example of making an educated guess based on the literature and any specific information one can obtain from his/her clinical setting. Future studies should investigate base rates for blended settings as it represents an important consideration in using the nomogram or any actuarial assessment methodologies.
Diagnostic Likelihood Ratios (DLRs).
28
history and PGBI test scores can be translated into DLRs and plotted on the middle column of the nomogram (see Measures Administered).
Participants
A total of 643 youth, 5 to 17 years old, participated in the study. The mean age of study participants was 10.79 (SD = 3.46). Additional demographic characteristics of youth
participants are provided in Table 2. The majority (90%) of youth were enrolled to
participate in the present study by their mothers. Forty-two percent of participants’ primary caretakers were single parents, 36% were married, 19% were divorced, and 4% were widowed. In regards to primary caretakers’ highest level of education attained, 25% completed partial high school (grades 10 and 11) or less, 28% graduated from high school, 35% completed one to three years of college or trade school, 8% graduated from a four year university, 4% attended graduate school.
Half of youth participants’ primary caretakers were currently unemployed. four percent of primary caretakers had an estimated annual income under $5000. Twenty-nine percent earned $5000 to $14999, 20% earned $15000 to $29999, and the remaining 9% earned $30000 or more per year. Note that information pertaining to participants’ financial status was only available on a subset of the sample (n = 167). More information regarding
participants’ socioeconomic characteristics is available upon request. See Table 3 for information pertaining to participant demographics and diagnostic characteristics.
Participants were recruited from two different clinical infrastructures. The first infrastructure was a community mental health center (CMHC) with four urban sites
29
largest clinics. The second infrastructure was an outpatient academic medical center with more than a dozen different pharmacotherapy studies enrolling during the course of recruitment for the present study. Bipolar disorder (I and cyclothymic disorder or BP-NOS), unipolar depression, ADHD, conduct disorder, and aggressive behavior regardless of diagnosis were target diagnoses for the treatment protocols. Presenting symptoms and willingness to participate in treatment protocols were the basis for recruitment. Families gained information about the different studies through different advertisements and referrals. Families interested in treatment studies partook in the diagnostic assessment for screening purposes and to provide baseline evaluations.
Referrals of children whose parents had a bipolar disorder and were participating in research or treatment at an associated adult mood disorders clinic enriched the academic sample. Additionally, under the auspices of a Child and Adolescent Psychiatric Clinical Research Center, youths and normal controls were recruited by word of mouth and study fliers to complete descriptive psychometric measures.
30
suspected moderate, severe, or profound mental retardation documented by educational history, standardized cognitive ability test scores of less than 70, or a Peabody Picture Vocabulary Test–Third Edition (Dunn & Dunn, 1997) score of less than 70. The same assessment procedures were administered to all eligible participants. This included the index tests and reference standard diagnostic interview and was regardless of participants’
presenting symptoms or eligibility for treatment studies. Study design was “prospective” in that data collection was planned before assessment procedures were performed (Bossuyt et al., 2003).
Measures Administered
Reference Standard: Semistructured Diagnostic Interview Using the Schedule of
Affective Disorders and Schizophrenia for Children. The Schedule for Affective Disorders
and Schizophrenia for School-Age Children-Present and Lifetime (KSADS-PL) (Kaufman et al., 1997) combined with the mood disorders module from the Washington University
KSADS (WASH-U-KSADS) (Geller, Zimerman et al., 2001) was administered to all participants and their families. The WASH-U-KSADS consists of symptoms and associated features of depression and mania that other structured or semi-structured instruments do not capture. The KSADS is the most widely used semistructured diagnostic procedure for investigations of PBD (Nottelmann et al., 2001). I, II, cyclothymic disorder, and BP-NOS diagnoses were made in accordance with DSM-IV diagnostic criteria (American
Psychiatric Association, 1994). The most frequent reason for diagnosing BP NOS was failure to meet strict DSM duration criteria (Leibenluft et al., 2003).
31
new raters were required to lead five KSADS interviews with experienced raters and to achieve an overall κ of > 0.85 at the symptom severity level and 1.0 agreement about the presence or absence of diagnoses. To maintain acceptable interrater reliability (κ > 0.85 about symptom severity) the research team held joint rating sessions. These sessions were scheduled monthly or at every 10th interview (whichever occurred second). One interviewer consistently worked with both the caregiver and youth to resolve discrepancies by employing clinical judgment as needed. In addition, per the joint reviews, average interrater agreement remained above a κ of 0.85 at the item level.
The Parent General Behavior Inventory (PGBI). The PGBI has been used to describe
youths 5 to 17 years old with the primary focus of assessing the likelihood of a bipolar
diagnosis based on high and low scores. Low scores decrease the odds that a given youth has a bipolar disorder, while high scores increase the odds. See Table 4 for DLRs associated with PGBI scores (see Youngstrom et al., 2004 for details).
Mini International Neuropsychiatric Interview(MINI). The MINI is a brief
standardized diagnostic interview with documented reliability and validity (Sheehan et al., 1998) that was developed in 1990 by psychiatrists and clinicians for DSM-IV and
32
Family history of bipolar disorder was based on information obtained from the MINI which was administered by a trained rater. The MINI was first administered to the person who brought the youth in for evaluation and then this person was asked to answer similar questions about as many other family members as possible using a modified Family History – Research Diagnostic (Andreasen, Endicott, Spitzer, & Winokur, 1977). It should be noted that history of bipolar disorder may be incomplete; most of the time, raters only collected family history information for youths’ relatives currently residing in the family household.
Fuzzy family history of bipolar disorder entails either a past diagnosis of uncertain validity, or a different diagnosis for which bipolar is often mistaken in an ethnic minority population (Youngstrom & Duax, 2005). The fuzzy category denotes an intermediate change in the DLR of bipolar in the proband: the risk (and the associated DLR) are lower than if the relative had a clearly documented case of bipolar disorder, but this risk is still not neutral and is higher than if the family had no history of mental health issues. It was not possible to identify the race/ethnicity of participants’ relatives in the present study who received a clinical diagnosis on the MINI (see Limitations).
Of significance, the literature indicates that African-American populations are at high risk of being misdiagnosed with schizophrenia instead of a correct diagnosis of BP
(Mukherjee, Shukla, Woodle, Rosen, & Olarte, 1983; Neighbors, Trierweiler, Ford, & Muroff, 2003; Neighbors et al., 1999). African-Americans are also less likely than Caucasian patients to receive bipolar diagnoses when all subjects present with psychotic mania
33
study sample are predominantly African-American, any first degree relative with a diagnosis of any type of schizophrenia on the MINI was classified as “fuzzy” and assigned a DLR of 2.5.
A few additional disorders that qualified first degree relatives for fuzzy status warrant discussion. These disorders include: mood disorder NOS; mood disorder with psychotic features; brief psychotic disorder; psychotic disorder NOS; depression with atypical features; and, delusional disorder NOS. These disorders were included in the fuzzy category for two main reasons. First, differential diagnosis for this group of disorders is often challenging (Anthony et al., 1985; Helzer et al., 1985); in fact, there is evidence that clinicians are prone to misdiagnose these disorders for a variety of reasons (Ghaemi, Sachs, & Goodwin, 2000; Sprock, 1988). Given that differential diagnosis for these disorders would likely include bipolar disorders (i.e., manic symptoms frequently overlap with other psychotic disorder symptoms), it seems prudent to include these disorders in the fuzzy criterion for the purposes of the given project.
The MINI was first administered to the person who brought the youth in for
evaluation and then this person answered similar questions about other family members. The precision of the family history information about other family members may be diluted as a result of retrospective report coming from a third party, which has been shown to be
34
Of significance, only first degree relatives were eligible for “fuzzy” status. Assigning first degree relatives with the aforementioned disorders to fuzzy status provides
diagnostically useful information (i.e., a change in the diagnostic odds by 2); however, taking a similar approach for second degree relatives does not provide statistically or clinically meaningful information. More specifically, fuzzy status for second degree relatives would be associated with a DLR of 1, which would have a neutral influence on the actuarial estimate (i.e., would not increase or decrease the likelihood that a youth has PBD).
Overall, classification of family risk status for this project took a largely conservative approach. For example, only first degree relatives with BP-I were associated with a 5x
increase in odds, whereas first degree relatives with other diagnoses on the BP spectrum were treated as “fuzzy” (a DLR of 2). Further, only first degree relatives with frequently
misdiagnosed mental disorders (e.g., schizophrenia) were assigned to fuzzy status, whereas second degree relatives with similar disorders were not (i.e., aunts or uncles with
35 Results
Power Analysis
There was more than adequate power to detect effects for all primary analyses (Donner, 1998; Faul, Erdfelder, Lang, & Buchner, 2007). A sensitivity analysis was run for Pearson’s correlation, analysis of variance (ANOVA), and regression (Hypotheses 1, 3-5), and Donner (1998) was referenced to determine power for the analysis which used Cohen’s kappa coefficient (Hypothesis 2).
First, for the hypothesis that used Pearson’s correlation to examine agreement
between clinician confidence and the nomogram, the power sensitivity analysis indicated that we had 80% power to detect a small effect size (r = .11) (Cohen, 1988) for the given sample
size (N = 643) and alpha (.05, 2-tailed).
Second, according to Donner (1998), power was adequate for the hypothesis that used Cohen’s kappa coefficient to examine agreement between clinician confidence and the nomogram in regards to next clinical action. Sample sizes of 203, 96, and 83 are 80% powered to detect effects of .1, .3, and .5 respectively (for alpha .05, two-sided) (Donner, 1998). Our sample size exceeded 203, suggesting we had more than 80% power to detect a small effect size.
Third, a planned comparison tested whether clinician confidence for BP-I was significantly higher than clinician confidence for other types of bipolar. The sensitivity analysis for ANOVA indicates that we had 80% power to detect a small to medium effect size (r = .23) (Cohen, 1988) for the given sample size (n = 149) and alpha (.05, 2-tailed). The
36
more than 95% powered according to a post hoc power analysis using the observed effect sizes.
Fourth, OLS regression was used to examine potential moderators of agreement between the nomogram and clinician confidence. We had 80% power to detect a small effect size (f² = .06) (Cohen, 1988) for the given sample size (n = 136) and alpha (.05, 2-tailed).
This sample (n = 136) is a subgroup of individuals with a bipolar diagnosis so it is smaller
than the total sample.
Lastly, Pearson’s correlation quantified the generalizability of the nomogram approach. Results from this sensitivity analysis indicate that we had 90% power to detect a small effect size (r =.13) (Cohen, 1988) for the given sample size (n = 624) and alpha (.05,
2-tailed).
Descriptives and Missing Data
Analyses began with descriptive statistics. After acquiring means and standard deviations, skewness and kurtosis were used to examine the normality of distribution and the extent to which distributions differed substantially from approximately normal distributions. Minimum and maximum values were obtained for each variable and checked to make sure that they represented possible values. Impossible values were evaluated for possible data collection or data entry errors.
Family history information and research diagnoses (see Table 2 and Table 4) were available for all participants. In terms of descriptives and missing data for quantitative variables, three variables were of interest: LEAD ratings, Bayesian estimates, and PGBI test scores. None of these variables was normally distributed. See Table 7.
37
moderately peaked distribution. The majority of the sample (80%) did not have bipolar, and therefore was assigned a confidence rating of 0. This means that most of the sample received a low score, making the median less than the mean, causing a positively skewed distribution.
Likewise, the distribution of nomogram estimates was positively skewed; however, not to the same degree as clinician confidence ratings. The majority of the sample did not have a family history of bipolar illness (i.e., not increasing the odds of a youth having bipolar) and the average PGBI score was 21.28, or within the neutral range (i.e., not significantly increasing or decreasing a youths’ odds of a bipolar diagnosis). Because 12% was used as the starting base rate for bipolar disorder, and we know that the majority of nomogram estimates were not significantly influenced by the DLRs associated with family history and PGBI scores, it makes sense that the median for this variable was 13.20. Moreover, the minimum nomogram estimate was never 0, which likely prevented the
distribution from appearing as skewed as the distribution for clinician confidence ratings (for which it was possible for diagnoses to receive a confidence rating of 0). Kurtosis was
negligible for nomogram estimates.
38
neutral threshold. In other words, the “base rate” and test “level” should be similar on a good test (see Kraemer, 1992). Kurtosis was negligible.
Less than 2% of data were missing. The rate of missing data points was calculated by multiplying the number of variables by the number of participants and then dividing by the number of complete data points. Given that the amount of missing data was small, missing data were excluded listwise. This approach provides less bias than pairwise deletion and is adequately suited for small amounts of missing data (Allison, 2002). Missing data did not impede analyses.
Agreement between Clinician Confidence and the Nomogram
Pearson’s correlation tested the prediction that there was an association between the LEAD rating and the Bayesian risk estimate of having PBD based on the combination of family history and test score on the PGBI. The LEAD ratings correlated r = .37 with the
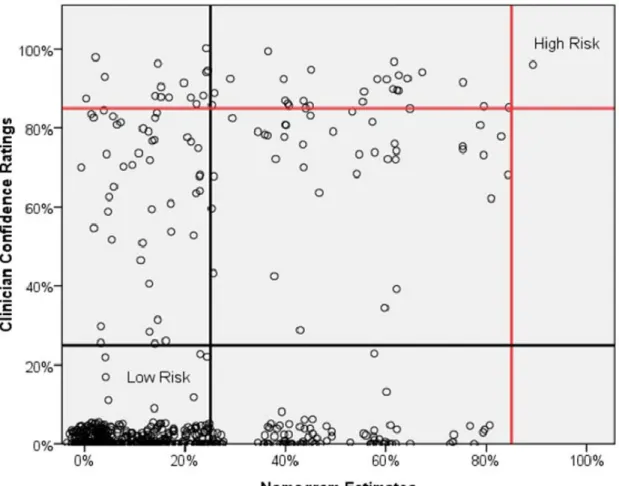
Bayesian estimates, indicating a medium positive relationship (Cohen, 1988). Figure 1 superimposes the test-wait and test-treat thresholds on the scatter plot displaying Bayesian estimates and LEAD estimates. The Bayesian ratings were generally more conservative, almost never crossing the treatment threshold, and often falling in the low or indeterminate ranges for cases where the LEAD confidence ratings were high. This pattern suggests: (a) the Bayesian approach by itself would not be sufficient to initiate treatment, at least not with the current set of inputs; (b) additional information captured in the LEAD process may be necessary to cross the treatment threshold; and, (c) the Bayesian approach does not appear likely to generate “false positives” that would be exposed to unwarranted treatments.
Agreement about Next Clinical Action
39
“threshold model” (wait/assess/treat) to LEAD confidence ratings and Bayesian estimates showed clinically significant agreement between the two assessment methodologies. Results
indicate a
ĸ
= .21 when test-wait threshold and test-treat threshold were set at 25 and 85,respectively. Using benchmarks described in Cicchetti’s recent review of levels of agreement (Cicchetti et al., 2006), LEAD confidence ratings and Bayesian estimates evidence fair
agreement when a threshold model approach was taken. It should be noted that
ĸ
= .21 is onthe cusp of slight and fair agreement (Landis & Koch, 1977) and that by other standards of
clinical significance
ĸ
< .40 is considered poor (Cicchetti & Sparrow, 1981; Fleiss, 1981,2003). Table 8 provides a detailed comparison of the clinical decisions generated by each approach.
Relationship between Clinical Confidence and Type of Bipolar
ANOVA compared mean confidence ratings between the BP-I group (n = 28), BP-II
group (n = 17), cyclothymic disorder group (n = 50), and BP NOS group (n = 54).
Confidence ratings between groups were significantly different, F(3,145) = 7.72, p < .0005.
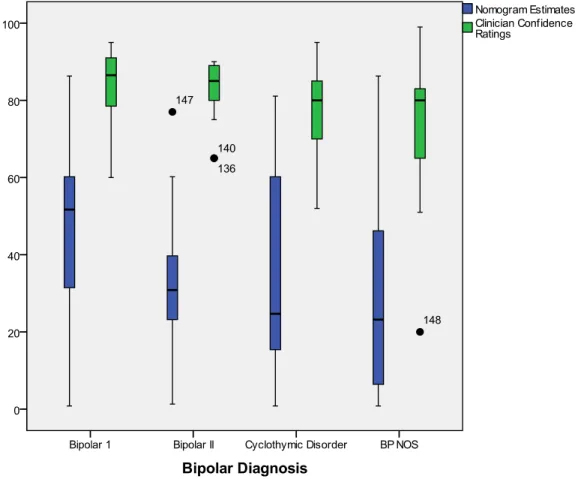
Planned comparisons examined the relationship between confidence ratings for BP-I and the other bipolar disorders. Results indicate that confidence ratings for BP-I were significantly higher than confidence ratings for cyclothymic disorder, t(41.92) = -2.12, p < .05, and BP
NOS t(57.22) = -3.56, p < .005, but not for BP-II, t(33.40) = -.82, p > .05.
Because Hypothesis 3 was very focused, predicting significantly higher LEAD confidence ratings for BP-I versus other types of bipolar disorders, planned comparisons compared means (i.e., planned tests were determined before looking at the data).
40
nature of this project encouraged the research team to examine other relationships between clinician confidence and type of bipolar using post hoc analyses to make multiple
comparisons across bipolar groups. Because of significant findings on Levene’s test of equality of variances, p < .005, the Games-Howell statistic, which does not assume equality
of population variances, compared means. Results from Games-Howell indicate that
confidence ratings for BP NOS were significantly lower than confidence ratings for BP-II, p
< .05, and cyclothymic disorder, p < .05. Figure 2 shows “box and whisker” plots for both
Bayesian and LEAD confidence ratings by diagnosis.
Potential Moderators of Agreement between Nomogram and Clinical Confidence
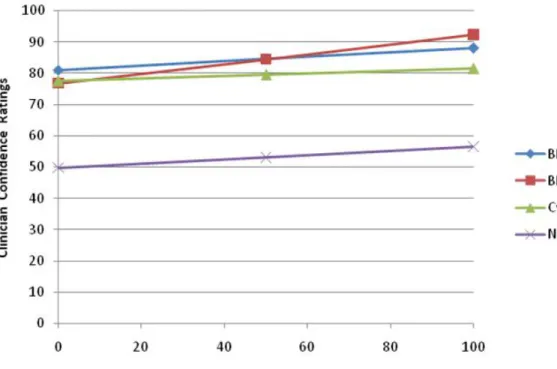
An OLS regression approach tested theprediction that type of bipolar moderates agreement between LEAD confidence ratings and Bayesian risk estimates. Specifically, the Bayesian estimate predicted the LEAD confidence score, along with dummy codes for bipolar type, and interaction terms for bipolar type with Bayesian estimates. The significance of the interaction terms was the direct test of the hypothesis. None of the interaction terms were significant, indicating that type of bipolar did not statistically moderate agreement between the LEAD and Bayesian estimates. The actuarial estimate was also not a significant predictor; however, this can be explained by its redundancy with the dummy codes for diagnoses. See Table 9 for unstandardized regression weights and associated tests of significance. Figure 3 shows the regression lines for the interaction terms: diagnosis by actuarial Bayesian estimate.
Generalizability of Nomogram Approach
41
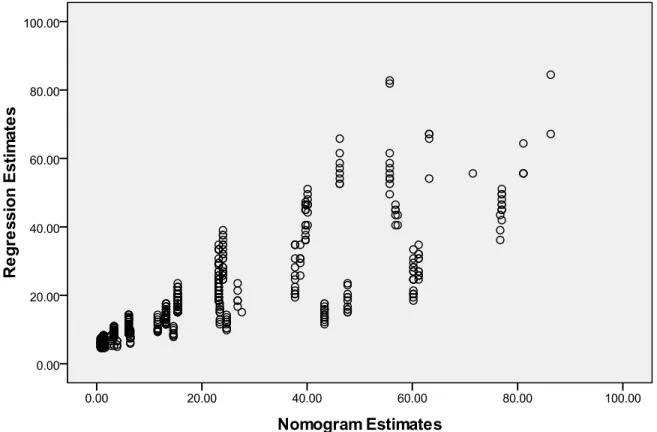
diagnosis using optimal weights for the sample (i.e., generalizability). The two estimates were highly correlated, as predicted r = .82, indicating a strong positive relationship (Cohen,
42 Discussion
Current Literature
PBD and EB assessment have been in the spotlight of both clinical and research communities as well as the media and popular press (e.g., Kluger & Song, 2002; Papolos & Papolos, 1999). A recurring theme emerges: clinical decision-making could greatly benefit from EB decision tools, particularly in diagnosing difficult, high-stakes conditions such as PBD. To the best of the author’s knowledge, to date no research has examined the
relationship between bipolar diagnoses using the current gold standard for clinical
assessment (a diagnosis based on the LEAD standard) versus taking an actuarial approach. The difficulty diagnosing PBD is well documented (Ghaemi, Sachs, Chiou, Pandurangi, & Goodwin, 1999; Hirschfeld, Calabrese et al., 2003); however, there is a dearth of information regarding the utility of EBA decision aids, such as the nomogram.
Despite large gaps in the extant literature, a few key findings warrant attention. Research suggests that clinicians are vulnerable to cognitive biases that often result in suboptimal diagnostic decisions (Croskerry, 2002; Galanter & Patel, 2005). PBD diagnoses have risen at alarming rates, with some estimates showing as much as a 40-fold increase in diagnoses over the last decade (Blader & Carlson, 2007; Moreno et al., 2007). Evidence indicates that PBD is frequently misdiagnosed (low accuracy, including low sensitivity), and research suggests that practitioners often overdiagnose PBD (low diagnostic specificity).
Present Study
The overarching goal of the present study was to compare the current gold standard
43
three study hypotheses tested particular aspects of the relationship between clinical and actuarial assessment methodologies, including agreement between clinician confidence and the nomogram; agreement about next clinical action; and, the relationship between clinician confidence and the nomogram. The final two study hypotheses examined relevant aspects of the individual approaches. Specifically, these hypotheses investigated potential moderators of agreement between the nomogram and clinician confidence, and the generalizability of the nomogram approach. Study findings have important research and clinical implications which are highlighted below.
Study Findings
A medium positive correlation was found between LEAD confidence ratings and Bayesian risk estimates. This finding supports the study prediction that clinician confidence and the nomogram would agree, suggesting a relationship between potent risk factors and clinician confidence. It is important to highlight, however, that clinician confidence was informed by the LEAD process- clinicians’ ratings reflect findings from the KSADS interview, detailed family history, and clinical chart information. In short, clinician
44
two would be stronger. In explanation, given that LEAD ratings tended to be higher than Bayesian predictions, clinicians may have been less confident in their bipolar diagnoses without the additional “supporting” information from the KSADS (i.e., LEAD ratings might have been lower overall and more closely aligned with actuarial estimates which tended to be more conservative).
When a threshold model was applied to LEAD confidence ratings and Bayesian estimates (Hypothesis 2), these different approaches evidenced fair agreement (Cicchetti et al., 2006; Landis & Koch, 1977). In other words, when estimates from both approaches were translated into clinical activities (e.g., a score of 85 is associated with beginning treatment for PBD), clinical and actuarial methodologies agreed to a moderate extent. This finding has important clinical implications. Gold standard clinical assessments are often not feasible in real-world practice. For example, issues related to insurance reimbursement and staff training can hinder a comprehensive assessment such as the KSADS. Moreover, many clinical
settings lack the resources to ensure acceptable administration of semi-structured diagnostic interviews which can result in unreliable diagnostic impressions and inappropriate treatment plans. The finding that the clinical and actuarial approaches agree at all both in terms of overall concordance and also in terms of deciding next clinical activities suggests that the nomogram represents a promising decision aid in settings that cannot routinely employ gold standard assessments. Because agreement is only found to be fair, clearly more work is needed to understand differences between these two approaches and what factors might further increase agreement.