Methods in
Statistical Genomics
In the Context of Genome-Wide Association Studies
RTI
Press
In the Context of Genome-Wide
Association Studies
©2016 RTI International. RTI International is a registered trademark and a trade name of Research Triangle Institute. The RTI logo is a registered trademark of Research Triangle Institute.
This work is distributed under the terms of a Creative Commons Attribution-NonCommercial-NoDerivatives 4.0 license (CC BY-NC-ND), a copy of which is available at https://creativecommons.org/licenses/by-nc-nd/4.0 /legalcode.
Library of Congress Control Number: 2016949391 ISBN 978-1-934831-16-8
(refers to print version)
RTI Press publication No. BK-0016-1608
https://doi.org/10.3768/rtipress.2016.bk.0016.1608
www.rti.org/rtipress Cover design: John Theilgard
The RTI Press mission is to disseminate information about RTI research, analytic tools, and technical expertise to a national and international audience. RTI Press publications are peer-reviewed by at least two independent substantive experts and one or more Press editors.
RTI International is an independent, nonprofit research institute dedicated to improving the human condition. We combine scientific rigor and technical expertise in social and laboratory sciences, engineering, and international development to deliver solutions to the critical needs of clients worldwide.
This publication is part of the RTI Press Book series. RTI International
3040 East Cornwallis Road, PO Box 12194 Research Triangle Park, NC 27709-2194, USA
Chapter 1. Overview of Chapters 1 Philip Chester Cooley
Chapter 2. Genome-Wide Association Data:
Where Are the Standards? 17
Philip Chester Cooley
Chapter 3. Creating the Synthetic Gene Data 31
Philip Chester Cooley
Chapter 4. Genetic Inheritance and Genome-Wide Association
Statistical Test Performance Using Simulated Data 37 Philip Chester Cooley, Robert F. Clark, Ralph E. Folsom,
and Grier Page
Chapter 5. The Influence of Errors Inherent in Genome-Wide
Association Studies (GWAS) in Relation to Single-Gene Models 49 Philip Chester Cooley, Robert F. Clark, and Grier Page
Chapter 6. Conducting Genome-Wide Association Studies (GWAS):
Epistasis Scenarios 65
Philip Chester Cooley, Nathan Gaddis, Ralph E. Folsom, and Diane Wagener
Chapter 7. Assessing Gene-Environment Interactions in Genome-Wide Association Studies (GWAS): Statistical
Approaches 85
Philip Chester Cooley, Robert F. Clark, and Ralph E. Folsom
Chapter 8. Polygene Methods in Genome-Wide Association
Studies (GWAS) 117
Philip Chester Cooley and Ralph E. Folsom
Chapter 9. Conclusions and Recommendations 143
Philip Chester Cooley
Acknowledgment 149
Contributors 151
Overview of Chapters
Philip Chester Cooley
CHAPTER 1
Introduction
The objective of this book is to describe procedures for analyzing genome-wide association studies (GWAS). Some of the material is unpublished and contains commentary and unpublished research; other material (Chapters 4 through 7) has been published previously. Each previously published chapter investigates a different genomics model, but all focus on identifying the strengths and limitations of various statistical procedures that have been applied to different GWAS scenarios.
The distinction between genotype and phenotype was initially presented by the Danish botanist, plant physiologist, and geneticist Wilhelm Johannsen in a book he published in 1905, The Elements of Heredity. He distinguished between the genotype of the organism (it is hereditary) and the ways in which its heredity is demonstrated in phenotypes, or physical characteristics. This distinction was an outgrowth of Johannsen’s experiments concerning heritable variation in plants.1
The Human Genome Project
The Human Genome Project (HGP) was an international scientific project with the goals of determining the sequence of chemical base pairs that make up human DNA and of identifying all of the physical and functional genes of the human genome. The HGP produced the first complete sequences of individual human genomes. As of 2012, thousands of human genomes had been completely sequenced, and many more had been mapped at lower levels of resolution. The resulting data have been used worldwide in biomedical science, anthropology, forensics, and other branches of science. With the mapping of the human genome near completion, researchers expected that subsequent genomic studies would lead to advances in our understanding of human evolution, and advances in many subfields of biology, particularly the diagnosis and treatment of many diseases.
To that end, researchers have worked to identify genes that constitute biomarkers using a combination of high-throughput experimental and bioinformatics approaches; nevertheless, the identification of biological functions of the protein and RNA products of DNA has only just begun. Recent results suggest that most of the vast quantities of noncoding DNA within the genome have biochemical activities that include regulating gene expression, organizing chromosome architecture, and producing signals that control epigenetic inheritance.2
A major aim of the HGP was to determine the functions of genes.
Researchers believed that once the complete genome sequence was developed, interpreting the sequence by comparing the intermediate messenger RNA and protein products would be straightforward and ultimately would identify the genetic factors that influence important phenotypes such as predisposition to certain diseases. The simple rationale behind GWAS is that if certain genetic variations are more frequent in persons with a given disease, the variations are said to be “associated” with the disease. The associated genetic variations serve as pointers to regions of the human genome that may be involved in causing the disease.
Genome-Wide Association Studies
Overview of Chapters 3
polymorphism (SNP) arrays. If one type of the variant (one allele, i.e., the “wild-type” allele) is more frequent in people with the disease, the SNP is said to be associated with the disease. The associated SNPs are then considered to mark a region of the human genome that influences the risk of the phenotype. Also, in contrast to methods which specifically test one or a few genetic regions, GWAS investigate the entire genome. The approach is therefore said to be non–candidate driven, in contrast to gene-specific candidate-driven studies. GWAS identify tag SNPs, which are defined as representative SNPs in a region of the genome with high linkage disequilibrium and other variants in DNA associated with a disease. Tag SNPs in isolation cannot specify which genes cause the phenotype.
The first successful GWAS investigated age-related macular degeneration and was published in 2005.3 This study found two SNPs that had significantly
altered allele frequency when compared with healthy controls. As of 2015, The
Catalog of Published Genome-Wide Association Studies contained more than
2,141 catalog entries, 1,856 publications and 12,874 implicated SNPs.4 Prior to
the introduction of GWAS, the major method of investigation was via genetic linkage studies in families. This approach was useful for identifying single-gene disorders, many of which appear in the comprehensive compendium of human genes and genetic phenotypes, the Online Mendelian Inheritance in Man (OMIM) database.5
However, for both common and complex diseases, the results of genetic linkage studies have been hard to reproduce.6,7 In contrast, GWAS seek
to identify whether the allele of a genetic variant is found more often than expected in individuals with the phenotype of interest. The statistical methods used in GWAS are based on traditional approaches, and early calculations of statistical power indicated that GWAS could be better than linkage studies at detecting weak genetic effects.8
In addition to a simple conceptual framework, the proliferation of GWAS has also been driven by improvements in sequencing methods, reduced computational costs, and the advent of biobanks, which are repositories of human genetic material that greatly reduce the cost and difficulty of collecting sufficient numbers of biological specimens for study.9,10 The development of
With improving genotyping technologies and the exponentially growing number of available markers, case-control GWAS have become a key tool for investigating complex diseases. To accommodate GWAS methods, researchers have developed new procedures to ensure data quality, interpret GWAS findings, and provide computationally tractable approaches when performing hundreds of thousands of individual tests.
The promise of GWAS was anticipated in many quarters of the scientific community.11 A 2007 fact sheet released by the National Human Genome
Research Institute, in the early days of GWAS, raised expectations that personalized medicine, including individual risk prediction, disease prevention, and specific treatment, was just around the corner. “With the first GWAS published in 2005, … health professionals will be able to use such tools to provide patients with individualized information about their risks of developing certain diseases … to tailor prevention programs to each person’s unique genetic makeup … to select the treatments most likely to be effective and least likely to cause adverse reactions… .”12 However, a number of critics of
GWAS argue that these expectations have not been met.13
GWAS: Useful or Misleading?
The overly high expectations were created in part because the early GWAS success predicting age-related macular degeneration with a complement factor H polymorphism was extreme, with an odds ratio (OR) of approximately 7.* In contrast, most GWAS implemented after that success involved variants conferring small effects, indicated by ORs slightly larger than 1.
Although medical science is still far from the GWAS-based personalized medicine promised in the National Human Genome Research Institute 2007 fact sheet, at least three important considerations fuel legitimate hope that genetics will become integral to a form of medicine more specifically tailored to individual patients.11 First, important discoveries have already changed
medical practice and resulted in medical policy codes for some treatments. For example, in the field of pharmacogenomics, researchers have already begun using genetic testing to determine patients’ dosage of warfarin.
Second, genetic interaction studies are starting to provide useful data. For example, researchers discovered that high-density lipoprotein cholesterol levels
Overview of Chapters 5
(HDL-C), one of the most important risk factors for coronary heart disease, are significantly influenced by the interplay of multiple genes linked to GWAS and involved gene-gene interaction effects.14
Third, GWAS are based on common variants (i.e., tag SNPs) that are frequently in linkage disequilibrium with the actual causative variant, which in turn may be associated with larger effect sizes than the common variant included in the GWAS. For instance, fine mapping of loci associated with low-density lipoprotein cholesterol (LDL-C) identified a rare nonsynonymous variant gene that explained 5 times more of the contributed variance than the initial GWAS finding. In this context, whole genome sequence data has the potential to be a more accurate and powerful tool than SNPs to elucidate the relationship between genetics and (common) diseases. However, even high-resolution genetic variation will only explain a fraction of the heritability of human diseases and traits. Thus, we are still searching for potential uses for genetics in medical science beyond using simple genetics with gene-gene and gene-environment interactions and identifying epigenetic effects as important but complex targets.
Missing Heritability
Heritability is a genetic measure that identifies the observable differences in a trait due to genetic factors between individuals within a population. Factors including genetics, environment and random chance can all contribute to the variation between individuals in their phenotypes.15 Heritability is a dynamic
measurement that identifies the fraction of phenotype variability that can be attributed to genetic variation. The term “missing heritability” refers to the low percentage of information about the overall genetic component and risk of common diseases gleaned from GWAS. Common variants account for only a small proportion of genetic components, and the missing heritability lies in the huge class of rare genetic variants that GWAS do not see. Variants that are primary drivers of disease are relatively rare in the human population.
Variants confer risk of disease, and natural selection acts against variants so that they do not become too prevalent. Therefore, the issue of so-called missing heritability becomes moot. We did not interrogate the whole genome; we interrogated the common variants that pass through the filter of natural selection. Many diseases, but not all, will involve rare variants not detected by GWAS.16
for example, variants selected in response to infectious agents that have consequences for autoimmune diseases.17
The inability of GWAS to replicate markers in this and other instances was a major concern, and in a set of New England Journal of Medicine articles three authors offer alternative opinions regarding the progress that GWAS methods have made to date. Hirshhorn argued that the main goal of these studies is not the prediction of genetic risks but rather the discovery of biological pathways underlying polygenic diseases and traits.18 Goldstein countered that the
genetic burden of common diseases must be carried mainly by large numbers of rare variants.19 He also suggested that most GWAS produced too many
associations with very small overall contributions toward explaining disease risk—too many to provide any useful biologic insights. Kraft and colleagues support the notion that the GWAS approach predicts that “many, rather than few, variant risk alleles are responsible for the majority of the inherited risk of each common disease. It is possible that these initial GWAS have identified only the strongest associations, with many more genes still to be identified.”20
Organization of the Book
Chapter 2: Genome Wide Association Data: Where Are the Standards?
Chapter 2 is a previously unpublished manuscript based on an internal study directed by Philip Cooley. Study participants included Huaqin Pan (RTI), Paul S. Levy (deceased), Maureen K. Bunger (formerly of RTI), and Laxminarayana Ganapathi (RTI Health Solutions).
We began our explorations into GWAS by applying statistical methods to real genetic (SNP) data. We used standard statistical approaches that appear in both GWAS and non-GWAS literature. The main objective of this venture was to see if we could assess the performance of different statistical methods used in a GWAS context. There have been many notable instances in which GWAS provided inconsistent results and there have been a number of studies have not been replicable. This has led to a question about the validity of the GWAS approach. For example, in 2008, the online listing A Catalog of Published
Genome-Wide Association Studies identified a total of 8 amyotrophic lateral
sclerosis (ALS) GWAS.4 Each of these 8 studies identified candidate ALS
Overview of Chapters 7
some possible genes linking ALS to genetic causes. By and large, no consistent markers have been universally accepted as ALS genetic markers.
We obtained the SNP data for the initial ALS study appearing in the literature21 and attempted to replicate some of the published results in
order to test statistical methods in genomics.21 We identified seven distinct
methods that have been or could be applied in GWAS studies. We also used the method that Schymick et al. used to obtain their results. At the time we performed these analyses, we were unaware of any comprehensive studies that compared the performance of the different methods in the context of GWAS, and we wanted to determine whether standards could be developed. Using a previously conducted study would allow us to assess the performance of specific statistical methods by using the study results as a yardstick by which to measure the accuracy of our results.
What we learned from this effort is that either many of the algorithms used in the literature in a GWAS context assume an additive gene model or are agnostic with respect to the form of inheritance. We also documented the inability of the ALS studies to replicate results—part of the problem with reproducing results is that ALS studies rely on having ALS patients as a study population, which means that the original sample sizes were relatively small due to circumstance. We were able to replicate the Schymick et al. study results using the method they chose to measure associations—the classic epidemiology case-control method that uses the Pearson χ2 test to text how
likely it is that an observed distribution of data fits with the distribution that is expected if the variables are independent. However, our assessment indicated that the reported results depended to an unknown degree on the statistical method used to make the predictions. This suggested that the algorithms selected could influence predictive outcome and further demonstrated the need for developing GWAS standards.
Chapter 3: Creating the Synthetic Gene Data
Chapter 3 describes the generic data generation process we used for the research described in Chapters 4 through 7. We used our simulated data in an effort to exploit a process with a known outcome to identify those traits that affect GWAS outcomes. These investigations took the form of (1) generating a database of synthetic genes that incorporated a number of dynamic properties that were varied for the explicit purpose of developing a “truth set” (i.e., a database of known outcomes); (2) testing a number of statistical models and competing algorithms that were developed to predict associations; and (3) creating a compendium of outcomes that linked gene properties to statistical model performance. This virtual gene resource enabled the power performance of different single-gene statistical methods to be measured and recorded. Consequently, this chapter describes the simulation model that generated the synthetic SNP data for all subsequent assessments represented in this book.
Chapter 4: Genetic Inheritance and Genome-Wide Association Statistical Test
Performance Using Simulated Data
Chapter 4 is based on a study that was published previously.22 This chapter
focuses on single-gene models and the statistical methods that effectively predict associations in a GWAS context. Here, we demonstrate that the choice of a statistical method can affect the power profiles of GWAS predictions. The initial step in a GWAS is to apply univariate statistical tests for each SNP marker in the data set. Applying the tests is methodologically straightforward. SNP-based tests are used to assess the likelihood of an association. In the simulation-generated gene data, the probability of the occurrence of the phenotype is regulated by an exogenously specified risk value that is a function of the genotype. This allows the “strength” of the genotype-phenotype signal to be controlled and power outcomes to be counted. Standard methods (e.g., χ2
Overview of Chapters 9
Our simulation studies confirmed the results of others23 that the gene
model or MOI was a major influence on statistical power. This was no surprise and it is well known that associations involving recessive MOI SNPs are much more difficult to detect than other MOI types. Gene traits that influence prediction accuracy had also been reported in other studies.24,25 They
demonstrated how the phenotype MOI assumption was a major influence on association prediction accuracy.
We compared the power profiles of GWAS using a number of statistical methods, including two that combine MOI-specific methods into multiple test measures. Because most GWAS investigations have not determined the specific gene model operating, many assume an additive model. Given that most models cited in OMIM are either dominant or recessive gene models, we investigated composite methods that did not make an additive assumption; rather, they used three component tests with three distinct MOI properties (dominant, recessive, and additive). We then compared the performance (from a statistical power perspective) of the composite tests as contrasted with methods that either assume a specific MOI gene model or are agnostic with respect to MOI. By combining recessive, additive, and dominant individual tests, we determined that if the MOI is not known, then a composite test is more likely to make a correct association prediction. In that sense, it constitutes a more powerful test and could have significant advantages with respect to single test procedures.
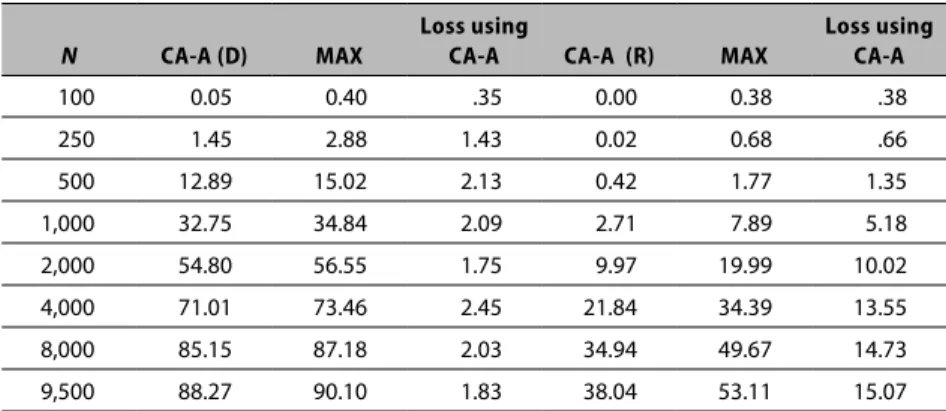
Our findings did not provide a specific answer about which statistical method is best. The best method depends on the MOI gene model associated with the phenotype (diagnosis) in question and how common the traits are that associate with the phenotype. However, our results do indicate that the common additive assumption that the MOI of the locus is associated with the diagnosis can have adverse consequences. It indicated that researchers should consider a multitest procedure that combines the results of individual MOI-based core tests as a statistical method for conducting the initial screen in a GWAS. The process for combining the core tests into a single operational test can occur in a number of ways. We identify two: the Bonferroni procedure and the MAX procedure, each of which produces very similar statistical power profiles.26,27 This was a surprising result because the Bonferroni procedure
was based on combining χ2 tests and assumed that the tests were mutually
normal distribution tests and adjusted for the covariance properties between individual tests.
In summary, the focus of this chapter is on single-gene statistical methods that predict associations in a GWAS context. We used simulation methods to learn that there is no single, most powerful method. If the properties of the gene model are not known, the most powerful approach is a composite test that uses a recessive-dominant-additive composite model. We also found that regardless of whether the MOI is known or not, there always exists a method that outperforms (in a statistical power context) the Pearson χ2 test.
Chapter 5: The Influence of Errors Inherent in GWAS in Relation to
Single-Gene Models
Chapter 5 is based on a study that was published elsewhere.28 This chapter
describes our investigation of the effects of errors in both genotype and phenotype misclassifications. The central objective is to assess the impact that these errors have on the additional sample size required to achieve a specific power threshold, which for this study is set to 80 percent. Usually, GWAS are conducted assuming that the study measurements are error free. This chapter discusses the assembled evidence challenging that assumption and the examples we used to assess the consequence of those assumptions.
We simulated the effects of genotype errors by intentionally mislabeling the genotype X percent of the time, where X is an exogenously provided model parameter. It was our assumption that genotype errors due to incorrect chip assignments affect both genotypes by incorrectly switching the designation of the disease versus nondisease genotype. We used a similar approach to process phenotype errors that are assumed to affect disease diagnosis. In this process, the simulation data will be recoded to simulate a diagnosis switch from a positive to a negative outcome and vice versa Y percent of the time, where Y is also an exogenously provided user parameter. In general, we assumed that the value of X was less than 1 percent. We posed a much higher value for Y because estimates in the literature report disease misdiagnoses could be as high as 29 percent.29 These features allowed us to assess the individual or
Overview of Chapters 11
Phenotypic misclassification errors are also a source of bias and can reduce the power of detecting a statistical association between a phenotype and a specific allele.30,31 To help provide insight into the influence of
simultaneous genotype and diagnosis errors affecting the accuracy of the phenotype measure in a GWAS, we ran simulations with synthetically generated data. We focused on assessing how statistical power was affected by the influence of these frequently overlooked sources of errors in GWAS. Our simulations demonstrated that genotype (even at low error rates) and phenotype (diagnosis) errors produce substantial power losses for all MOIs, with significant power losses for recessive MOIs. Because GWAS involving recessive loci have additional power requirements relative to other MOI types, researchers need to address these requirements in developing appropriate sample sizes for their studies.
In summary, this chapter identifies the significant role that epigenetics effects and diagnosis misclassifications can play in designing tests with realistic power levels.
Chapter 6: Conducting GWAS Epistasis Scenarios
Chapter 6 is based on a study that was published previously.32 This chapter
presents the results of our investigations of analyzing epistatic scenarios in GWAS. We used a qualitative association model to assess the statistical models that reliably predict associations between a qualitative phenotype (i.e., a disease diagnosis) and a pair of interacting genes. We employ the concept of relative risk, which is the ratio of the probability of a positive diagnosis given a mutated genotype divided by the probability with no risk present. We used a simulation approach to generate synthetic data corresponding to a variety of possible epistatic models (EMs). Our method took into account the strength of association, disease prevalence in nonrisk populations, and most importantly, the inheritance patterns of the pair of epistatic genes. We analyzed the
simulated gene data to assess how these individual factors influenced statistical power in the context of GWAS.
surprising and has been reported by others. An additional significance of our study is that it incorporates new statistical methods as part of the comparison analysis. We also documented the extent to which single-gene models fail to predict associations involving interacting genes with phenotypes constructed to be associated with low risk. Also, each gene MOI affects the ability to identify the association, which further confounds the GWAS methodology.
Chapter 7: Assessing Gene-Environment Interactions in GWAS: Statistical
Approaches
Chapter 7 is based on a study that was previously published by RTI Press.33
Environmental influencing factors on GWAS are described in Chapter 7. Classical statistical tests derived from case-control experiments can be used to determine if two loci associate in a GWAS context. But this model depends on a narrow range of environmental submodel formulations. In this scenario, logistic regression models are versatile approaches because they are able to examine main effects, pairwise interaction assumptions, or both. One early study investigating gene-gene interactions showed that explicitly modeling interactions between loci for GWAS with hundreds of thousands of markers is computationally feasible.34 In this chapter, we also show that simple methods
explicitly considering interactions can actually achieve reasonably high power with realistic sample sizes under different interaction models with some marginal effects, even after adjusting for multiple testing using the Bonferroni correction.
In this chapter, we also focus on low-effect/rare-variant loci with low relative risks of association with disease diagnosis. The overarching goal is to identify which statistical methods best identify genotype-phenotype associations when environmental effects also influence the association. Detecting such associations is particularly difficult for genetic variants with modest impacts on risk. Consequently, our experiments specifically investigated scenarios involving low-risk genetic variants and assessed whether environmental influences with varied levels of risk could be a source of the “missing heritability” observed using single-gene models.35 Not surprisingly,
Overview of Chapters 13
Chapter 8: Polygene Methods in GWAS
Chapter 8 proposes a novel strategy for studying the association between large sets of SNP predictors and groups of correlated phenotypes (i.e., outcomes). These data commonly arise in GWAS, in which associations with a large number of qualitative and quantitative phenotypes are investigated using hundreds of thousands of genetic markers. Our strategy is formulated within the linear–log linear models, a framework suited to the analysis of qualitative trait responses.
Our approach is based on the assumption that single-locus models do not detect all of the markers that are part of the phenotype pathway. In Chapter 6, we showed that for a given locus, single-locus tests are not as effective as two-locus tests. Despite these empirical arguments, which are based on computational considerations, single-gene models remain the core method for detecting associations in a GWAS context. Accordingly, our general strategy is to make an initial pass against all usable SNP autosomes and apply a significance threshold to identify highly significant SNP-phenotype associations, known as stage 1 SNPs. The second step statistically combines the stage 1 SNPs with all original autosome SNPs to identify significant SNP pairs that are phenotype-associated. This step uses a test for significance that is conditional on the stage 1 SNP. We then propose to continue this process for triple SNPs, quadruple SNPs, and so on until the combination of loci produces no new SNP-phenotype associations. This process is analogous to a stepwise regression process, in which networks of SNPs are combined stage by stage until no new SNPs exceed the significance threshold.
Chapter 9: Conclusions
We also developed a general polygene test (Chapter 8) that builds up a network of SNPs that link to a single phenotype. A reliable single-gene model is still necessary to identify a starting SNP in the polygene process. However, during this initial pass, the inheritance properties of the genes to which the SNPs belong are predicted with high reliability. We then use the inheritance properties of the SNPs in the step-by-step association process. Knowing the inheritance improves the performance with respect to the statistical power of our polygene process.
Chapter References
1. Johannsen WL. Arvelighedslærens elementer (the elements of heredity). Copenhagen, Denmark: Gyldendalske Boghandel Nordisk Forlag; 1905. 2. Alberts B, Johnson A, Lewis J, et al. Molecular biology of the cell. 4th ed.
New York, NY: Garland Science; 2002.
3. Klein RJ, Zeiss C, Chew EY, et al. Complement factor H polymorphism in age-related macular degeneration. Science. 2005;308(5720):385-9. 4. Burdett T, Hall P, Hasting E, et al. The NHGRI-EBI Catalog of published
genome-wide association studies. 2015 [cited 2015 Nov 2]; Available from: www.ebi.ac.uk/gwas
5. McKusick-Nathans Institute of Genetic Medicine, Johns Hopkins University School of Medicine. Online Medelian Inheritance in Man (OMIM). 2016 [cited 2016 Feb 11]; Available from: http://www.ncbi.nlm. nih.gov/omim
6. Altmuller J, Palmer LJ, Fischer G, et al. Genomewide scans of complex human diseases: true linkage is hard to find. Am J Hum Genet. 2001;69(5):936-50.
7. Strachan T, Read A. Human molecular genetics. New York, NY: Garland Science; 2010.
8. Risch N, Merikangas K. The future of genetic studies of complex human diseases. Science. 1996;273(5281):1516-7.
9. Ardini MA, Pan H, Qin Y, et al. Sample and data sharing: observations from a central data repository. Clin Biochem. 2014;47(4-5):252-7. 10. Greely HT. The uneasy ethical and legal underpinnings of large-scale
Overview of Chapters 15
11. Klein C, Lohmann K, Ziegler A. The promise and limitations of genome-wide association studies. JAMA. 2012;308(18):1867-1868.
12. National Human Genome Research Institute. Genome-wide association studies. 2007 [cited 2014 Mar 22]; Available from: http://www.genome. gov/20019523
13. Macarthur D. Bioscience Resource Project critique of modern genomics: a missed opportunity. 2010 [cited 2015 Nov 2]; Available from: http://www. wired.com/2010/12/bioscience-resource-project-critique-of-modern-genomics-a-missed-opportunity/
14. Hindorff LA, Sethupathy P, Junkins HA, et al. Potential etiologic and functional implications of genome-wide association loci for human diseases and traits. Proc Natl Acad Sci U S A. 2009;106(23):9362-7. 15. Raj A, van Oudenaarden A. Nature, nurture, or chance: stochastic gene
expression and its consequences. Cell. 2008;135(2):216-26.
16. Wagner MJ. Rare-variant genome-wide association studies: a new frontier in genetic analysis of complex traits. Pharmacogenomics. 2013;14(4):413-24.
17. Hu X, Daly M. What have we learned from six years of GWAS in autoimmune diseases, and what is next? Curr Opin Immunol. 2012;24(5):571-5.
18. Hirshhorn JN. Genomewide association studies—illuminating biologic pathways. N Engl J Med. 2009;360(17):1699-1701.
19. Goldstein DB. Common genetic variation and human traits. N Engl J Med. 2009;360(17):1696-1698.
20. Kraft P, Hunter DJ. Genetic risk prediction--are we there yet? N Engl J Med. 2009;360(17):1701-1703.
21. Schymick JC, Scholz SW, Fung HC, et al. Genome-wide genotyping in amyotrophic lateral sclerosis and neurologically normal controls: first stage analysis and public release of data. Lancet Neurol. 2007;6(4):322-8. 22. Cooley P, Clark R, Folsom R, et al. Genetic inheritance and genome
wide association statistical test performance. J Proteomics Bioinform. 2010;3(12):321-325.
24. Freidlin B, Zheng G, Li Z, et al. Trend tests for case-control studies of genetic markers: power, sample size and robustness. Hum Hered. 2002;53(3):146-52.
25. Sasieni PD. From genotypes to genes: doubling the sample size. Biometrics. 1997;53(4):1253-61.
26. Johnson RC, Nelson GW, Troyer JL, et al. Accounting for multiple comparisons in a genome-wide association study (GWAS). BMC Genomics. 2010;11:724.
27. Li Q, Zheng G, Li Z, et al. Efficient approximation of P-value of the maximum of correlated tests, with applications to genome-wide association studies. Ann Hum Genet. 2008;72(Pt 3):397-406.
28. Cooley P, Clark RF, Page G. The influence of errors inherent in genome wide association studies (GWAS) in relation to single gene models. J Proteomics Bioinform. 2011;4:138-144.
29. Kircher T, Nelson J, Burdo H. The autopsy as a measure of accuracy of the death certificate. N Engl J Med. 1985;313(20):1263-9.
30. Gordon D, Finch SJ, Nothnagel M, et al. Power and sample size calculations for case-control genetic association tests when errors are present: application to single nucleotide polymorphisms. Hum Hered. 2002;54(1):22-33.
31. Barendse W. The effect of measurement error of phenotypes on genome wide association studies. BMC Genomics. 2011;12:232.
32. Cooley P, Gaddis N, Folsom R, et al. Conducting genome-wide association studies: epistasis scenarios. J Proteomics Bioinform. 2012;5(10):245-251. 33. Cooley PC, Clark RP, Folsom RE. Statistical methods that identify
genotype-phenotype associations in the presence of environmental effects. RTI Press Publication No. RR-0022-1405. Research Triangle Park, NC: RTI Press; 2014.
34. Marchini J, Donnelly P, Cardon LR. Genome-wide strategies for detecting multiple loci that influence complex diseases. Nat Genet. 2005;37(4):413-7.
Genome-Wide Association Data:
Where Are the Standards?
Philip Chester Cooley
CHAPTER 2
Introduction
In this chapter we assess the predictive strength of a number of classical statistical methods by applying them to a publically available set of amyotrophic lateral sclerosis (ALS) data reported in a paper by Schymick and colleagues (2007).1 We used these methods in the context of a single
locus genome wide association study (GWAS) experiment. The methods are compared and the degree of similarity/dissimilarity between them is empirically measured to determine if a combination of methods is more predictive of phenotype genotype associations than a single method. All of the methods in our assessment are single nucleotide polymorphism (SNP) based.
There are three types of ALS: classic sporadic, familial, and the Mariana Island forms. Classic ALS accounts for 90 to 95 percent of ALS patients in the United States and is called “sporadic” because it cannot be traced to ancestors with the illness.2 The literature identifies variations and mutations in many
Mendelian loci and genes that potentially cause different forms and subtypes of ALS, indicating that many complex and diverse molecular mechanisms are involved in ALS pathogenesis. These genes include SOD1, ALS2, SETX, and VAPB for familial ALS, and VEGF, ANG, HFE, SMN, and PON1 for sporadic ALS. Research has also reported that the inheritance pattern varies with the type of ALS, including autosomal dominant, autosomal recessive, X-linked dominant and maternal through mitochondrial genes.3-5
Despite these complexities, ALS researchers have intensified their
and each team had reported a different set of ALS markers. Subsequently, eight additional studies13-20 have been reported in the literature. These results have
led to conjectures that using the GWAS method to search for ALS genes may have to accommodate a spectrum of genes, each of which contribute to ALS in some unknown manner. The failure of the different studies to replicate each other’s results also suggests that GWAS may be inconsistently implemented, or population admixtures are obscuring the findings.
The first GWAS for ALS found no SNPs significantly associated with the disease.1 However, published studies that followed implicated several different
ALS genetic markers. For example, Dunckley and colleagues6 identified an
SNP located in the FLJ10986 gene. This study consisted of 1,152 patients diagnosed with sporadic ALS and 1,297 controls. The initial discovery was made on analysis done on 386 cases and 547 controls, all of whom were of European descent and older than 65. A residual sample of 766 cases and 750 controls, as well as a subsample of the data identified in the Schymick study, were used to replicate the discovery analysis.6 A third ALS study reported that
the inositol 1, 4, 5-triphosphate receptor 2 (ITPR2) marker was associated with ALS. This study pooled three European populations with 1,337 ALS patients and 1,356 controls.7 A fourth study (by the same team as the third
study) identified an SNP in the dipeptidyl-peptidase 6 (DPP6) gene that was strongly associated with ALS susceptibility.8 However, the ITPR2 marker was
no longer significant. A fifth study examined an Irish population, which was augmented with a Dutch and a US population consisting of 958 ALS cases and 932 controls, and confirmed an association with the DPP6 marker.21
However, a sixth study sought to confirm the DPP6 marker finding by examining the Irish ALS cohort data and augmenting it with a Polish cohort. Cronin and colleagues,21 reported that their analysis of the combined cohorts
that consisted of 1,267 cases and 1,336 controls was unable to identify any associations including the previously reported DPP6 marker.21 A seventh
study, performed by Chiò et al.,9 used a two-stage analysis that consisted
of 553 cases and 2,338 controls: it identified two new markers, but markers mentioned previously, including DPP6.
Genome-Wide Association Data: Where Are the Standards? 19
Subsequent to our decision to pursue simulation methods to assess GWAS-appropriate methods, nine additional ALS related GWAS were identified in the literature. Blauw et al.10 investigated the role of copy number variants (CNVs)
as a source of genetic variation for 406 ALS cases and 406 controls and were unable to identify a locus associated with sporadic ALS. Another study by Landers et al.22 implicated the KIFAP3 gene that was associated with increased
survival in sporadic ALS. An additional GWAS by van Es et al.23 used two
cohorts to implicate an SNP (rs12608932) located in the UNC13A gene. This gene is known to code proteins that are presynaptic proteins found in central and neuromuscular synapses that regulate the release of neurotransmitters, peptides, and hormones. This same study also showed genome-wide significance for two additional SNPs located in chromosome 9p21. A GWAS by Laaksovirta et al.24 was able to confirm that genes on chromosome 9p21
and suggested that it could be a major cause of familial ALS in a Finnish population. A further study by Shatunov et al.25 provided additional evidence
that two SNPs in a locus on chromosome 9p21 were associated with ALS. The International Consortium on Amyotrophic Lateral Sclerosis26 conducted a
meta-analysis of ALS samples consisting of 4,243 ALS cases and 5,112 controls from 13 European and US cohorts and provided additional evidence for the loci on UNC13A and chromosome 9p21. However, a study by Daoud et al.27
could not confirm this result in a relatively small population (285 cases and 285 controls) of French ALS subjects. As a result of increased incidence of ALS in US veterans, Kwee et al.28 conducted a GWAS of ALS outcome and survival
time in a sample of US veterans. They report no SNPs reached genome-wide significance in the discovery phase for either phenotype. A final GWAS by Deng et al.29 on a Chinese population reported finding two additional
susceptibility loci that were not reported in other studies.
Methods
Our study assessed the statistical methods that have appeared in the GWAS literature and included a number of established methods used by the cited studies. We applied each of these methods to the ALS data of Schymick and colleagues1 and provide a method of comparing their relative performance.
The Schymick et al. (2007) ALS data set
Infinium assay humanhap550. Infinium assays assess haplotype tagging SNPs based upon Phase I+II of the International HapMap Project. The genotype data we used in this study consists of 555,352 SNPs from 276 ALS patients and 271 neurologically normal controls. These data are publicly available to the scientific community.1
The Statistical Tests
In a simple GWAS analysis, we rely on individual statistical tests of each typed SNP to identify potential associations. For any of the statistical methods considered for measuring associations, we can represent the sample genotype data or the sample allele data in a contingency array stratified by cases and controls. Under a null hypothesis of no association with the phenotype, we expect no difference between the frequencies across cases and controls. In general, this is the strategy behind all of the statistical methods considered. However, the methods make different operational assumptions that produce very different measures of association.
Testing a person’s DNA for more than half a million SNPs will produce many spurious associations. For example, if there were no actual associations, 500,000 independent tests using a p<.0001 criterion would be expected to identify 50 candidate genes. Statistical methods can correct for this, but they can also obscure real associations and produce both false positive and false negative associations. For this study, we are using the data generated by the Illumina 550K chip, which has an SNP about every 5 kb. Also, loci near each other might not be mutually independent. The general strategy for protecting against type I errors is by setting a stringent statistical significance threshold.
Each locus is screened to establish if there is sufficient information to apply the statistical procedures. The method we used is based on the procedure defined by Zeggini and colleagues.30 SNPs are considered eligible if the minor
allele frequency (MAF) exceeds 1 percent in both cases and controls. These restrictions help protect against computational difficulties caused by data sparseness in our statistical calculations. Another purpose of any eligibility test is to determine if there is sufficient representation of all genotypes to perform an accurate statistical test.
We investigated a number of statistical tests to use in our assessment including the following.
The Case-Control Genotype Method, Based on the Pearson χ2 Test. This classic
Genome-Wide Association Data: Where Are the Standards? 21
with 2 degrees of freedom to test the hypothesis that the cases and controls are from the same distribution. Under the null hypothesis of no association with disease, we expect the relative genotype frequencies to be the same in cases and controls. These types of methods are commonly used in the GWAS context. A case-control study uses the odds ratio to estimate the relative risk and assumes that the disease under study has a low incidence. When the risk ratio is the parameter of interest, the assumption of rarity is needed for the odds ratio to be a consistent estimator.31,32 This method was used in the original Schymick
study.
Normal Approximation to Fisher’s Exact Test—Dominant and Recessive Models. The
null hypothesis behind Fisher’s test is that the rows (phenotype) and columns (genotypes) are unrelated. The test calculates an exact probability value for the relationship between three dichotomous variables, as found in a 2 × 3 table. When N (the number of subjects) is large, the exact form of the Fisher test is difficult to calculate. Therefore, a normal approximation is used. Because the test estimates the probability of a given genotype using the marginal values and assumes the probability is from a normal curve, an autosomal recessive and dominant version of the test is easily implemented. We used both forms in our assessment, listed as Fis-D and Fis-R in Table 2.1.
Logistic Regression Linear and Categorical Model Tests. The logistic regression
test (Log-A) assumes an additive mode of phenotype inheritance and regresses case control outcomes using the number of minor alleles as the dependent variable. In the Log-A test, the null hypothesis β1 = 0 is used to test if the number of alleles associates with the phenotype variable.33
Table 2.1. Correlation values for eight statistical tests based on unadjusted p-values
Test
Name Fis-D Pea Tr-A All Fis-R Tr-D Log-A Tr-R
Fis-D 1.0 -.0472 -.0544 -.0535 0.2215 -.0947 -.0551 -.0041
Pea -.0472 1.0 0.4861 0.4832 -.0651 0.4818 0.4874 0.4793
Tr-A -.0544 0.4861 1.0 0.9843 -.0105 0.5294 0.9973 0.0821
All -.0535 0.4832 0.9843 1.0 -.0104 0.5269 0.9834 0.0811
Fis-R 0.2215 -.0651 -.0105 -.0104 1.0 -.0026 -.0107 -.1677
Tr-D -.0947 0.4818 0.5294 0.5269 -.0026 1.0 0.5299 0.0020
Log-A -.0551 0.4874 0.9973 0.9834 -.0107 0.5299 1.0 0.0822
Tr-R -.0041 0.4793 0.0821 0.0811 -.1677 0.0020 0.0822 1.0
Cochran-Armitage Trend Tests: Recessive, Additive, and Dominant Models. The
classical Cochran-Armitage test assumes an additive mode of inheritance (MOI) and is typically used in categorical data analysis when some categories are ordered. The test is sensitive to the linearity between phenotype and genotype variables and detects trends that would not be noticed by other tests.34 It also uses weights applied to each genotype variable to generalize the
method. For example, a weight of 0.0, X, or 1.0 (where 0 ≥ X ≤ 1) can be used to assume different MOI assumptions: recessive (X = 0), additive (X = .5) or dominant (X = 1) locus. The method is discussed by Zheng and Gastwirth.35
We use all three test assumptions in our assessment and identify them as Tr-R, Tr-A, and Tr-D, respectively, in Table 2.1.
Allele Test. This is a commonly used test for association in a 2 × 2
contingency table, in which cases and controls are classified as carriers of the minor, risk-carrying allele. This is a 1 degree of freedom (1df) test that assumes dominance on a single allele. This test constructs a 2 × 2 allele table (case control by the two alleles) and uses a Pearson χ2 (CHI2) test (1df) to test the
hypothesis that the cases and controls are from the same distribution.32
Results
A fundamental question this study seeks to address is “which method should investigators use to assess candidate associations?” No one has yet answered this question. One obvious partial answer is that it depends on the gene behavior, as well as a number of other biological factors yet to be determined. Consequently, if we assume an additive gene model, then the likelihood of establishing the association between genotype and phenotype will be nearly the same whether or not one uses any of the three additive-based tests.
Test Performance
In an attempt to address the question above, we created a 2 × 3 table of counts of case-control subjects by genotype counts for each locus. We then added the marginal values and provided the necessary information to apply the eligibility criteria to eliminate loci with low minor genotype representation. The data provides information on 555,352 loci, of which 538,234 are autosome loci. Applying a standard quality control method described by Zeggini et al.30
Genome-Wide Association Data: Where Are the Standards? 23
that the statistical tests differ in the MOI assumption and therefore should provide different results. However, Table 2.1 indicates that although some of the MOI-based tests (i.e., the additive tests) produce consistent results, the dominant based tests (Tr-D and Fis-D: correlation coefficient = -.0947), and the recessive based tests (Tr-R and Fis-R correlation coefficient = -.1677) are not correlated. The Pearson test is MOI agnostic and would be expected to overlap with the other tests, and although they both capture 48 percent of the correlation space represented by many of the other tests, they have only a small negative correlation with both of the Fisher tests. Thus, Table 2.1 illustrates that all of the tests historically used in GWAS incorporate different assumptions and consequently have differences in the way they measure association. Based on results presented here, we assert that if the MOI characteristics of the associated loci are unknown, then researchers should consider multiple tests treated in a nonhierarchal manner.
In addition, Table 2.1 suggests a correlation between the three tests (Tr-A, Log-A, and All) that assume additive MOI properties. This suggests that no additional predictive power for measuring associations is derived from using more than one of these three tests; that weak correlation between the two tests (Tr-R and Fis-R) that assume recessive MOI properties and weak negative correlation between the Fisher dominant MOI test (Fis-D) and all of the other tests except the Fisher recessive MOI test (Fis-R), which implies that these tests measure a dimension that is different from all of the other tests.
Marker Assessment
This section compares our results directly to those of Schymick and colleagues1
and indirectly to other results reported in the literature.
Schymick et al. (2007).The Schymick and colleagues study1 reports using
six association tests: the genotypic test, two versions of the trend test (the dominant and additive tests), a recessive model test, an allele-based test, and a three-marker haplotype-association test. We included their five-loci-based tests in the tests we ran.
We applied the Pearson test, the recessive version of the trend test, and the additive version of the logistic regression test to the same data. A summary of these results is presented in Table 2.2 below. It compares the top 34 SNPs reported by Schymick and colleagues1 with our results. We found that all 34
were positive at the e-4 level of significance based on the Pearson test but that
Table 2.2. Comparison between the results of our study and the Schymick et al. study
SNP ID Chrom.$ Location Gene Pea Tr-R Log-A
rs4363506 10q26.13 129164493 Intergenic <.000001 <.005 <.000001
rs16984239 2p24 18097927 Intergenic <.00001 X <.00001
rs12680546 8q24.2 136940921 Intergenic <.0001 X <.001
rs6013382 20q13.2 50136040 ZFP64 <.00001 X <.01
rs2782931 9q31.3 113890011 SUSD1 <.00001 <.0001 X
rs11099864 4q31.3 154112804 KIAA1727 <.00001 <.0005 X
rs332389 3p14.1 $66493904 SLC25A26 <.0001 <.01 X
rs4964213 12q23.3 106274907 BTBD11 <.0001 <.0001 <.0001 rs10765118 10q26.13 129175173 Intergenic <0001 <.00001 <.0001 rs3733242 4q21.1 77894529 SHROOM3 <.0001 <.00001 <.0001
rs1037666 1q43 238425108 FMN2 <.0001 X <.001
rs1436918 15q14 32724213 LOC390569 <.0001 <.0001 X
rs4552942 8q24.2 136943505 Intergenic <.0001 X <.001
rs852801 1p32.2 58094497 DAB1 <.0001 <.00001 <.001
rs852802 1p32.2 58096531 DAB1 <.0001 <.00001 <.001
rs7250467 19q12 33261241 LOC727771 <.0001 <.0001 <.0001 rs10830099 10q26 129174355 Intergenic <.0001 <.0001 < 0001
rs10459680 15q26 91482474 Intergenic <.0001 X <.001
rs1752784 9q22.32 96217647 HIATL1 <.0001 <.00001 <.01
rs1202824 1p32.2 58121593 DAB1 <.0001 X <.01
rs5014235 5q14.1 77245417 Intergenic <.0001 <.01 <.0001
rs7201419 16q23.3 81887480 CDH13 <.0001 <.0001 <.01
rs11933187 4q31.3 175446507 KIAA1717 <.0001 <.0001 <.001
rs10773543 12q24.32 127489679 TMEM132C <.0001 X <.001
rs7976059 12q13 50537539 Intergenic <.0001 <.0001 <.001
rs9608416 22q12.1 24441018 ADRBK2 <.0001 <.01 X
rs2220999 12q12 40422035 Intergenic <.0001 <.01 <.0001 rs12632457 3p24 27995556 Intergenic <.0001 <.01 <.0001
rs2272519 2p24 18575231 Intergenic <.0001 <.05 X
rs2289599 5q14.1 77243905 Intergenic <.0001 <.05 <.0001
rs4478530 8p12 31517686 Intergenic <.0001 <.05 X
rs130110 22q13.32 47470399 FAM19A5 <.0001 X <.0001
rs9510982 13q12 23451861 Intergenic <.0001 <.0001 X
rs2767584 6p21 156964439 Intergenic <.0001 X X
Total < e-4 34 13 12
Fis-D = Fisher dominant test; Pea = Pearson χ2 test; Tr-A = trend additive test; All = allelic test; Fis-R = Fisher recessive test; Tr-D = trend dominant test; Log-A = logistic linear test; Tr-R = trend recessive.
$Chromosome location of single nucleotide polymorphism (SNP).
Genome-Wide Association Data: Where Are the Standards? 25
10-4 criteria according to the Trend-R test and 12 were positive according to
the Logistic-A test.
Thus, 12 of 34 association tests at the e-4 level overlap between the
MOI-agnostic Pearson test and both the recessive Tr-R test and the Log-A test. We can therefore replicate the Schymick et al. results but only if we use the Pearson test, which is commonly used for GWAS. The Trend-A test is equally popular. However, if another MOI-specific test had been used instead, we could not have replicated the results.
Other ALS GWAS. The year we first investigated the Schymick et al.1 ALS
GWAS study, there were seven other GWAS also published on ALS. These studies were Dunckley et al.6; van Es et al.7,8; Blauw et al.10; Cronin et al.11,12;
and Chiò et al.9 The focus of the Blauw et al.10 study was unique. It investigated
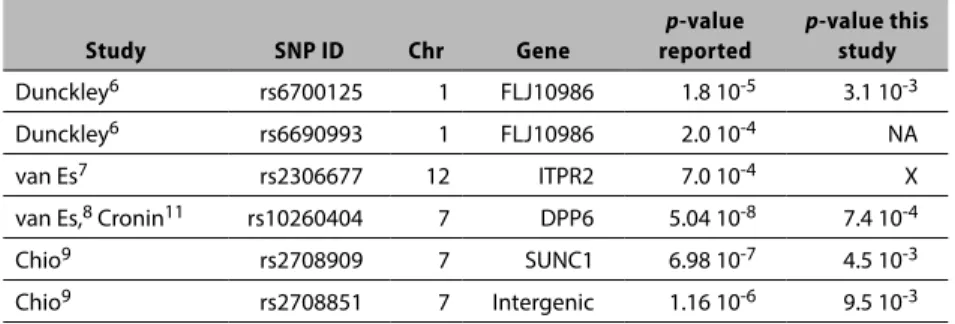
copy number variations, and the reported results were negative. We examined the top markers reported in the remaining six studies and summarize that information in Table 2.3. The DPP6 marker first identified by van Es et al.8
is worth mentioning because it was also reported in one of the Cronin et al. studies.11
Table 2.3. Association test results of SNPs identified as significant in other studies
Study SNP ID Chr Gene
p-value
reported
p-value this
study
Dunckley6 rs6700125 1 FLJ10986 1.8 10-5 3.1 10-3
Dunckley6 rs6690993 1 FLJ10986 2.0 10-4 NA
van Es7 rs2306677 12 ITPR2 7.0 10-4 X
van Es,8 Cronin11 rs10260404 7 DPP6 5.04 10-8 7.4 10-4
Chio9 rs2708909 7 SUNC1 6.98 10-7 4.5 10-3
Chio9 rs2708851 7 Intergenic 1.16 10-6 9.5 10-3
NA = SNP not included on chip; X = not significant at any level; SNP = single nucleotide polymorphism.
The results summarized in Table 2.3 identify a p-value < 10-3 for one of
Finally, we examined the PON1 gene that was reported to be associated with sporadic ALS in genetic studies by more than one study. 36,37 All tested
nonsignificant.
Conclusions
We used publicly available data that contained 276 cases and 271 controls. This sample is very underpowered, with many SNPs containing few disease alleles. The SNP coverage may also have been insufficiently dense. Although the SNPs on the chip are tag SNPs that were selected to represent all the genes in a comprehensive manner, the selection may not have included all the potential markers for a specific disease. Other explanations are that the sample of individuals was too heterogeneous, resulting in the study populations with distinct disease penetrance traits; the strength on the association was too weak to be detected; errors in the data perturbed the measurements; or the phenotype definition differed across studies. Novel statistical methods cannot overcome the problems inherent in poor quality data containing too few subjects, or data that uses a poorly defined phenotype (i.e., an ALS diagnosis).
We found that different statistical tests varied significantly in estimating the test association measurement, implying that GWAS results depend on the chosen statistical method. We also find that there is no compelling standard that establishes which statistical methods investigators should use in the context of GWAS with unknown MOI properties. Although GWAS have used and reported findings for a number of different tests, most tests have unique properties and consequently can prescribe a different candidate set of phenotype SNP associations. In general, the p-value threshold is Bonferroni corrected to a very small value, which encourages high type II error rates.38
Genome-Wide Association Data: Where Are the Standards? 27
Chapter References
1. Schymick JC, Scholz SW, Fung HC, et al. Genome-wide genotyping in amyotrophic lateral sclerosis and neurologically normal controls: first stage analysis and public release of data. Lancet Neurol. 2007;6(4):322-8. 2. MedicineNet.com. Amyotrophic lateral sclerosis (ALS or “Lou Gehrig’s
Disease”). 2015 Nov 23 [cited 2015 Nov 23]; Available from: http://www. medicinenet.com/amyotrophic_lateral_sclerosis/article.htm
3. Orrell RW. Understanding the causes of amyotrophic lateral sclerosis. N
Engl J Med. 2007;357(8):822-3.
4. Hardiman O, Greenway M. The complex genetics of amyotrophic lateral sclerosis. Lancet Neurol. 2007;6(4):291-2.
5. Pasinelli P, Brown RH. Molecular biology of amyotrophic lateral sclerosis: insights from genetics. Nat Rev Neurosci. 2006;7(9):710-23.
6. Dunckley T, Huentelman MJ, Craig DW, et al. Whole-genome analysis of sporadic amyotrophic lateral sclerosis. N Engl J Med. 2007;357(8):775-88. 7. van Es MA, Van Vught PW, Blauw HM, et al. ITPR2 as a susceptibility
gene in sporadic amyotrophic lateral sclerosis: a genome-wide association study. Lancet Neurol. 2007;6(10):869-77.
8. van Es MA, van Vught PW, Blauw HM, et al. Genetic variation in DPP6 is associated with susceptibility to amyotrophic lateral sclerosis. Nat Genet. 2008;40(1):29-31.
9. Chio A, Schymick JC, Restagno G, et al. A two-stage genome-wide association study of sporadic amyotrophic lateral sclerosis. Hum Mol Genet. 2009;18(8):1524-32.
10. Blauw HM, Veldink JH, van Es MA, et al. Copy-number variation in sporadic amyotrophic lateral sclerosis: a genome-wide screen. Lancet Neurol. 2008;7(4):319-26.
11. Cronin S, Berger S, Ding J, et al. A genome-wide association study of sporadic ALS in a homogenous Irish population. Hum Mol Genet. 2008;17(5):768-74.
13. Ahmeti KB, Ajroud-Driss S, Al-Chalabi A, et al. Age of onset of
amyotrophic lateral sclerosis is modulated by a locus on 1p34.1. Neurobiol Aging. 2013;34(1):357 e7-19.
14. Deng M, Wei L, Zuo X, et al. Genome-wide association analyses in Han Chinese identify two new susceptibility loci for amyotrophic lateral sclerosis. Nat Genet. 2013;45(6):697-700.
15. Kwee LC, Liu Y, Haynes C, et al. A high-density genome-wide association screen of sporadic ALS in US veterans. PLoS One. 2012;7(3):e32768. 16. Laaksovirta H, Peuralinna T, Schymick JC, et al. Chromosome 9p21 in
amyotrophic lateral sclerosis in Finland: a genome-wide association study. Lancet Neurol. 2010;9(10):978-85.
17. Landers JE, Melki J, Meininger V, et al. Reduced expression of the Kinesin-Associated Protein 3 (KIFAP3) gene increases survival in sporadic amyotrophic lateral sclerosis. Proc Natl Acad Sci U S A. 2009;106(22):9004-9.
18. Shatunov A, Mok K, Newhouse S, et al. Chromosome 9p21 in sporadic amyotrophic lateral sclerosis in the UK and seven other countries: a genome-wide association study. Lancet Neurol. 2010;9(10):986-94. 19. Sha Q, Zhang Z, Schymick JC, et al. Genome-wide association reveals
three SNPs associated with sporadic amyotrophic lateral sclerosis through a two-locus analysis. BMC Med Genet. 2009;10:86.
20. van Es MA, Veldink JH, Saris CG, et al. Genome-wide association study identifies 19p13.3 (UNC13A) and 9p21.2 as susceptibility loci for sporadic amyotrophic lateral sclerosis. Nat Genet. 2009;41(10):1083-7.
21. Cronin S, Tomik B, Bradley DG, et al. Screening for replication of genome-wide SNP associations in sporadic ALS. Eur J Hum Genet. 2009;17(2):213-8.
22. Landers JE, Melki J, Meininger V, et al. Reduced expression of the Kinesin-Associated Protein 3 (KIFAP3) gene increases survival in sporadic amyotrophic lateral sclerosis. Proc Natl Acad Sci U S A. 2009;106(22):9004-9.
Genome-Wide Association Data: Where Are the Standards? 29
24. Laaksovirta H, Peuralinna T, Schymick JC, et al. Chromosome 9p21 in amyotrophic lateral sclerosis in Finland: a genome-wide association study. Lancet Neurol. 2010;9(10):978-85.
25. Shatunov A, Mok K, Newhouse S, et al. Chromosome 9p21 in sporadic amyotrophic lateral sclerosis in the UK and seven other countries: a genome-wide association study. Lancet Neurol. 2010;9(10):986-94. 26. Ahmeti KB, Ajroud-Driss S, Al-Chalabi A, et al. Age of onset of
amyotrophic lateral sclerosis is modulated by a locus on 1p34.1. Neurobiol Aging. 2013;34(1):357 e7-19.
27. Daoud H, Belzil V, Desjarlais A, et al. Analysis of the UNC13A gene as a risk factor for sporadic amyotrophic lateral sclerosis. Arch Neurol. 2010;67(4):516-7.
28. Kwee LC, Liu Y, Haynes C, et al. A high-density genome-wide association screen of sporadic ALS in US veterans. PLoS One. 2012;7(3):e32768. 29. Deng M, Wei L, Zuo X, et al. Genome-wide association analyses in Han
Chinese identify two new susceptibility loci for amyotrophic lateral sclerosis. Nat Genet. 2013;45(6):697-700.
30. Zeggini E, Weedon MN, Lindgren CM, et al. Replication of genome-wide association signals in UK samples reveals risk loci for type 2 diabetes. Science. 2007;316(5829):1336-41.
31. Szklo M, Nieto FJ. Epidemiology: beyond the basics. Boston, MA: Jones and Bartlett; 2004.
32. Balding DJ, Bishop M, Cannings C, editors. Handbook of statistical genetics. 3rd ed. Chichester, United Kingdom: John Wiley & Sons; 2007. 33. Garson GD. Logistic regression, in Statnotes: Topics in multivariate
analysis. 2008. Available from: http://www2.chass.ncsu.edu/garson/pa765/ statnote.htm
34. Agresti A. Categorical data analysis. 2nd ed. Hoboken, NJ: John Wiley & Sons; 2002.
36. Mackenzie IR, Bigio EH, Ince PG, et al. Pathological TDP-43 distinguishes sporadic amyotrophic lateral sclerosis from amyotrophic lateral sclerosis with SOD1 mutations. Ann Neurol. 2007;61(5):427-34.
37. Slowik A, Tomik B, Wolkow PP, et al. Paraoxonase gene polymorphisms and sporadic ALS. Neurology. 2006;67(5):766-70.
Creating the Synthetic Gene Data
Philip Chester Cooley
CHAPTER 3
Overview
We used simulation methods to compensate for the absence of both methodo logical standards and a process for evaluating the statistical methods used in predicting associations between genes and phenotypes. This required creating a synthetic gene database of simulated data linked to known association outcomes constituting a “truth set.” Using these data, we analyzed the simulated data using candidate statistical methods for the purpose of assessing each method’s predictive properties in the context of an experimental setting that we create.
Our method for generating the synthetic marker data is based on Mendelian concepts of inheritance and epidemiological concepts of relative risk (RR), which is the ratio of the probability of an event occurring in an exposed group to the probability of the event occurring in a comparison, nonexposed group. For example, nonsmokers who inhale secondhand smoke may be more likely to develop lung cancer than nonsmokers who have not been exposed. Individuals also have genetic inheritance elements that include autosomal dominant and autosomal recessive patterns conforming to singlegene inheritance effects. We also incorporate additive and multiplicative inheritance patterns to represent the actions of multifactorial inheritance processes.
We used a study by Iles to represent the contrast between a formal disease diagnosis that stems from genetic causes and the concept of disease penetrance.1 Penetrance in genetics is the proportion of individuals carrying
a particular variation of a gene (allele or genotype) that also express an associated trait. We designate a as the risk allele, and A as the allele without risk. Generating the synthetic gene data set was facilitated by defining the relationships between penetrance and relative risk for different MOI categories.
The Data Generation Process
Specifically the steps were:
1. Preload the details that define the factor combinations for each MOI category. The factors are specified in Table 3.1.
Table 3.1. Factors that define a synthetic gene data file
Factor Symbol Number of factors
Sample size N NCC
Penetrance P NP
Phenotype error rate Perr NY
Genotype error rate Gerr NX
Relative genetic risk Φ NGR
Relative environmental risk Π NER
2. Draw a genotype distribution at random from the master set of genotype distributions obtained from real distribution data (i.e., the study by Schymick et al.2). At this stage, Chan et al. recommends that a minor
allele frequency (MAF) threshold not be applied.3 They argue that filtering
MAFs out of the process because of low frequencies or to maintain Hardy– Weinberg equilibrium (HWE) deviation has little effect on the overall false positive rate and in some cases, filtering MAF only serves to exclude SNPs. This step effectively selects a specific genotype distribution (at random) from the master distribution.
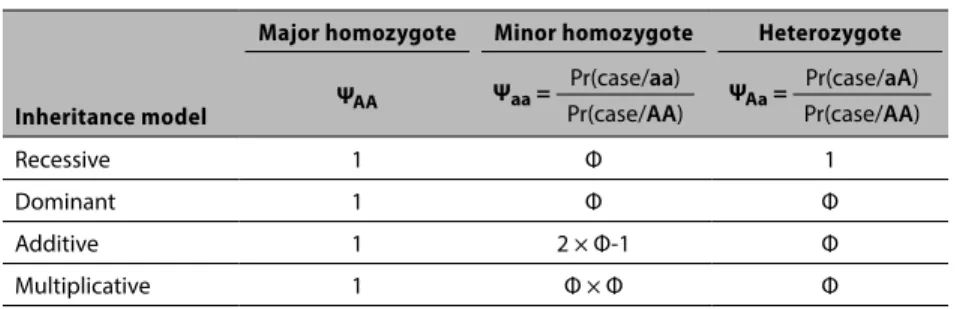
3. Use Table 3.2 to assign a case (1) or a control (0) based on the selected genetic relative risk (Φ), penetrance (P) and MOI category. This step converts the Φ ratio value into the probability that the case occurs for the MOI gene model of interest. This process is represented by the following logic that was derived from Iles1:
Major Homozygote (AA). Assume that the AA genotype is selected. The
probability of a case given this selection is equal to the disease penetrance P, or ΨAA = P.
Minor Homozygote (aa): Liability Increasing Allele. Assume the aa genotype is
Creating the Synthetic Gene Data 33
probabilities: the probability of a case for a minor homozygote divided by the probability of a case for a major homozygote, or
Ψaa = Prob(case/aa) / Prob(case/AA) = x/P. (3.1)
From (3.1) the probability of a case given the minor genotype = x = Ψaa × P, (3.2) where Ψaa = one of the assigned risk factors and P is one of the assigned penetrance factors.
Heterozygote (aA). Assume the aA genotype is selected. By the same
argument, the phenotype risk given a heterozygote is:
ΨaA = Prob(case/aA) / Prob(case/AA) = y/P. (3.3)
By the same argument, the risk of a case given the heterozygote is
y = ΨaA × P, (3.4)
where ΨaA = one of the assigned risk factors and P is one of the assigned penetrance factors.
Using the estimate of x and y, assign a case or control at random using the four different MOI models in conjunction with equations (3.2) and (3.4) and Table 3.2. We assigned cases in proportion to x (y) and controls in proportion to 1 x (1y) for the minor homozygote (heterozygote) genotypes respectively. For the MOI models that assume an elevated risk from the minor and the hetero genotypes, we would expect a higher proportion of cases to be more easily identified via the statistical procedures. The specification of risk depends on specific and unknown disease mechanisms. A relative risk of 1.7 is considered strong and is associated with positive replication,4 and a risk of 1.3 is considered
by Ziegler et al.5 to be a realistic assumption for complex diseases. In
summary, individuals are either assigned as cases or controls according to the probabilities given in Table 3.2.
4. Systematically select subjects. If the subject is a case (control), change its phenotype designation to a control (case) at a rate determined by Perr. 5. Systematically select subjects. If the genotype is a disease (nondisease) allele