Potential Impact of Time Trend of Life-Style Factors on
Cardiovascular Disease Burden in China
Yanping Li, PhDa, Dong D. Wang, MDa,b, Sylvia H. Ley, PhDa, Annie Green Howard, PhDc,
Yuna He, PhDd, Yuan Lu, DSce,f, Goodarz Danaei, DScb,f, and Frank B. Hu, MD, PhDa,b,g
aDepartment of Nutrition, Harvard T.H. Chan School of Public Health, Boston, MA, USA bDepartment of Epidemiology, Harvard T.H. Chan School of Public Health, Boston, MA, USA cDepartment of Biostatistics, Gillings School of Global Public Health, University of North Carolina,
Chapel Hill, NC, USA
dDepartment of Nutrition Surveillance, National Institute of Nutrition and Health, Chinese Center
for Disease Control and Prevention, Beijing, China
eYale/Yale-New Haven Hospital, Center for Outcomes Research and Evaluation (CORE), New
Haven, CT, USA
fDepartment of Global Health and Population, Harvard T.H. Chan School of Public Health, Boston,
MA, USA
gChanning Division of Network Medicine, Department of Medicine, Brigham and Women’s
Hospital, Harvard Medical School, Boston, MA, USA
Abstract
BACKGROUND—Cardiovascular disease (CVD) is a leading cause of death in China.
Evaluation of risk factors and their impacts on disease burden is important for future public health initiatives and policy making.
OBJECTIVE—We used data from a cohort of the China Health and Nutrition Survey to estimate time trends in cardiovascular risk factors from 1991 through 2011.
METHODS—We applied the Comparative Risk Assessment method to estimate the number of CVD events attributable to all non-optimal levels (e.g., theoretical-minimum-risk exposure distribution, TMRED) of each risk factor.
RESULTS—In 2011, high blood pressure, high low-density lipoprotein cholesterol, and high blood glucose were associated with 3.1, 1.4, and 0.9 million CVD events in China, respectively. Increase in body mass index (BMI) was associated with an increase in attributable CVD events,
Corresponding Author: Frank B. Hu MD, Ph.D., Departments of Nutrition and Epidemiology, Harvard T.H. Chan School of Public Health, 665 Huntington Ave, Boston, MA 02115, Telephone: 617 432 0113, Fax: 617 432 2435, [email protected]. Conflict of Interest: None
Publisher's Disclaimer: This is a PDF file of an unedited manuscript that has been accepted for publication. As a service to our customers we are providing this early version of the manuscript. The manuscript will undergo copyediting, typesetting, and review of
HHS Public Access
Author manuscript
J Am Coll Cardiol
. Author manuscript; available in PMC 2018 March 14.Published in final edited form as:
J Am Coll Cardiol. 2016 August 23; 68(8): 818–833. doi:10.1016/j.jacc.2016.06.011.
A
uthor Man
uscr
ipt
A
uthor Man
uscr
ipt
A
uthor Man
uscr
ipt
A
uthor Man
uscr
from 0.5 million to 1.1 million between 1991 and 2011, while decreased physical activity was associated with a 0.7-million increase in attributable CVD events. In 2011, 53.4% of males used tobacco, estimated to be responsible for 30.1% of CVD burden in males. Dietary quality
improved, but remained suboptimal; mean intakes were 5.4 (TMRED: 2.0) g/day for sodium, 67.7 (TMRED: 300.0) g/day for fruits, 6.2 (TMRED: 114.0) g/day for nuts, and 25.0 (TMRED: 250.0) mg/day for marine omega-3 fatty acids in 2011.
CONCLUSION—High blood pressure remains the most important individual risk factor related to CVD burden in China. Increased BMI and decreased physical activity were also associated with the increase in CVD burden from 1991 to 2011. High rates of tobacco use in males and unhealthy dietary factors continue to contribute to the burden of CVD in China.
Keywords
China; cardiovascular disease; preventable; risk factor; disease burden
INTRODUCTION
In the past 2 decades, China experienced a dramatic shift in diet from traditional to Western dietary patterns (1). Decreased consumption of coarse grains and legumes were countered by increased intake of animal-source food and cooking oil (2). Rapid urbanization and
industrialization led to a steep decline in physical activity levels (3). These changes have been accompanied by marked increases in serum cholesterol levels (4,5), obesity (6,7), and type 2 diabetes (8,9). Smoking prevalence in China remains high (10). Overall, CVD has surpassed infectious diseases to become the leading cause of death in China (11). Therefore, it is imperative to study the trends in CVD risk factors and their relationship to disease burden, in order to evaluate current public health policies and provide guidance for future disease prevention and health promotion.
In this study, we describe time trends in dietary and other lifestyle risk factors for CVD from 1991 to 2011 using data from an ongoing open cohort of the China Health and Nutrition Survey (CHNS) (12). We then apply the Comparative Risk Assessment (CRA) method (13) to estimate the number of CVD events attributable to non-optimal levels of these risk factors.
METHODS
STUDY POPULATION
The CHNS (12) is an ongoing prospective household-based study of multiple age groups across 9 rounds of data collection, including 4,400 households with a total of 26,000 individuals in nine provinces. CHNS was initiated in 1989 and conducted follow-up visits in 1991, 1993, 1997, 2000, 2004, 2006, 2009, and 2011. Data are publicly available for
download at http://www.cpc.unc.edu/projects/china.
A stratified probability sampling method was applied to the study population, as described in detail previously (12). Briefly, the CNHS used a multistage, random cluster design in 9 provinces (Liaoning, Jiangsu, Shandong, Henan, Hubei, Hunan, Guangxi, Guizhou, and Heilongjiang). Within each province, 2 cities (1 large and 1 small, usually the provincial
A
uthor Man
uscr
ipt
A
uthor Man
uscr
ipt
A
uthor Man
uscr
ipt
A
uthor Man
uscr
capital and a lower-income city) and 4 counties (stratified by income, 1 high-, 1 low- and 2 middle-income) were selected. Within cities, 2 urban and 2 suburban communities were randomly selected. Within counties, 1 community in the capital city and 3 rural villages were randomly chosen. Twenty households per community were then selected for
participation. We excluded data from the 1989 wave because it enrolled only adults aged 20– 45 years. We also excluded the data for 3 megacities from the comparison of time trend, as those data were available only in 2011. Additionally, we excluded participants who were pregnant or under 35 years old at the time of the survey.
COMPARATIVE RISK ASSESSMENT METHOD
We applied population-level CRA to calculate the population attributable risk (13), i.e. the proportion of CVD burden that would have been prevented if the distribution of specific risk factor exposure had been changed to a hypothetical alternative distribution while holding other risk factors constant. We conducted all analyses separately (20 groups in total): by sex, community-level urbanization as classified by the Chinese government (urban or rural), and age group based on age at measurement (35–44, 45–54, 55–64, 65–74, and ≥ 75 years). We restricted analyses to participants ≥ 35 years of age because of limited data on the effects of these risk factors and fewer CVD events among younger participants.
For the CRA analysis, we included data from different sources, including 1) the current distribution of risk factor exposure in each wave; 2) the etiological effects of risk factor exposures on coronary heart disease (CHD), ischemic stroke, and hemorrhagic stroke, respectively; 3) an alternative theoretical-minimum-risk exposure distribution (TMRED); and 4) the total number of CVD events in the population.
RISK FACTOR SELECTION
We selected 17 dietary and lifestyle risk factors for which 1) there was sufficient evidence for the presence and magnitude of probable causal relationships with coronary heart disease (CHD), ischemic stroke, and hemorrhagic stroke, 2) there were available intervention strategies to modify exposure of risk, and 3) data on risk factor exposure were available in CHNS without systematic bias. Factors included high systolic blood pressure (SBP), high low density lipoprotein (LDL) cholesterol, high blood glucose, high body mass index (BMI), low physical inactivity, current tobacco smoking, and 11 dietary risk factors. Table 1
summarizes these 17 risk factors, their optimal level (TMRED), CVD outcomes, and sources of the relative risk (RR) used for estimating CVD burden. As the blood samples for LDL and glucose were collected only once in CHNS, we included all 17 risk factors for CVD burden in 2011 but only 15 factors for time trend analysis.
MEASUREMENTS
Sex, age, primary occupation category, highest educational level achieved, and smoking status were self-reported in each wave. Dietary information was collected by 3-day 24-hour dietary recalls in addition to using the 3-day food-weighted method to assess cooking oil and condiment consumption. Nutrient intakes were calculated using the China Food
Composition Tables (FCT). Specifically, FCT-1991 (14) was used for dietary data from the 1997 and 2000 waves; FCT-2002/2004 (15,16) was used for dietary data from the 2004,
A
uthor Man
uscr
ipt
A
uthor Man
uscr
ipt
A
uthor Man
uscr
ipt
A
uthor Man
uscr
2006, 2009, and 2011 waves. We did not include the dietary data from 1991 or 1993 because the food codes in those datasets did not match the food codes in FCT (matching codes were not released). We evaluated energy-adjusted dietary intakes for each dietary factor, except for polyunsaturated fat (PUFA), using the residual method to 2000 kcal/day (17). PUFA intake was calculated as the percentage of total energy intake.
Following standardized procedures, trained health workers measured the weight and height of all participants using calibrated equipment (SECA 880 scales and SECA 206 wall-mounted metal tapes) (18), and BMI was calculated as weight (kg) divided by height
squared (m2).
Each participant’s seated systolic blood pressure (SBP) was measured on the right arm using standard mercury sphygmomanometers by experienced physicians who attended a 7-day data-collection training session and passed a comprehensive reliability test (19). Three measurements were obtained with a 30-second interval between cuff inflations if the first measure was normal. Otherwise, participants were requested to rest for 10–30 min before a second measurement was taken (19). The mean value of 3 measurements was used.
LABORATORY ANALYSIS
Analysis methods for blood glucose and LDL cholesterol are described in detail elsewhere (1). In brief, overnight-fasting blood glucose and LDL cholesterol were measured with the GOD-PAP method and the polyethylene glycol (PEG)-modified enzyme method,
respectively.
Participants self-reported physical activity on a questionnaire that solicited detailed information on occupational and domestic activities (3). Total metabolic equivalent of task (MET) hours per week was calculated by multiplying the METs values (20) of activities by the time spent on the activity. We also categorized study participants into different physical activity levels according to their MET-minutes per week (0: < 600; 1: 600–3999; 2: 4000– 7999; 3: ≥ 8000 MET-minutes) (21).
ETIOLOGICAL EFFECTS OF RISK FACTORS ON CVD
Data on etiological effects of risk factor exposures on CVD were extracted from the most recent systematic reviews and meta-analyses (13,22–35). For each risk factor-CVD association, we derived the same RR for males and females, except where empirical evidence indicated that the RR differed by sex (13,24). We used consistent age-varying distributions of RRs for CVD across risk factors, because the associations vary by age. Current evidence suggests that the effects of these risk factors on CVD in Western and Asian populations are similar (36–38), we extracted RRs from published studies regardless of the ethnicity of study populations.
OPTIMAL EXPOSURE DISTRIBUTION
We used TMRED as the alternative optimal exposure distribution to assess the proportion of CVD events associated with all non-optimal levels of exposure (13). The TMRED for smoking was zero (e.g., no tobacco smoking). For variables where the exposure of zero is
A
uthor Man
uscr
ipt
A
uthor Man
uscr
ipt
A
uthor Man
uscr
ipt
A
uthor Man
uscr
physiologically impossible, such as BMI, SBP, glucose, LDL, diet, and physical activity, the levels corresponding to the lowest CVD risk in epidemiological studies or the levels observed in low-exposure populations were used as TMREDs (Table 1).
TOTAL CVD MORBIDITY AND MORTALITY
CVD morbidity and mortality in China were extracted from the China Health Statistical Yearbook and the National Population Census. We extracted data on age-, sex-, and urban/ rural-specific mortality rate of 2011 for CHD and stroke from the China Health Statistical Yearbook. The mortality rate was combined with the age-, sex-, and urban/rural-specific population data from the 2010 Population Census of the People’s Republic of China to obtain CHD and stroke mortality events for each category. We applied the age- and sex-specific ratio of ischemic to hemorrhagic stroke (39) to classify total stroke deaths
attributable to each type of stroke. The age- and sex-specific case-fatality (39) and mortality events attributable to CHD, ischemic, and hemorrhagic stroke deaths were calibrated to reproduce the total morbidity and mortality events for total CVD.
STATISTICAL ANALYSIS
Mean (standard deviation) or percentage of each risk factor was presented by sex, age group, and urban/rural area in each wave. We applied the multivariate-adjusted general linear mixed-regression model, which allowed us to account for repeated measurements collected on the same individual over time using a random intercept for subject, to calculate covariate-adjusted mean levels of risk factors for subgroups by sex, age, and urban/rural area in each wave. To quantify time trends of the risk factors, the regression models included the year of each wave as a scored trend variable. The difference in time trend of each factor between subgroups was tested by including the interactions between subgroup variables and temporal trend in risk factor in the models: linear regression models for continuous variables and logistic regression model for smoking.
STANDARDIZATION
To describe the overall trends for each factor over time, we estimated the distributions of the risk factor in the joint classifications of sex, age group, and urban/rural area (20 groups in total) in each wave, then calculated the sex, age, and urban/rural standardized overall distribution of each risk factor using the 2010 Chinese Population Census data as the standard.
Projection—Future trends of 15 risk factors (except LDL and glucose, for which we do not have repeated measurements) for 2012–2031 were projected based on data for participants with > 3 repeated measurements during 1991–2011. We used a random effects model within each stratum of age, sex, and urban/rural. We also applied a time-series analysis with Bayesian panel Value-at-Risk (VAR) model (40,41) to project future values for 2012–2031 based on the average secular trend of each risk factor from 1991 (for diet from 1997 and for physical activity from 2004 [42]) to 2011.
Estimating CVD Attributable to Specific Risk Factors—Assuming a causal relationship between each risk factor and CVD, we calculated the population-attributable
A
uthor Man
uscr
ipt
A
uthor Man
uscr
ipt
A
uthor Man
uscr
ipt
A
uthor Man
uscr
fraction (PAF) (13) to estimate the proportional reduction in CVD events that would occur if risk factor exposure had been reduced to an alternative level based on the total effects of the risk factor.
For risk factors measured continuously (blood pressure, LDL, glucose, BMI, and dietary factors besides marine omega-3 fatty acids), we computed PAFs using the following equation (where x = exposure level, P(x) = actual distribution of exposure in the population,
P′(x) = alternative distribution of exposure in the population, RR(x) = RR of CVD at
exposure level x, and m = maximum exposure level):
The discrete version of the same estimator for PAF was applied to risks measured in categories of exposure (smoking, physical inactivity, and marine omega-3 fatty acids). The PAF related to each risk factor for each outcome (CHD, ischemic, and hemorrhagic stroke) was calculated by joint classifications of sex, age groups, and urban/rural area (20 groups in total). We calculated the number of CHD, ischemic stroke, and hemorrhagic stroke events attributable to each risk factor by multiplying its PAF by total events. The number of total CVD events was the sum of the numbers of CHD, ischemic stroke, and hemorrhagic stroke events. The PAF% for total CVD due to each risk factor was estimated by dividing the sum of events attributable to CHD, ischemic, and hemorrhagic stroke by the total number of CVD events in the population. As the CVD events attributable to individual risk factors often overlap, the total CVD events attributable to all risk factors could not simply be summed.
RESULTS
TIME TRENDS OF RISK FACTORS
Based on repeated measurements of the CHNS, we observed that mean SBP significantly increased over time in the whole population (Table 2), with more pronounced trends in the younger population and rural residents (both Ps for interaction < 0.0001). SBP increased by 2.0 mmHg (95% Confidence Interval [CI] 1.2–2.9) among urban residents and 6.7 mmHg (95%CI 6.1–7.2) among rural residents over the 20 years. We found a similar increasing trend in BMI over time; younger and rural residents showed greater increases (Table 2). Smoking was 1 of the leading lifestyle risk factors for CVD, especially among males. Despite a declining trend in smoking over time, 53.4% of males were still tobacco users in 2011 (Table 2). The average physical activity level decreased from 1991 to 2011 overall (Table 2).
We classified dietary factors into 2 groups: moderation components (lower intake is preferred), including sodium, red meat, processed meat, and sugar-sweetened beverages (SSBs); and adequacy components (higher intake is preferred), including dietary fiber, fruits, vegetables, nuts, whole grains, PUFA, and marine omega-3 fatty acids.
A
uthor Man
uscr
ipt
A
uthor Man
uscr
ipt
A
uthor Man
uscr
ipt
A
uthor Man
uscr
We observed a decreasing trend in sodium intake overall, although subgroup rates differed (Ps for interaction > 0.1 for all, Table 2). Consumptions of SSBs, red meat, and processed meat increasedover time, but overall consumption remained relatively low. Intakes of dietary fiber, fruit, nuts, vegetables, and marine omega-3 fatty acids increased significantly over time among all groups (Table 2), but average intake remained below the TMRED levels.
DISEASE BURDEN OF CVD IN 2011
In 2011, 6.79 million Chinese residents aged 35 years or older died—3.04 million of cardiovascular diseases. The estimated number of CVD events was 6.97 million (CHD 2.96, ischemic stroke 2.43, hemorrhagic stroke 1.58 million) in 2011.
We estimated that high blood pressure, the leading individual attributable factor for CVD events in China, was associated with 3.1 million CVD events in 2011 (Figure 1). The estimated PAF of high blood pressure was 43.8% for overall CVD in 2011 (Online Table 1).
In 2011, high LDL cholesterol and high blood glucose associated with 1.4 and 0.9 million CVD events, respectively (Figure 1). High LDL cholesterol was the second leading risk factor for CHD, with an estimated PAF of 37.2% in 2011. High LDL cholesterol was associated with 10.8% of ischemic stroke burden. The PAF of high blood glucose was 15.1% for CHD, 10.9% for ischemic stroke, 10.7% for hemorrhagic stroke, and 12.6% for overall CVD.
In 2011, current smoking was estimated to be associated with 1.3 million CVD events with a PAF of 30.1% among males and 7.5% of females (Online Table 1). Because harmful effects of smoking persist after smoking cessation (13), we estimated another 0.28 million CVD cases would be related to former smoking in 2011 (Online Table 2). The PAF for CVD of former and current smoking together was 36.0% among males and 9.1% of females in 2011.
High sodium intake was the leading dietary factor for CVD through its effect on increasing blood pressure. In 2011, high sodium intake was associated with 1.6 million CVD events (PAF 23.5%), overlapping at least partially with the total CVD burden associated with SBP (Figure 1).
Physical inactivity was the third leading risk factor for CHD, and estimated to be associated with 0.9 million CHD events (PAF 30.8%) in 2011, followed by insufficient marine omega-3 fatty acid intake (0.8 million CHD events with PAF of 26.6%) (Figure 1). Low consumption of nuts was associated with a PAF of 10.0% for CHD, while low fruit consumption was associated with PAF of 19.6% for ischemic stroke and 19.3% for hemorrhagic stroke (Figure 1).
TIME TRENDS OF ESTIMATED CVD BURDEN
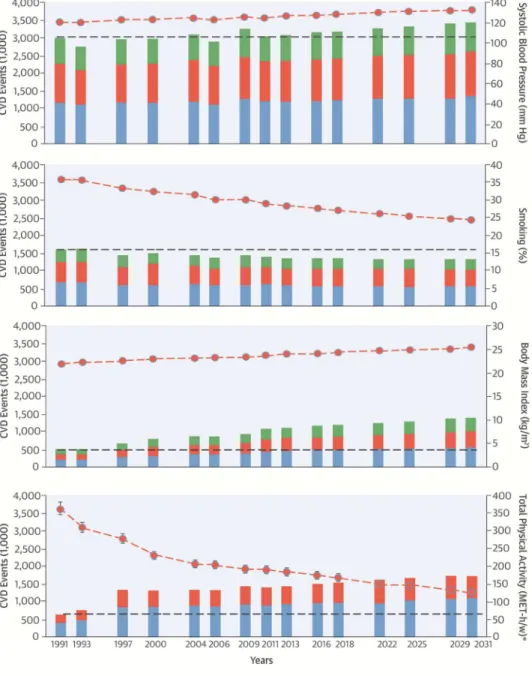
A trend for increasing SBP yielded an estimated 45,264 more CVD events from 1991 to 2011, and there will be a further increase of 393,470 CVD events during 2011–2031
(Central Illustration-1). The number of CVD events attributable to high BMI was very low in 1991, but increases in BMI were associated with 584,218 CVD additional events during the following 20 years and could potentially contribute to another 310,288 CVD events from
A
uthor Man
uscr
ipt
A
uthor Man
uscr
ipt
A
uthor Man
uscr
ipt
A
uthor Man
uscr
2011 to 2031 (Central Illustration-2). A declining trend in current smoking was estimated to be associated with 190,826 fewer CVD cases during 1991–2011 and is projected to be associated with 81,329 fewer CVD cases during 2011–2031(Central Illustration-3). In 2011, the average physical activity level was only 192 METs-hour/week (Standard error [SE] 7.9, Central Illustration-4). A decline in physical activity was estimated to relate to 748,019 CVD events during 1991–2011, and it will associate with a further increase of 325,448 CVD events during 2011–2031.
The overall sodium intake decreased but remained high when compared with the TMRED level in 2011 (g/day, mean: 5.4; SE 0.2; TMRED 2.0). The decreasing trend in sodium intake may result in a large reduction in CVD burden if optimal reduction in blood pressure related to sodium intake is achieved (Figure 2-1). However, we might have under-estimated the sodium intake by using data collected by a food-weighted method that weighted the foods, salt and other condiments consumption at home. As shown in Online Figure 1, the energy contributions from snacks, from foods prepared and/or eaten out of home increased over time. Including salt and condiments intake from foods prepared away from home, the average sodium intake was 6.75g in 2011 (Online Table 2). The CVD burden associated with high sodium intake would be 2.3 million after this adjustment.
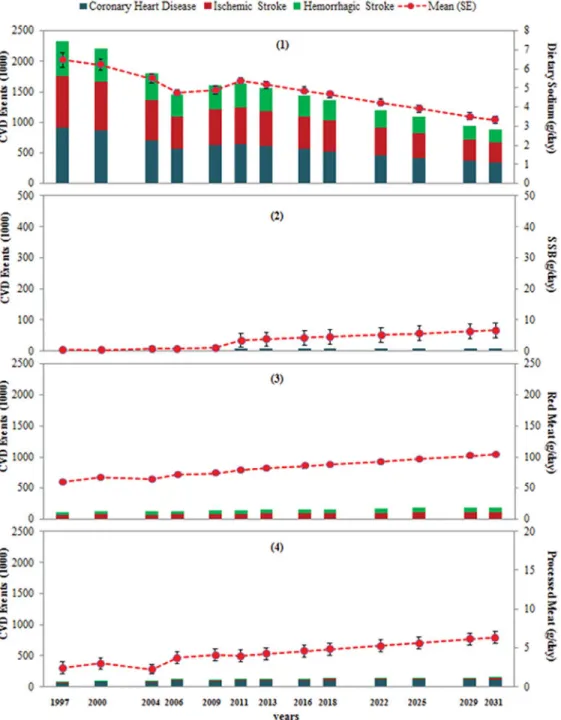
In 2011, the average intake of SSBs, red meat, and processed meat was 3.5g/day (SE 2.4), 79.7g/day (SE 3.4), and 4.0g/day (SE 0.8), respectively (Figure 2). The mean intakes were 10.8 (TMRED 30.0) g/day for fiber, 67.7 (TMRED 300.0) g/day for fruits, 6.2 (TMRED 114.0) g/day for nuts, and 25.0 (TMRED 250.0) mg/day for marine omega-3 fatty acids in 2011 (Figure 3). Insufficient intakes of marine omega-3 fatty acids, fruits, and fiber were estimated to be associated with 1.3 million, 1.0 million, and 0.6 million CVD events, respectively in 2011. Increasing intake of marine omega-3 fatty acids over time did not produce a large decline in CVD burden, but consumption was still far below optimal levels (Figure 3).
DISCUSSION
To our knowledge, this is the first population-based study of CVD burden in China that examines a wide range of dietary, lifestyle, and metabolic risk factors among a large and representative Chinese population. We found that multiple modifiable risk factors, including high blood pressure, high LDL cholesterol, high blood glucose, high BMI, smoking, physical inactivity, and a diet low in fruits and marine omega-3 fatty acids but high in sodium accounted for a large number of CVD events in China. We observed modest improvements in tobacco control and multiple dietary intake components, which may have slowed the rapid increase in the burden of CVD. Nevertheless, the smoking rate and dietary quality still fell short of optimal goals, and these modest improvements could not counteract the increasing burden of CVD due to unfavourable concurrent changes in BMI and physical activity levels.
The increasing upward trend in SBP was consistent with Chinese national surveillance data showing a continuous increase in the prevalence of hypertension over the past half century: The prevalence of high blood pressure was 5.1% in 1959 (43), 7.7% in 1979, 13.6% in 1991
A
uthor Man
uscr
ipt
A
uthor Man
uscr
ipt
A
uthor Man
uscr
ipt
A
uthor Man
uscr
(44), 17.7% in 2002 (45), and 33.5% in 2010 (46). The most recent prevalence figures on high blood pressure are comparable to those among U.S. adults (47). The estimated PAF of 43.8% of high blood pressure implied that about 2 in 5 CVD events in China might be prevented if SBP could be managed to the theoretical minimum level of 115mmHg. Although sodium-attributable CVD burden was assumed to be mediated through elevated blood pressure, we did not find a parallel between decreased sodium intake and decreased blood pressure (30). One explanation is that the potential decrease in blood pressure attributable to sodium reduction may have been counterbalanced by an increase in blood pressure from higher BMI (48) and lower physical activity levels (49). Our estimation of blood pressure-attributable CVD burden was close to global estimates; high blood pressure was estimated to be responsible for 45–48% of deaths from ischemic heart disease and 47– 53% of deaths from stroke in 2010 (50).
Increased BMI and decreased physical activity contributed significantly to the increase in CVD burden from 1991 to 2011 (51). China now has more obese individuals than the US. The worldwide ranking of the number of severely obese individuals has moved China from
60th place for males and 41st place for females in 1975 to 2nd for both males and females in
2014 (51). Our estimated CVD burden attributable to high BMI is probably conservative; etiological effect of BMI was derived mostly from Caucasian populations, and Chinese tend to have higher CVD risk at lower BMI levels than Caucasians (52,53). Meanwhile, Chinese has become more sedentary (3). Bicycle ownership decreased from 150–300 bicycles per 100 families in 1990s to only 77 bicycles per 100 households in 2011. Around 61% of rural households owned a motorcycle, and 19% of urban households owned a car in 2011 (54). At the same time, TV ownership increased from 38 sets per 1000 persons in 1985 to 112–135 sets per 100 households in 2011 (54). Future unfavourable trends in BMI and physical activity level will exacerbate the increase in CVD burden, especially in combination with the increasing consumption of SSBs, red meat, and processed meat. Compared to other
countries such as Germany, Finland, South Korea, and India, China has experienced a more dramatic shift in dietary patterns, from a traditional diet high in plant-based foods to a Westernized, animal-based diet (55). Reduced rates of smoking and increased consumption of dietary fiber, fruit, nuts, and marine omega-3 fatty acids may have mitigated the increase in CVD, but current smoking rates are still high, and dietary quality is far short of optimal goals. Further improvement would reduce the CVD burden and disease burden from other causes (56).
High blood LDL cholesterol was the second leading risk factor for CHD. The rapid transition to a Western dietary pattern has led to rapid increase in serum cholesterol levels (4). In 1982–1984, the prevalence of borderline high or high total cholesterol was 17.6% in males and 19.2% in females, which increased to 24% in males and 27.1% in females in 1992–1994 (57). The prevalence increased to 31.3% in males and 31.7% in females in 2007– 2008 (5). Type 2 diabetes is a growing epidemic in China, occurring at a relatively young age and low BMI (58). Type 2 diabetes was rare in China in the 1980s, with an estimated prevalence of 0.67% (41). In subsequent national surveys conducted in 1994 (59), 2000– 2001 (60), 2007–2008 (9), and 2010–2011 (8), the prevalence of diabetes was 2.5%, 5.5%, 9.7%, and 11.6%, respectively. Those data imply that CVD events associated with high LDL and glucose will continue to increase in the future.
A
uthor Man
uscr
ipt
A
uthor Man
uscr
ipt
A
uthor Man
uscr
ipt
A
uthor Man
uscr
Our study has a number of strengths. First, it was the first population-level analysis of the CVD burden in China that included a multitude of dietary and lifestyle factors using comparable methods to examine potentially preventable risk factors for CVD. To our knowledge, only 1 previous study has estimated future CVD burden in China, but it considered only 5 factors (blood pressure, LDL, glucose, BMI, and smoking), without considering any dietary factors (39). Other disease-burden studies in China have focused mainly on mortality or quality of life (61). Second, our estimate of each RR was based on the most recent and best available evidence on risk-exposure distribution in the population. Third, the exposure distribution of all risk factors was estimated based on original data from the CHNS. Previous disease-burden projects were based on pooling exposure distributions from different studies. The original data based estimation allowed us to account for potential residual confounding, although it could not be completely eliminated. Other strengths included the originality and high response rate of the CHNS as this survey was the only large-scale longitudinal study of its kind in China. Overall response rates of CHNS were around 88% at the individual level and 90% at the household level (62).
Our study also has limitations. CVD is likely caused by multiple factors acting
simultaneously, CVD events attributable to individual risk factors often overlap, and the total CVD events attributable to all risk factors cannot not simply be summed. In addition, some factors may interact. For example, physical inactivity may increase the risk of CVD through increasing BMI and blood pressure. The total number of CVD events attributable to multiple factors that may interact with each other could not be obtained by simple addition. A potential solution is to use the joint exposure distributions of all correlated risk factors together combined with their related RRs with CVD risk to estimate the overall CVD burden. However, no solidly evidence-based RRs are presently available for joint
classification, including all dietary and lifestyle risk factors. We did not consider aging or population growth in our time-trend analysis of CVD burden. We applied CVD events in 2011 to all PAFs in different waves to estimate the time trend of attributable CVD burden. This may have over-estimated the CVD burden before 2001 but under-estimated future CVD burden, since the Chinese population is aging. As reported in 1 previous estimate (39), CVD events will probably increase by 50% from 2011 to 2031 due to aging and population growth alone, even if all risk factors remain at year-2011 levels. Our projection of CVD burden associated with individual risk factors might be an underestimation, as our standardization and estimates were based on the population proportion and number of CVD events in 2011.
Our estimates of the preventable CVD burden is important for public health and policy makers in China. Previous studies demonstrate the efficacy and effectiveness of preventable strategies in reducing the levels of CVD risk factors and total CVD burden in high-risk individuals and general population (1). The Chinese Dietary Guideline, with its visual version, Chinese Food Pagoda, had been developed to promoted dietary advice to the public for many years (63,64). Most of the recommendation levels of the Chinese Dietary
Guidelines are in line with the TMREDs in this analysis, such as recommendations on vegetables (400 g/day) and fruit (300 g/day) (63,64). We used a TMRED level of 2 g/day for sodium, which is slightly lower than the recommended level (2.4g/day sodium [6 g/day salt]) in the Chinese Dietary guidelines. We intented our analysis to contribute to the scientific evidence base for population-level CVD prevention strategies; recommendations on salt
A
uthor Man
uscr
ipt
A
uthor Man
uscr
ipt
A
uthor Man
uscr
ipt
A
uthor Man
uscr
intake in the Chinese Dietary Guidelines considered both scientific evidence and practical health promotion in Chinese who had a very high usual intake level of sodium (19). Health education and lifestyle intervention programs are effective in prevention of diabetes and CVD in China (1). Effective screening strategies are needed, as less than one-third of hypertension and diabetes patients were aware their conditions. Although promotion of smoking cessation, national bans on smoking in public and work places, and bans on tobacco advertising have halted the in smoking prevalence (65), the percentage of male smokers is still high in China; targeted interventions are still warranted. Besides managing preventable risk factors, other strategies should also be helpful for CVD control include promoting health insurance coverage, eradicating of poverty, developing environments conductive to walking and bicycling, and controlling air pollution. Prevention should be a top national policy priority for CVD control (1), which depends on fully involved
stakeholders from government, health care, education, industry, urban planning, the media, the food production and service sectors, non-governmental organizations, communities, and individuals (1).
In conclusion, high blood pressure remains the leading factor contributing to the increasing CVD burden in China, though increasing BMI and decreasing physical activity were also important. Decreased smoking prevalence and sodium consumption, and increased fruit, fiber, and seafood intakes contributed to slight reductions in CVD burden; however, the current levels of these factors remain below optimal levels. With rapid westernization of the Chinese diet, consumption of red meat, processed meat, and SSBs should be targets for future interventions to prevent CVD in China.
Supplementary Material
Refer to Web version on PubMed Central for supplementary material.
Acknowledgments
The current study was supported by the Swiss Re Foundation. Most of the data presented in this article were based on the China Statistic Yearbook, China Public Health Statistical Yearbook, National Population Census Datasets, and eight waves of data from the CHNS. We thank the National Bureau of Statistics of the People’s Republic of China, National Institute of Nutrition and Food Safety, China Center for Disease Control and Prevention, Carolina Population Center (5 R24 HD050924), the University of North Carolina at Chapel Hill, the NIH (R01-HD30880, DK056350, R24 HD050924, and R01-HD38700) and the Fogarty International Center, NIH for financial support for the CHNS data collection and analysis files from 1989 to 2011 surveys, and the China-Japan Friendship Hospital, Ministry of Health for support for CHNS 2009. We thank Ms. Guifeng Jin and Dr. Shufa Du from the University of North Carolina at Chapel Hill and Huijun Wang from the China National Institute of Nutrition and Health for providing individual assistance in the data preparation.
Abbreviations List
BMI Body Mass Index
CHD Coronary Heart Disease
CHNS China Health and Nutrition Survey
CI Confidence Interval
A
uthor Man
uscr
ipt
A
uthor Man
uscr
ipt
A
uthor Man
uscr
ipt
A
uthor Man
uscr
CRA Comparative Risk Assessment
CVD Cardiovascular Disease
LDL Low Density Lipoprotein
MET Metabolic Equivalent of Task
PUFA Poly-Unsaturated Fatty Acid
RR Relative Risk
SBP Systolic Blood Pressure
SE Standard error
SSB Sugar-Sweetened Beverages
TMRED Theoretical-Minimum-Risk Exposure Distribution
References
1. Qin X, Huo Y, Langman CB, et al. Folic acid therapy and cardiovascular disease in ESRD or advanced chronic kidney disease: a meta-analysis. Clin J Amer Soc Nephrol. 2011; 6:482–8. [PubMed: 21088292]
2. Zhai FY, Du SF, Wang ZH, Zhang JG, Du WW, Popkin BM. Dynamics of the Chinese diet and the role of urbanicity, 1991–2011. Obes Rev. 2014; 15(Suppl 1):16–26. [PubMed: 24341755] 3. Ng SW, Howard AG, Wang HJ, Su C, Zhang B. The physical activity transition among adults in
China: 1991–2011. Obes Rev. 2014; 15(Suppl 1):27–36.
4. Farzadfar F, Finucane MM, Danaei G, et al. National, regional, and global trends in serum total cholesterol since 1980: systematic analysis of health examination surveys and epidemiological studies with 321 country-years and 3.0 million participants. Lancet. 2011; 377:578–86. [PubMed: 21295847]
5. Huang T, Chen Y, Yang B, Wahlqvist ML, Li D. Meta-analysis of B vitamin supplementation on plasma homocysteine, cardiovascular and all-cause mortality. Clin Nutr. 2012; 31:448–54. [PubMed: 22652362]
6. Song Y, Ma J, Wang HJ, et al. Secular trends of obesity prevalence in Chinese children from 1985 to 2010: urban-rural disparity. Obesity. 2015; 23:448–53. [PubMed: 25521428]
7. Gordon-Larsen P, Wang H, Popkin BM. Overweight dynamics in Chinese children and adults. Obes Rev. 2014; 15(Suppl 1):37–48. [PubMed: 24341757]
8. Xu Y, Wang L, He J, et al. Prevalence and control of diabetes in Chinese adults. JAMA. 2013; 310:948–59. [PubMed: 24002281]
9. Yang W, Lu J, Weng J, et al. Prevalence of diabetes among men and women in China. N Engl J Med. 2010; 362:1090–101. [PubMed: 20335585]
10. Li Q, Hsia J, Yang G. Prevalence of smoking in China in 2010. N Engl J Med. 2011; 364:2469–70. [PubMed: 21696322]
11. Wang W, Hu SS, Kong LZ, et al. Summary of report on cardiovascular diseases in China, 2012. Biomed Environ Sci. 2014; 27:552–8. [PubMed: 25073915]
12. Zhang B, Zhai FY, Du SF, Popkin BM. The China Health and Nutrition Survey, 1989–2011. Obes Rev. 2014; 15(Suppl 1):2–7.
13. Danaei G, Ding EL, Mozaffarian D, et al. The preventable causes of death in the United States: comparative risk assessment of dietary, lifestyle, and metabolic risk factors. PLoS Med. 2009; 6:e1000058. [PubMed: 19399161]
A
uthor Man
uscr
ipt
A
uthor Man
uscr
ipt
A
uthor Man
uscr
ipt
A
uthor Man
uscr
14. Wang, G. China Food Composition 1991. China’s Medical Publishing House; Beijing: 1991. p. 2-61.
15. Yang, Y., Wang, G., Pan, X. China Food Composition 2002. Peking University Medical Press; Beijing: 2002. p. 21-219.
16. Yang, Y., Wang, G., Pan, X. China Food Composition 2004. Peking University Medical Press; 2005. p. 75-215.
17. Micha R, Khatibzadeh S, Shi P, et al. Global, regional, and national consumption levels of dietary fats and oils in 1990 and 2010: a systematic analysis including 266 country-specific nutrition surveys. BMJ. 2014; 348:g2272. [PubMed: 24736206]
18. Stern D, Smith LP, Zhang B, Gordon-Larsen P, Popkin BM. Changes in waist circumference relative to body mass index in Chinese adults, 1993–2009. Int J Obes. 2014; 38:1503–10. 19. Du S, Batis C, Wang H, Zhang B, Zhang J, Popkin BM. Understanding the patterns and trends of
sodium intake, potassium intake, and sodium to potassium ratio and their effect on hypertension in China. Am J Clin Nutr. 2014; 99:334–43. [PubMed: 24257724]
20. Sallis JF, Haskell WL, Wood PD, et al. Physical activity assessment methodology in the Five-City Project. Am J Epidemiol. 1985; 121:91–106. [PubMed: 3964995]
21. Lim SS, Vos T, Flaxman AD, et al. A comparative risk assessment of burden of disease and injury attributable to 67 risk factors and risk factor clusters in 21 regions, 1990–2010: a systematic analysis for the Global Burden of Disease Study 2010. Lancet. 2012; 380:2224–60. [PubMed: 23245609]
22. Bull, FC., Armstrong, TP., Dixon, T., et al. Physical inactivity. In: Ezzati, M.Lopez, AD.Rodgers, A., Murray, CJL., editors. Comparative quantification of health risks: Global and regional burden of disease attributable to selected major risk factors. Vol. 1. WHO; Geneva, Switzerland: 2004. p. 729-881.23.
23. Chen GC, Lv DB, Pang Z, Liu QF. Red and processed meat consumption and risk of stroke: a meta-analysis of prospective cohort studies. Eur J Clin Nutr. 2013; 67:91–5. [PubMed: 23169473] 24. Ezzati M, Henley SJ, Thun MJ, Lopez AD. Role of smoking in global and regional cardiovascular
mortality. Circulation. 2005; 112:489–97. [PubMed: 16027251]
25. Gan Y, Tong X, Li L, et al. Consumption of fruit and vegetable and risk of coronary heart disease: a meta-analysis of prospective cohort studies. Int J Cardiol. 2015; 183:129–37. [PubMed: 25662075]
26. Hu D, Huang J, Wang Y, Zhang D, Qu Y. Fruits and vegetables consumption and risk of stroke: a meta-analysis of prospective cohort studies. Stroke. 2014; 45:1613–9. [PubMed: 24811336] 27. Law MR, Wald NJ, Thompson SG. By how much and how quickly does reduction in serum
cholesterol concentration lower risk of ischaemic heart disease? BMJ. 1994; 308:367–72. [PubMed: 8043072]
28. Luo C, Zhang Y, Ding Y, et al. Nut consumption and risk of type 2 diabetes, cardiovascular disease, and all-cause mortality: a systematic review and meta-analysis. Am J Clin Nutr. 2014; 100:256–69. [PubMed: 24847854]
29. Micha R, Wallace SK, Mozaffarian D. Red and processed meat consumption and risk of incident coronary heart disease, stroke, and diabetes mellitus: a systematic review and meta-analysis. Circulation. 2010; 121:2271–83. [PubMed: 20479151]
30. Mozaffarian D, Fahimi S, Singh GM, et al. Global sodium consumption and death from cardiovascular causes. N Engl J Med. 2014; 371:624–34. [PubMed: 25119608]
31. Mozaffarian D, Rimm EB. Fish intake, contaminants, and human health: evaluating the risks and the benefits. JAMA. 2006; 296:1885–99. [PubMed: 17047219]
32. Singh GM, Danaei G, Farzadfar F, et al. The age-specific quantitative effects of metabolic risk factors on cardiovascular diseases and diabetes: a pooled analysis. PLoS One. 2013; 8:e65174. [PubMed: 23935815]
33. Tang G, Wang D, Long J, Yang F, Si L. Meta-analysis of the association between whole grain intake and coronary heart disease risk. Am J Cardiol. 2015; 115:625–9. [PubMed: 25727082] 34. Threapleton DE, Greenwood DC, Evans CE, et al. Dietary fiber intake and risk of first stroke: a
systematic review and meta-analysis. Stroke. 2013; 44:1360–8. [PubMed: 23539529]
A
uthor Man
uscr
ipt
A
uthor Man
uscr
ipt
A
uthor Man
uscr
ipt
A
uthor Man
uscr
35. Wu Y, Qian Y, Pan Y, et al. Association between dietary fiber intake and risk of coronary heart disease: A meta-analysis. Clin Nutr. 2015; 34:603–11. [PubMed: 24929874]
36. Lawes CM, Parag V, Bennett DA, Suh I, Lam TH, Whitlock G, et al. Blood glucose and risk of cardiovascular disease in the Asia Pacific region. Diabetes Care. 2004; 27:2836–42. [PubMed: 15562194]
37. Yusuf S, Hawken S, Ounpuu S, Dans T, Avezum A, Lanas F, et al. Effect of potentially modifiable risk factors associated with myocardial infarction in 52 countries (the INTERHEART study): case-control study. Lancet. 2004; 364:937–52. [PubMed: 15364185]
38. Zhang X, Patel A, Horibe H, et al. Cholesterol, coronary heart disease, and stroke in the Asia Pacific region. Int J Epidemiol. 2003; 32:563–72. [PubMed: 12913030]
39. Moran A, Gu D, Zhao D, et al. Future cardiovascular disease in china: markov model and risk factor scenario projections from the coronary heart disease policy model-china. Circ Cardiovasc Qual Outcomes. 2010; 3:243–52. [PubMed: 20442213]
40. Tsay, RS. Bayesian analysis in financial econometrics: value at risk and high frequency data. Chicago: p. 1-40.Available at www.istfin.eco.usi.ch/getentelist/seminar-paperstsay.pdf [Accessed at June 22, 2016]
41. A mass survey of diabetes mellitus in a population of 300,000 in 14 provinces and municipalities in China (author’s transl). Zhonghua Nei Ke Za Zhi. 1981; 20:678–83. [PubMed: 7341098]
42. Ng SW, Popkin BM. Time use and physical activity: a shift away from movement across the globe. Obes Rev. 2012; 13:659–80. [PubMed: 22694051]
43. Liu L. Writing Group of 2010 Chinese Guidelines for the Management of Hypertension. 2010 Chinese guidelines for the management of hypertension [Article in Chinese]. Zhonghua Xin Xue Guan Bing Za Zhi. 2011; 39:579–615. [PubMed: 22088239]
44. Tao S, Wu X, Duan X, et al. Hypertension prevalence and status of awareness, treatment and control in China. Chin Med J. 1995; 108:483–9. [PubMed: 7555263]
45. Wu Y, Huxley R, Li L, et al. Prevalence, awareness, treatment, and control of hypertension in China: data from the China National Nutrition and Health Survey 2002. Circulation. 2008; 118:2679–86. [PubMed: 19106390]
46. Li YC, Wang LM, Jiang Y, Li XY, Zhang M, Hu N. Prevalence of hypertension among Chinese adults in 2010. Zhonghua Yu Fang Yi Xue Za Zhi. 2012; 46:409–13. [PubMed: 22883726] 47. Centers for Disease Control and Prevention (CDC). Vital signs: awareness and treatment of
uncontrolled hypertension among adults--United States, 2003–2010. MMWR Morb Mortal Wkly Rep. 2012; 61:703–9. [PubMed: 22951452]
48. Holmes MV, Lange LA, Palmer T, et al. Causal effects of body mass index on cardiometabolic traits and events: a Mendelian randomization analysis. Am J Hum Genet. 2014; 94:198–208. [PubMed: 24462370]
49. Semlitsch T, Jeitler K, Hemkens LG, et al. Increasing physical activity for the treatment of hypertension: a systematic review and meta-analysis. Sports Med. 2013; 43:1009–23. [PubMed: 23812856]
50. Global Burden of Metabolic Risk Factors for Chronic Diseases Collaboration. Cardiovascular disease, chronic kidney disease, and diabetes mortality burden of cardiometabolic risk factors from 1980 to 2010: a comparative risk assessment. Lancet Diabetes Endocrinol. 2014; 2:634–47. [PubMed: 24842598]
51. The weight of the world – trends in adult body mass index in 200 countries since 1975: pooled analysis of 1,698 population-based measurement studies with 19.2 million participants. Lancet. Apr 1. 2016 Available at: http://www.thelancet.com/doi/story/10.1016/audio.2016.04.01.2746
52. Chen Z, Yang G, Offer A, et al. Body mass index and mortality in China: a 15-year prospective study of 220 000 men. Int J Epidemiol. 2012; 41:472–81. [PubMed: 22296991]
53. Zhou BF. Predictive values of body mass index and waist circumference for risk factors of certain related diseases in Chinese adults--study on optimal cut-off points of body mass index and waist circumference in Chinese adults. Biomed Environ Sci. 2002; 15:83–96. [PubMed: 12046553] 54. National Bureau of Statistics of China. [Accessed at June 22, 2016] China statistical yearbook.
1996–2012. http://www.stats.gov.cn/tjsj/ndsj/
A
uthor Man
uscr
ipt
A
uthor Man
uscr
ipt
A
uthor Man
uscr
ipt
A
uthor Man
uscr
55. Ezzati M, Riboli E. Behavioral and dietary risk factors for noncommunicable diseases. N Engl J Med. 2013; 369:954–64. [PubMed: 24004122]
56. Wang DD, Li Y, Chiuve SE, Hu FB, Willett WC. Improvements in US diet helped reduce disease burden and lower premature deaths, 1999–2012; overall eiet remains poor. Health Aff. 2015; 34:1916–22.
57. Wu Y. Current status of major cardiovascular risk factors in Chinese populations and their trends in the past two decades. The Collaborative Study Group on Trends of Cardiovascular Diseases in China and Preventive Strategy. Chin J Cardiol. 2001; 29:74–9. [Accessed on June 22, 2016] http:// en.cnki.com.cn/Article_en/CJFDTOTAL-ZHXX200102003.htm.
58. Chan JC, Malik V, Jia W, et al. Diabetes in Asia: epidemiology, risk factors, and pathophysiology. JAMA. 2009; 301:2129–40. [PubMed: 19470990]
59. Pan XR, Yang WY, Li GW, Liu J. Prevalence of diabetes and its risk factors in china, 1994. National diabetes prevention and control cooperative group. Diabetes Care. 1997; 20:1664–9. [PubMed: 9353605]
60. Gu D, Reynolds K, Duan X, Xin X, Chen J, Wu X, et al. Prevalence of diabetes and impaired fasting glucose in the chinese adult population: International collaborative study of cardiovascular disease in asia (InterASIA). Diabetologia. 2003; 46:1190–8. [PubMed: 12879248]
61. Yang G, Wang Y, Zeng Y, et al. Rapid health transition in China, 1990–2010: findings from the Global Burden of Disease Study 2010. Lancet. 2013; 381:1987–2015. [PubMed: 23746901] 62. Popkin BM, Du S, Zhai F, Zhang B. Cohort Profile: The China Health and Nutrition
Survey--monitoring and understanding socio-economic and health change in China, 1989–2011. Int J Epidemiol. 2010; 39:1435–40. [PubMed: 19887509]
63. The Chinese Nutrition Society. Dietary guidelines and the Food Guide Pagoda. J Am Diet Assoc. 2000; 100:886–7. [PubMed: 10955044]
64. Xu X, Hall J, Byles J, Shi Z. Do older Chinese people’s diets meet the Chinese Food Pagoda guidelines? Results from the China Health and Nutrition Survey 2009. Public Health Nutr. 2015; 18:3020–30. [PubMed: 25697507]
65. Yang G, Wang Y, Wu Y, Yang J, Wan X. The road to effective tobacco control in China. Lancet. 2015; 385:1019–28. [PubMed: 25784349]
66. Huang C, Huang J, Tian Y, Yang X, Gu D. Sugar sweetened beverages consumption and risk of coronary heart disease: a meta-analysis of prospective studies. Atherosclerosis. 2014; 234:11–6. [PubMed: 24583500]
A
uthor Man
uscr
ipt
A
uthor Man
uscr
ipt
A
uthor Man
uscr
ipt
A
uthor Man
uscr
PERSPECTIVES
COMPETENCY IN SYSTEMS-BASED PRACTICE
High blood pressure is the most prevalent cardiovascular risk factor in China, but elevated body mass index and physical inactivity also contributed to increases in cardiovascular disease burden from 1991 to 2011. High rates of tobacco use in males and unhealthy dietary habits are ongoing threats to the health of the population.
TRANSLATIONAL OUTLOOK
More work is needed to develop and implement prevention strategies directed at modifiable risk factors, at both the individual and population level, to reduce the mounting burden of cardiovascular disease in China.
A
uthor Man
uscr
ipt
A
uthor Man
uscr
ipt
A
uthor Man
uscr
ipt
A
uthor Man
uscr
Figure 1. CVD attributable to 17 individual risk factors (thousands) in 2011
Cardiovascular Diseases (CVD) events, represented as solid bars, refer to the combined burden from coronary heart diseases, ischemic stroke and hemorrhagic stroke. SSB = Sugar-Sweetened Beverages; PUFA = Poly-Unsaturated Fatty Acid; BMI = Body Mass Index; LDL = Low Density Lipoprotein. Data of glucose and LDL cholesterol were collected in 2009 and carried forward for estimation of CVD burden in 2011.
A
uthor Man
uscr
ipt
A
uthor Man
uscr
ipt
A
uthor Man
uscr
ipt
A
uthor Man
uscr
Figure 2. Time trend and estimated CVD events attributable to a high intake of moderation dietary components
Time trend and estimated Cardiovascular Diseases (CVD) events attributable to a high intake of sodium (1), sugar-sweetened beverages (SSBs, 2), red meat (3), and processed meat (4). CVD events, represented as solid bars, refer to the combined burden from coronary heart diseases, ischemic stroke and hemorrhagic stroke; Circles represent Means and I bars represent Standard Errors (SE) of each risk factor distribution at each time point, which were standardized by age, sex, and urban/rural distribution using the 2010 Chinese Population Census data as the standard.
A
uthor Man
uscr
ipt
A
uthor Man
uscr
ipt
A
uthor Man
uscr
ipt
A
uthor Man
uscr
Figure 3. Time trend and estimated CVD events attributable to a low intake of adequacy dietary components
Time trend and estimated Cardiovascular Diseases (CVD) events attributable to a low intake of dietary fiber (1), fruits (2), vegetables (3), nuts (4), whole grains (5), poly-unsaturated fatty acids (PUFA, 6), and marine omega-3 fatty acids (7). CVD events, represented as solid bars, refer to the combined burden from coronary heart diseases, ischemic stroke and hemorrhagic stroke; Circles represent Means and I bars represent Standard Errors (SE) of each risk factor distribution at each time point, which were standardized by age, sex, and urban/rural distribution using the 2010 Chinese Population Census data as the standard
A
uthor Man
uscr
ipt
A
uthor Man
uscr
ipt
A
uthor Man
uscr
ipt
A
uthor Man
uscr
Central Illustration. Preventable CVD Burden in China: Time trend and Estimated Cardiovascular Disease (CVD) Events
Attributable to high systolic blood pressure (1), high body mass index (2), smoking (3) and lower physical activity (4). Cardiovascular diseases (CVD) events, represented as solid bars, refer to the combined burden from coronary heart diseases, ischemic stroke and hemorrhagic stroke; Circles represent Means and I bars represent Standard Errors (SE) of each risk factor distribution at each time point, which were standardized by age, sex, and urban/rural distribution using the 2010 Chinese Population Census data as the standard; Reference line represents the level of CVD events associated with each risk factor at 1991 for a visual comparison of CVD burden changes with time from the baseline.
A
uthor Man
uscr
ipt
A
uthor Man
uscr
ipt
A
uthor Man
uscr
ipt
A
uthor Man
uscr
A
uthor Man
uscr
ipt
A
uthor Man
uscr
ipt
A
uthor Man
uscr
ipt
A
uthor Man
uscr
ipt
T ab le 1 Risk factors in the analysis, e
xposure metrics, theoretical-minimum-risk e
xposure distrib
ution (TMRED), and disease outcome
Risk F
actors
Exposur
e Metric
TMRED ± SD
Disease outcome
Sour
ce of r
elati
v
e risks
High blood pressure
Systolic blood pressure
115 ± 6mmHg
CHD, Strok
e
Singh et al, PLoS ONE 2013(
32
)
High blood glucose
F
asting blood glucose
4.9 ± 0.3mmol/L
CHD, Strok
e
Singh et al, PLoS ONE 2013(
32
)
High LDL cholesterol
LDL cholesterol
2.0 ± 0.44mmol/L
*
CHD, ischemic strok
e
La
w and colleagues, BMJ 1994(
27
)
Daneai et al, PLoS Med 2009 (
13 ) Current smoking Current smoking No smoking CHD, Strok e
Ezzati et al, Circulation 2005 (
24
)
Daneai et al, PLoS Med 2009 (
13
)
Ov
erweight-obesity (high BMI)
BMI
21 ± 1 kg/m
2
CHD, Strok
e
Singh et al, PLoS ONE 2013(
32 ) Ph ysical inacti vity Ph ysical acti vity le v els (MET
-minutes/week) 0: <600; 1: 600–3999; 2: 4000–7999; 3≥8000 The whole population being highly acti
v
e (le
v
el 3)
CHD, ischemic strok
e
Bull et al, WHO report 2004(
22
)
Daneai et al, PLoS Med 2009(
13
)
Dietary F
actors
*
High dietary sodium (salt)
A
v
erage intak
e
2.0 ± 0.2 g/d
CHD, Strok
e
Mozaf
farian et al, N Engl J Med. 2014(
30
)
Diet high in sug
ar -sweetened be v erages (SSB) A v erage intak e
No dietary intak
e of SSB
CHD
Huang et al, Atherosclerosis. 2014(
66
)
Diet high in red meat
A v erage intak e 100±10g/week Strok e
Chen et al, Eur J Clin Nutr 2013(
23
)
Diet high in processed meat
A
v
erage intak
e
No dietary intak
e of processed
meat
CHD, Strok
e
Chen et al, Eur J Clin Nutr 2013(
23
)
Micha et al, Circulation 2010(
29
)
Diet lo
w in f
iber
A
v
erage intak
e
30 ± 3 g/d
CHD, Strok
e
W
u et al, Clin Nutr 2015(
35
)
Threapleton et al, Strok
e 2013(
34
)
Diet lo
w in fruit
A
v
erage intak
e
300 ± 30 g/d
CHD, Strok
e
Gan et al, Int J Cardio 2015(
25
)
Hu et al, Strok
e 2014(
26
)
Diet lo
w in v
egetable
A
v
erage intak
e
400 ± 30 g/d
CHD, Strok
e
Gan et al, Int J Cardio 2015(
25
)
Hu et al, Strok
e 2014(
26
)
Diet lo
w in nuts
A
v
erage intak
e
114 ± 11.4 g/week
CHD
Luo et al, Am J Clin Nutr 2014(
28
)
Diet lo
w in whole grain
**
A
v
erage intak
e
125 ± 12.5 g/d
CHD
T
ang et al, Am J Cardiol 2015(
33
)
Lo
w dietary PUF
A (in replacement of saturated
fat)
Usual intak
e of PUF
A (%calorie
intak
e)
10% ± 1%
CHD
Daneai et al, PLoS Med 2009 (
13
)
Diet lo
w in marine ome
g a-3 f atty acids ǂ Le v
el 1, 0–62.5; 2: 62.5 to < 125; 3:
125 to < 187.5; 4: 187.5 to < 250; 5: ≥ 250 (mg/day) The whole population being ≥250mg/d
CHD, Strok
e
Mozaf
farian and Rimm, J
AMA 2006 (
31
)
Daneai et al, PLoS Med 2009 (
13
)
* Estimated by 3-day 24-hour dietary records combined with 3-day weighted cooking oils and condiments; **
Whole grain: grain with at least 1 gram of f
iber for e
v
ery 10 grams of carboh
ydrate;
ǂ Marine ome
g
a-3 f
atty acids: eicosapentaenoic acid (EP
A) and docosahe
A
uthor Man
uscr
ipt
A
uthor Man
uscr
ipt
A
uthor Man
uscr
ipt
A
uthor Man
uscr
ipt
T ab le 2 Co v ariate-adjusted distribution of the systolic blood pressure, body mass inde
x, smoking, and ph
ysical acti vity o v er time * , ** Sex Age (y ears) Resident Male F emale 35–44 45–54 55–64 65–74 ≥75 Urban Rural
Systolic Blood Pr
essur e (mmHg) 1991 125 (0.4) 124 (0.4) 112 (0.3) 117 (0.5) 126 (0.6) 134 (0.9) 138 (1.4) 127 (0.4) 123 (0.3) 1993 125 (0.4) 124 (0.4) 112 (0.3) 117 (0.4) 126 (0.6) 133 (0.9) 136 (1.4) 127 (0.4) 123 (0.3) 1997 128 (0.3) 127 (0.3) 115 (0.3) 121 (0.4) 129 (0.5) 136 (0.7) 138 (1.3) 128 (0.4) 127 (0.3) 2000 128 (0.3) 127 (0.3) 116 (0.3) 121 (0.3) 129 (0.5) 136 (0.7) 138 (1.2) 128 (0.4) 127 (0.3) 2004 130 (0.3) 127 (0.3) 117 (0.3) 122 (0.3) 129 (0.5) 136 (0.6) 138 (1.0) 129 (0.3) 128 (0.3) 2006 129 (0.3) 126 (0.3) 117 (0.3) 122 (0.3) 128 (0.5) 133 (0.6) 136 (0.9) 127 (0.3) 127 (0.3) 2009 131 (0.3) 130 (0.3) 119 (0.3) 126 (0.4) 131 (0.4) 137 (0.6) 141 (0.9) 130 (0.3) 131 (0.2) 2011 131 (0.3) 129 (0.3) 119 (0.3) 125 (0.4) 131 (0.4) 136 (0.6) 138 (0.8) 129 (0.3) 130 (0.2)
P for trend
< 0.001 < 0.001 < 0.001 < 0.001 < 0.001 0.04 0.28 < 0.001 < 0.001
P for interaction
ǂ
< 0.001
< 0.001
< 0.001
Curr
ent Smoking (%)
1991 65.8 6.6 35.5 37.0 36.3 32.4 18.7 32.9 35.9 1993 65.2 6.3 34.5 38.5 32.8 32.5 21.3 33.6 34.7 1997 61.7 5.5 35.4 36.9 31.6 25.8 14.6 30.5 34.0 2000 59.2 5.6 32.5 33.1 31.5 27.5 18.2 29.7 31.9 2004 57.1 4.8 31.2 31.9 30.0 25.3 19.0 28.3 30.3 2006 54.3 4.1 28.5 30.9 29.4 24.1 15.4 27.4 28.1 2009 55.2 4.1 28.8 31.4 28.4 26.6 19.4 26.5 29.4 2011 53.4 4.1 27.8 30.0 27.2 24.7 21.7 26.1 27.8
P for trend
< 0.001 < 0.001 < 0.001 < 0.001 < 0.001 0.004 0.73 < 0.001 < 0.001
P for interaction
ǂ
0.85
0.20
0.39
Body Mass Index (kg/m
A
uthor Man
uscr
ipt
A
uthor Man
uscr
ipt
A
uthor Man
uscr
ipt
A
uthor Man
uscr
ipt
Sex Age (y ears) Resident Male F emale 35–44 45–54 55–64 65–74 ≥75 Urban Rural 2004 23.1 (0.1) 23.3 (0.1) 23.4 (0.1) 23.6 (0.1) 23.6 (0.1) 23.2 (0.1) 22.3 (0.1) 23.6 (0.1) 22.9 (0.1) 2006 23.1 (0.1) 23.4 (0.1) 23.5 (0.1) 23.7 (0.1) 23.6 (0.1) 23.2 (0.1) 22.1 (0.1) 23.5 (0.1) 23.0 (0.1) 2009 23.3 (0.1) 23.5 (0.1) 23.7 (0.1) 23.9 (0.1) 23.6 (0.1) 23.3 (0.1) 22.1 (0.1) 23.5 (0.1) 23.3 (0.1) 2011 23.8 (0.1) 23.9 (0.1) 24.1 (0.1) 24.4 (0.1) 24.1 (0.1) 23.6 (0.1) 22.3 (0.1) 24.0 (0.1) 23.6 (0.1)P for trend
< 0.001 < 0.001 < 0.001 < 0.001 < 0.001 < 0.001 0.004 < 0.001 < 0.001
P for interaction
ǂ 0.86 < 0.001 < 0.001 Ph ysical Acti vity (MET -hours/week) 1991 275 (4.1) 310 (3.6) 381 (4.5) 360 (5.6) 272 (5.4) 185 (5.5) 137 (5.1) 212 (4.0) 351 (3.6) 1993 228 (4.0) 251 (3.5) 322 (4.5) 301 (5.4) 230 (5.4) 155 (5.4) 95 (5.0) 182 (3.9) 285 (3.5) 1997 230 (3.6) 237 (3.2) 332 (4.2) 313 (4.4) 232 (4.9) 138 (4.5) 64 (4.2) 163 (3.4) 285 (3.2) 2000 196 (3.5) 197 (3.0) 297 (4.2) 269 (4.1) 215 (4.9) 119 (4.3) 56 (4.2) 141 (3.2) 241 (3.0) 2004 197 (3.5) 177 (2.9) 285 (4.4) 256 (4.0) 213 (4.5) 125 (4.2) 52 (4.1) 140 (3.2) 227 (3.0) 2006 190 (3.4) 174 (2.8) 284 (4.2) 257 (4.1) 194 (4.3) 119 (4.1) 50 (3.8) 131 (3.2) 223 (2.9) 2009 171 (3.1) 178 (2.7) 257 (4.4) 250 (4.1) 204 (3.9) 120 (3.7) 47 (3.0) 129 (3.0) 214 (2.7) 2011 176 (3.2) 174 (2.7) 261 (4.7) 249 (4.2) 198 (3.8) 123 (3.6) 48 (2.9) 128 (3.0) 215 (2.7)
P for trend
< 0.001 < 0.001 < 0.001 < 0.001 < 0.001 < 0.001 < 0.001 < 0.001 < 0.001
P for interaction
ǂ < 0.001 < 0.001 < 0.001 Sodium Intak e (g/day) 1997 6.3 (0.1) 6.7 (0.1) 5.9 (0.1) 6.6 (0.1) 6.6 (0.1) 6.7 (0.1) 7.2 (0.2) 6.9 (0.1) 6.3 (0.1) 2000 6.2 (0.1) 6.6 (0.1) 6.0 (0.1) 6.3 (0.1) 6.5 (0.1) 6.7 (0.1) 7.1 (0.2) 6.3 (0.1) 6.4 (0.1) 2004 5.4 (0.1) 5.8 (0.1) 5.2 (0.1) 5.7 (0.1) 5.5 (0.1) 5.9 (0.1) 5.7 (0.2) 5.7 (0.1) 5.5 (0.1) 2006 4.6 (0.1) 5.2 (0.1) 4.7 (0.1) 4.8 (0.1) 4.9 (0.1) 5.1 (0.1) 5.1 (0.2) 4.6 (0.1) 5.0 (0.1) 2009 4.7 (0.1) 5.3 (0.1) 4.6 (0.1) 5.0 (0.1) 5.1 (0.1) 5.1 (0.1) 5.3 (0.1) 5.3 (0.1) 4.8 (0.1) 2011 5.1 (0.1) 5.7 (0.1) 5.2 (0.1) 5.5 (0.1) 5.3 (0.1) 5.6 (0.1) 5.6 (0.1) 5.7 (0.1) 5.2 (0.1) P for trend < 0.001 < 0.001 < 0.001 < 0.001 < 0.001 < 0.001 < 0.001 < 0.001 < 0.001 P for interaction ǂ 0.14 0.03 0.64
Sugar Sweetened Be
A
uthor Man
uscr
ipt
A
uthor Man
uscr
ipt
A
uthor Man
uscr
ipt
A
uthor Man
uscr
ipt
Sex Age (y ears) Resident Male F emale 35–44 45–54 55–64 65–74 ≥75 Urban Rural 2006 1.7 (0.5) 0.7 (0.2) 1.1 (0.4) 0.8 (0.5) 0.9 (0.4) 0.7 (0.4) 1.2 (0.1) 1.9 (0.6) 0.6 (0.2) 2009 1.7 (0.5) 0.7 (0.2) 1.5 (0.4) 0.9 (0.5) 1.2 (0.4) 0.7 (0.4) 0.8 (0.1) 2.1 (0.6) 0.7 (0.2) 2011 3.8 (0.5) 1.5 (0.2) 4.2 (0.4) 3.3 (0.5) 2.3 (0.4) 1.9 (0.4) 1.1 (0.1) 3.4 (0.6) 1.9 (0.2) P for trend < 0.001 < 0.001 < 0.001 < 0.001 0.003 0.04 0.003 < 0.001 < 0.001 P for interaction ǂ 0.03 0.12 0.11Red meat, g/d
1997 60.3 (1.2) 55.0 (1.0) 64.0 (1.4) 57.2 (1.4) 55.5 (1.6) 57.4 (1.9) 54.5 (2.8) 72.5 (1.4) 44.6 (0.9) 2000 67.0 (1.1) 62.7 (0.9) 70.3 (1.3) 63.7 (1.2) 63.5 (1.5) 64.3 (1.7) 68.1 (2.6) 81.9 (1.3) 50.8 (0.8) 2004 65.2 (1.1) 60.7 (0.9) 69.1 (1.4) 63.5 (1.2) 59.9 (1.4) 58.8 (1.6) 59.0 (2.2) 74.8 (1.3) 51.6 (0.8) 2006 72.7 (1.1) 67.5 (0.9) 74.7 (1.3) 73.7 (1.2) 65.0 (1.3) 64.9 (1.6) 67.9 (2.1) 84.4 (1.3) 57.4 (0.8) 2009 76.9 (1.0) 70.2 (0.8) 78.1 (1.4) 75.4 (1.2) 71.8 (1.2) 66.3 (1.5) 69.6 (2.0) 82.9 (1.2) 63.3 (0.8) 2011 82.2 (1.0) 74.2 (0.8) 84.5 (1.5) 78.7 (1.3) 76.7 (1.2) 68.9 (1.5) 73.7 (1.9) 89.0 (1.2) 67.0 (0.8) P for trend < 0.001 < 0.001 < 0.001 < 0.001 < 0.001 < 0.001 < 0.001 < 0.001 < 0.001 P for interaction ǂ 0.40 0.07 < 0.001 Pr
ocessed meat, g/d 1997
A
uthor Man
uscr
ipt
A
uthor Man
uscr
ipt
A
uthor Man
uscr
ipt
A
uthor Man
uscr
ipt
Sex Age (y ears) Resident Male F emale 35–44 45–54 55–64 65–74 ≥75 Urban Rural P for trend 0.03 0.01 0.07 0.09 0.05 0.02 0.84 <0.001 0.12 P for interaction ǂ 0.50 0.60 <0.001 Fruit, g/day 1997 20.4 (1.4) 23.0 (1.4) 21.3 (1.8) 21.4 (1.9) 20.5 (2.2) 18.0 (2.4) 14.5 (3.6) 33.1 (2.0) 9.2 (1.1) 2000 16.7 (1.3) 18.6 (1.3) 14.5 (1.7) 17.4 (1.6) 18.7 (2.0) 19.8 (2.1) 12.9 (3.3) 21.0 (1.8) 9.7 (1.0) 2004 20.9 (1.3) 25.2 (1.3) 21.0 (1.8) 22.7 (1.6) 25.1 (1.9) 20.6 (2.0) 21.4 (2.9) 35.7 (1.8) 10.5 (1.0) 2006 40.4 (1.3) 45.9 (1.2) 46.2 (1.7) 47.0 (1.7) 38.9 (1.8) 38.6 (2.0) 28.2 (2.7) 67.4 (1.8) 24.7 (0.9) 2009 40.9 (1.2) 51.9 (1.2) 49.2 (1.8) 50.9 (1.6) 42.0 (1.6) 42.0 (2.0) 36.2 (2.5) 66.1 (1.8) 30.9 (0.9) 2011 64.7 (1.2) 69.7 (1.2) 79.2 (1.9) 65.0 (1.7) 62.9 (1.6) 59.4 (1.9) 60.0 (2.5) 72.8 (1.7) 58.7 (0.9) P for trend < 0.001 < 0.001 < 0.001 < 0.001 < 0.001 < 0.001 < 0.001 < 0.001 < 0.001 P for interaction ǂ 0.007 < 0.001 < 0.001 Vegetable, g/d 1997
240 (3.1) 237 (2.7) 247 (3.5) 253 (3.8) 249 (4.5) 233 (5.2) 221 (7.5) 251 (3.4) 228 (2.6) 2000 267 (2.9) 257 (2.5) 272 (3.2) 278 (3.4) 274 (4.2) 250 (4.6) 225 (7.1) 262 (3.1) 258 (2.3) 2004 290 (2.8) 279 (2.5) 290 (3.4) 301 (3.3) 297 (3.9) 282 (4.4) 253 (6.1) 256 (3.1) 296 (2.3) 2006 290 (2.8) 280 (2.4) 288 (3.3) 301 (3.4) 299 (3.7) 288 (4.3) 254 (5.8) 300 (3.0) 274 (2.2) 2009 288 (2.7) 282 (2.3) 289 (3.5) 302 (3.4) 298 (3.4) 287 (4.2) 248 (5.4) 296 (3.0) 277 (2.2) 2011 327 (2.7) 311 (2.3) 341 (3.7) 327 (3.4) 322 (3.4) 319 (4.1) 295 (5.2) 325 (2.9) 313 (2.2) P for trend < 0.001 < 0.001 < 0.001 < 0.001 < 0.001 < 0.001 < 0.001 < 0.001 < 0.001 P for interaction ǂ 0.04 0.27 0.006 Nuts, g/d 1997 3.5 (0.3) 2.6 (0.2) 3.2 (0.3) 3.6 (0.3) 3.2 (0.4) 1.9 (0.4) 1.9 (0.5) 2.9 (0.3) 2.8 (0.2) 2000 4.2 (0.3) 3.2 (0.2) 4.0 (0.3) 4.0 (0.3) 4.1 (0.4) 2.9 (0.4) 1.8 (0.5) 3.6 (0.3) 3.4 (0.2) 2004 3.9 (0.3) 3.0 (0.2) 3.4 (0.3) 3.9 (0.3) 3.8 (0.4) 2.7 (0.3) 3.0 (0.4) 4.0 (0.3) 2.8 (0.2) 2006 3.9 (0.3) 3.4 (0.2) 3.4 (0.3) 4.3 (0.3) 3.7 (0.3) 3.6 (0.3) 3.4 (0.4) 4.8 (0.3) 2.7 (0.2) 2009 5.1 (0.3) 4.0 (0.2) 4.4 (0.3) 4.0 (0.3) 5.7 (0.3) 4.5 (0.3) 3.7 (0.4) 5.4 (0.3) 3.8 (0.2) 2011 5.9 (0.3) 5.7 (0.2) 5.7 (0.3) 6.7 (0.3) 6.1 (0.3) 4.8 (0.3) 4.3 (0.4) 7.1 (0.3) 4.8 (0.2) P for trend < 0.001 < 0.001 < 0.001 < 0.001 < 0.001 < 0.001 < 0.001 < 0.001 < 0.001 P for interaction ǂ 0.28 0.11 < 0.001