DOI:10.1051/0004-6361/201629590 c
ESO 2016
Astronomy
&
Astrophysics
The ALMA detection of CO rotational line emission in AGB stars
in the Large Magellanic Cloud
M. A. T. Groenewegen
1, W. H. T. Vlemmings
2, P. Marigo
3, G. C. Sloan
4,5,6, L. Decin
7, M. W. Feast
8,9,
S. R. Goldman
10, K. Justtanont
2, F. Kerschbaum
11, M. Matsuura
12, I. McDonald
13, H. Olofsson
2, R. Sahai
14,
J. Th. van Loon
10, P. R. Wood
15, A. A. Zijlstra
13, J. Bernard-Salas
16, M. L. Boyer
17,18, L. Guzman-Ramirez
19,20,
O. C. Jones
6, E. Lagadec
21, M. Meixner
6, M. G. Rawlings
22, and S. Srinivasan
231 Koninklijke Sterrenwacht van België, Ringlaan 3, 1180 Brussels, Belgium
e-mail:[email protected]
2 Department of Earth and Space Sciences, Chalmers University of Technology, Onsala Space Observatory, 439 92 Onsala, Sweden 3 Department of Physics and Astronomy G. Galilei, University of Padova, Vicolo dell’Osservatorio 3, 35122 Padova, Italy 4 Cornell Center for Astrophysics & Planetary Science, Cornell Univ., Ithaca, NY 14853-6801, USA
5 Department of Physics and Astronomy, University of North Carolina, Chapel Hill, NC 27599-3255, USA 6 Space Telescope Science Institute, 3700 San Martin Dr., Baltimore, MD 21218, USA
7 Institute of Astronomy, Department of Physics and Astronomy, University of Leuven, Celestijnenlaan 200D, 3001 Leuven,
Belgium
8 Astronomy Department, University of Cape Town, 7701 Rondebosch, South Africa 9 South African Astronomical Observatory, PO Box 9, 7935 Observatory, South Africa 10 Lennard-Jones Laboratories, Keele University, Staffordshire ST5 5BG, UK
11 Department of Astrophysics, University of Vienna, Türkenschanzstr. 17, 1180 Vienna, Austria
12 School of Physics and Astronomy, CardiffUniversity, Queen’s Buildings, The Parade, Cardiff, CF24 3AA, UK 13 Jodrell Bank Centre for Astrophysics, School of Physics and Astronomy, University of Manchester, Oxford Road,
Manchester M13 9PL, UK
14 Jet Propulsion Laboratory, MS 183-900, California Institute of Technology, Pasadena, CA 91109, USA
15 Research School of Astronomy & Astrophysics, The Australian National University, Canberra, ACT 2611, Australia 16 Department of Physical Sciences, The Open University, MK7 6AA, Milton Keynes, UK
17 Observational Cosmology Lab, Code 665, NASA Goddard Space Flight Center, Greenbelt, MD 20771, USA 18 Department of Astronomy, University of Maryland, College Park, MD 20742, USA
19 European Southern Observatory, Alonso de Córdova 3107, Santiago, Chile
20 Leiden Observatory, Leiden University, Niels Bohrweg 2, 2333 CA Leiden, The Netherlands
21 Laboratoire Lagrange, Université Côte d’Azur, Observatoire de la Côte d’Azur, CNRS, Bd de l’Observatoire, CS 34229,
06304 Nice Cedex 4, France
22 East Asian Observatory, 660 N. A’ohoku Place, University Park, Hilo, Hawaii 96720, USA
23 Institute of Astronomy & Astrophysics, Academia Sinica, 11F, Astronomy-Mathematics Building, No. 1, Roosevelt Rd., Sec 4,
10617 Taipei, Taiwan, R.O.C.
Received 26 August 2016/Accepted 29 September 2016
ABSTRACT
Context.Low- and intermediate-mass stars lose most of their stellar mass at the end of their lives on the asymptotic giant branch (AGB). Determining gas and dust mass-loss rates (MLRs) is important in quantifying the contribution of evolved stars to the enrich-ment of the interstellar medium.
Aims.This study attempts to spectrally resolve CO thermal line emission in a small sample of AGB stars in the Large Magellanic Cloud (LMC).
Methods. The Atacama Large Millimeter Array was used to observe two OH/IR stars and four carbon stars in the LMC in the COJ=2−1 line.
Results.We present the first measurement of expansion velocities in extragalactic carbon stars. All four C stars are detected and wind expansion velocities and stellar velocities are directly measured. Mass-loss rates are derived from modelling the spectral energy distribution andSpitzer/IRS spectrum with the DUSTY code. The derived gas-to-dust ratios allow the predicted velocities to agree with the observed gas-to-dust ratios. The expansion velocities and MLRs are compared to a Galactic sample of well-studied relatively low MLRs stars supplemented with extreme C stars with properties that are more similar to the LMC targets. Gas MLRs derived from a simple formula are significantly smaller than those derived from dust modelling, indicating an order of magnitude underestimate of the estimated CO abundance, time-variable mass loss, or that the CO intensities in LMC stars are lower than predicted by the formula derived for Galactic objects. This could be related to a stronger interstellar radiation field in the LMC.
Conclusions. Although the LMC sample is small and the comparison to Galactic stars is non-trivial because of uncertainties in their distances (hence luminosities), it appears that for C stars the wind expansion velocities in the LMC are lower than in the solar neighbourhood, while the MLRs appear to be similar. This is in agreement with dynamical dust-driven wind models.
1. Introduction
Low- and intermediate-mass stars (LIMS) have initial masses of ∼0.8−8M, depending somewhat on metallicity. They end their
lives with an intense mass-loss episode on the asymptotic giant branch (AGB). In a classical picture (Wood1979), stellar pulsa-tion and dust formapulsa-tion drive a slow, cool wind. This wind from AGB stars is one of the main sources that enriches the interstellar medium (ISM) with gas and dust.
To quantify the level of enrichment and compare it to other sources, like supernovae or dust growth in the ISM, one has to determine the mass-loss rate (MLR) in the gas and dust of AGB stars. Typically, the dust MLR is determined by modelling the spectral energy distribution (SED) and is especially sensitive to infrared photometry. The gas MLR is determined by mod-elling the rotational-vibrational transitions of carbon monox-ide (CO). The dust MLR is directly proportional to the (dust) expansion velocity of the wind, which is a priori unknown, and cannot be determined from the SED fitting. Expansion veloci-ties are known for hundreds of AGB stars in the Galaxy, through CO thermal line emission (e.g. Kerschbaum & Olofsson1999; Olofsson et al.2002, for M stars; Groenewegen et al.2002, for C stars) or OH maser line for O-rich sources (see the database by Engels & Brunzel2015).
For stars that are beyond a few kpc, determining expan-sion velocities becomes more difficult especially in the CO line. In part this is a sensitivity issue of the receivers and tele-scopes; in part the AGB population that one traces (outside the Galactic disc for example) may be constituted of stars of lower mass that may have an inherently lower MLR and thus fainter line emission.
The first indication that the wind expansion velocities of AGB stars depend on environment (metallicity) came with the detection of C stars in the Galactic halo. Groenewegen et al. (1997) detected CO (2−1) emission in the source IRAS 12560+1656, while Lagadec et al. (2010) detected COJ= 3−2 emission in that source and five others. The expansion ve-locities were lower than those of C stars in the Galactic disc, where the expansion velocity in IRAS 12560 was as low as ∼3 km s−1.
Hydrodynamical wind models for C stars by Wachter et al. (2008) predict that expansion velocities in the Large Magellanic Cloud (LMC) are indeed about 2.2±0.2 times lower than for solar metallicities, while dust-to-gas ratios are slightly larger (by a factor of∼1.3), and mass-loss rates are relatively unchanged.
Since maser emission is stronger than thermal emission, at-tempts have been made to detect OH emission in the Magellanic Clouds (MCs). Wood et al. (1992) reported the detection in six AGB and RSG stars observed in the LMC and no detection in the Small Magellanic Cloud (SMC). Marshall et al. (2004) added a few detections in the LMC. The most current research study is presented by Goldman et al. (2016), adding new detections and re-analysing previous data, resulting in accurate expansion ve-locities for 13 OH/IR stars in the LMC. They suggest that the expansion velocity is proportional to metallicity and luminosity, L, asL0.4.
Recently, Matsuura et al. (2016) detected CO line emis-sion in the bright LMC RSGs WOH G64 (one line) and IRAS 05280−6910 (J=6−5 to 15−14). The data were obtained using theHerschelPACS and SPIRE instruments. The spectral resolution is insufficient to resolve the lines, but, they took the wind expansion velocity from an OH measurement and mod-elled the CO line emission in IRAS 05280 and derived a MLR.
It would be extremely interesting to extend this type of anal-ysis to carbon-rich stars and to larger samples so that a meaning-ful comparison to Galactic objects could be made. The collect-ing area and small beam of the Atacama Large Millimeter Array (ALMA) is required to detect spectrally resolved CO lines in the MCs.
This paper describes the first results of such a programme. The target list is presented in the next section. The ALMA ob-servations and results are presented in Sect. 3. These results are discussed in Sect. 4 where they are compared to predic-tions of radiatively driven wind theory, and the results for the LMC are compared to a Galactic sample. The evolutionary sta-tus of the stars is examined with the aid of AGB stellar models. Conclusions are presented in Sect. 5.
2. Targets
Four carbon (C) stars and two oxygen-rich AGB stars were selected from the sample of about 225 C and 170 M stars studied by Groenewegen & Sloan (in prep., hereafter GS16). This sample constitutes essentially all AGB stars and red super-giants (RSG) in the SMC and LMC observed with the Infrared Spectrograph (IRS) onSpitzer. The GS16 study constructed the SED and fitted the SED and IRS spectrum with the radiative transfer (RT) code “More of DUSTY” (MoD; Groenewegen 2012). The fitting procedure estimates luminosity and (dust) mass-loss rate. In addition GS16 determined the pulsation peri-ods for many of the stars based on a (re-)analysis of available multi-epoch photometry. This included the OGLE, MACHO, and EROS photometric survey data,K-band data available in the literature for the redder sources, combined withK-band epoch photometry from the VMC survey (Cioni et al. 2011), data in the mid-IR from the SAGE-Var programme (Riebel et al.2015, mostly the 4.5µm data), andW2 filter data from the AllWISE multi-epoch photometry (Wright et al.2010) and NEO-WISE mission (Mainzer et al.2011; see also Sloan et al.2016).
Simple formulae (and supported by detailed RT calculations carried out in the preparation of the ALMA proposals) such as found in Olofsson (2008) indicate that the expected flux in the low-level transitions of CO is proportional to∼M˙1.2f0.7
CO, where fCOis the abundance of CO relative to H2. The best estimate for the MLR in making the line-flux predictions comes from mod-elling the dust (GS16), but then an uncertain dust-to-gas ratio (DTG) must be assumed. Given all these uncertainties and the sensitivity of ALMA it was evident that only the sources with the largest MLR estimates could potentially be detected.
Table1lists the final sample. As an indication of their red-ness, the two OH/IR stars have the 4th and 6th largest estimated dust optical depth of the 170 M stars studied in GS16, while the four C-stars are ranked between 2nd and 17th among 225 C stars. The dust optical depth, luminosity, and pulsation properties (pe-riod, (semi-)amplitude, and in which filter) are taken from GS16 (see also Sloan et al.2016). All objects are large-amplitude vari-ables (LPVs).
3. Observations and analysis
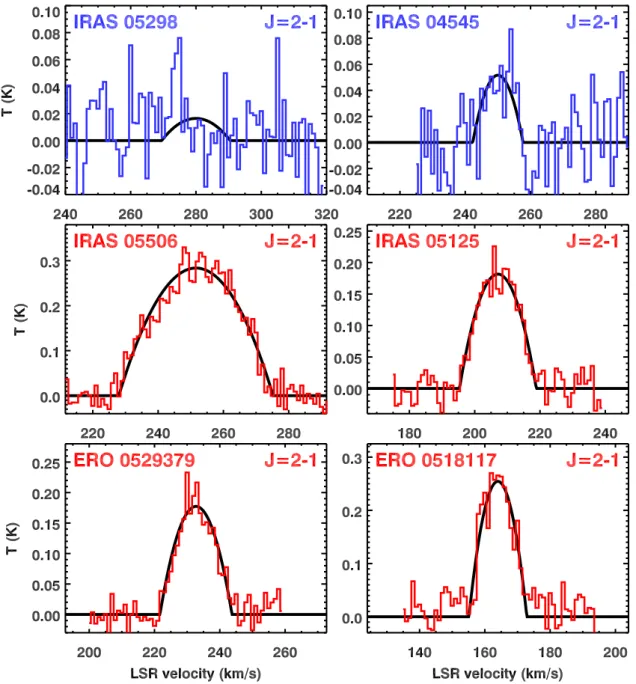
Fig. 1.CO (2−1) profiles of the 2 OH/IR (top, in blue) and 4 carbon stars. The solid line is a fit to the data using Eq. (1). The fit to IRAS 05298 is not significant; see Table2.
were centred on 212.791, 214.789, and 227.782 GHz. Owing to Hanning smoothing, the effective velocity resolution in the line spectral window was ∼0.64 km s−1. The observations covered a baseline range of ∼15−350 m providing a maximum recov-erable scale of∼10.500. The total observing time was 3.9 h of
which 2.1 h were spread equally over the six sources.
We calibrated the data using the CASA 4.2.2 pipeline. Manual calibration with CASA 4.5.2 yielded consistent re-sults. Ganymede and Callisto were used as flux calibrators, and the quasars J1107−4449, J0750+1231, J0519−4546, and J0538−4405 were used for bandpass calibration depending on the date of observation. The quasar J0635−7516 was used for complex-gain calibration at all observing dates.
After calibration, continuum images were produced using natural weighting. Where needed, continuum subtraction was performed and the CO(2−1) line was imaged averaging to 1 km s−1 spectral resolution. Both for continuum and the line images, the typical beam size is 1.700 ×1.200, at a position
angle of ∼80◦. The typical rms noise in the continuum im-ages is∼45µJy beam−1 and that in the line maps ranges from 3.1−4.1 mJy beam−1.
The maximum baseline (and thus the size of the beam) was chosen to match the expected CO photodissociation radius based on the formula of Mamon et al. (1988) so that the emission re-gion remains unresolved.
Line profiles were extracted from an area typically twice the beam size and converted to a temperature scale within CASA. Figure1 shows the observed line profiles. All four C stars are detected, and one of the two OH/IR stars was detected. The line profiles were fitted with a “Shell” profile as defined in the CLASS/GILDAS software package1,
P(V)= A
∆V(1+H/3) 1+4H
V−V?
∆V
2!
, (1)
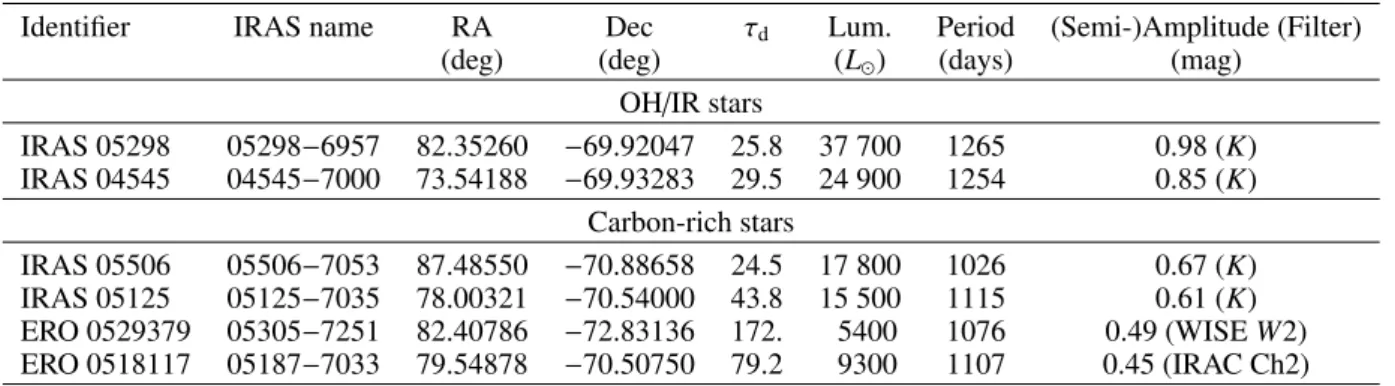
Table 1.LMC targets and some properties.
Identifier IRAS name RA Dec τd Lum. Period (Semi-)Amplitude (Filter)
(deg) (deg) (L) (days) (mag)
OH/IR stars
IRAS 05298 05298−6957 82.35260 −69.92047 25.8 37 700 1265 0.98 (K) IRAS 04545 04545−7000 73.54188 −69.93283 29.5 24 900 1254 0.85 (K)
Carbon-rich stars
IRAS 05506 05506−7053 87.48550 −70.88658 24.5 17 800 1026 0.67 (K) IRAS 05125 05125−7035 78.00321 −70.54000 43.8 15 500 1115 0.61 (K) ERO 0529379 05305−7251 82.40786 −72.83136 172. 5400 1076 0.49 (WISEW2) ERO 0518117 05187−7033 79.54878 −70.50750 79.2 9300 1107 0.45 (IRAC Ch2)
Notes.Dust optical depth,τd, at 0.5µm, luminosity and variability information (from GS16).
Table 2.Results of the COJ=2−1 observations.
Identifier v? vexp A Tpeak rms Gas ˙Mb
(km s−1) (km s−1) (K km s−1) (K) (K) (Myr−1)
OH/IR stars
IRAS 05298 280a 10.5a <0.36 <0.027 0.028 <2.8 ×10⁻⁶ IRAS 04545 250a 7.7a 0.53±0.09 0.053±0.009 0.026 3.3×10⁻⁶
Carbon-rich stars
IRAS 05506 251.6±0.3 23.63±0.42 8.94±0.19 0.284±0.006 0.027 3.5×10⁻⁵ IRAS 05125 207.1±0.3 11.77±0.15 2.85±0.12 0.183±0.007 0.024 1.0×10⁻⁵ ERO 0529379 232.7±0.3 11.04±0.41 2.61±0.09 0.178±0.007 0.019 8.9×10⁻⁶ ERO 0518117 164.0±0.3 8.87±0.52 3.01±0.15 0.257±0.013 0.033 9.0×10⁻⁶
Notes.(a)Stellar velocity and expansion velocity for the OH/IR stars from Goldman et al. (2016), and fixed in the fitting.(b)Gas MLR based on
Eq. (2); see text for assumed parameters.
where V? is the stellar velocity (in km s−1, throughout the paper the LSR frame is used), A is the integrated intensity (in K km s−1),∆Vthe full width at zero intensity (in km s−1, and the expansion velocityvexpis taken as half that value), andHthe horn-to-centre parameter. This parameter describes the shape of the profile, and is−1 for a parabolic profile, 0 for a flat-topped one, and>0 for a double-peaked profile. The parameterHwas fixed to−1 in the fitting. For IRAS 05506, the star with the best-determined profile, we also fitted a profile allowing this parame-ter to vary as well and foundH=−1.02±0.02. A parabolic pro-file indicates optically thick, unresolved emission. Table2lists the results. For the two OH/IR stars the stellar and expansion ve-locity were fixed to the values determined from OH observations (Goldman et al.2016) because of the poor signal-to-noise ratio in the spectra. The results for IRAS 05298 are not significant (Tpeak=0.016 ±0.009 K) and 3σupper limits are reported.
4. Discussion
In the remainder of this paper we focus mainly on the outflow velocities from the carbon stars. For the OH/IR stars the ex-pansion velocities are better determined from the OH profiles (Goldman et al.2016), and for all 6 sources a detailed analysis of the CO line strength in terms of the (gas) MLR is deferred until the J =3−2 data are in hand. Goldman et al. discuss the 13 known OH/IR stars in the LMC (there are still none known in the SMC) and compare the expansion velocities to Galactic counterparts.
4.1. Predictions by dust-driven wind theory
The DUSTY code can be run in “density type=3” mode, i.e. the mode where the hydrodynamical equations of dust and gas are solved and the gas expansion velocity and gas MLR are pre-dicted (Ivezi´c & Elitzur 1995,2010). The velocities and MLR given by DUSTY scale as (L/104)0.25((rgd/200)(ρd/3))−0.5 and (L/104)0.75((r
gd/200)(ρd/3))0.5, respectively, whereL is the lu-minosity in solar units,rgd the gas-to-dust ratio, andρdthe spe-cific density of the dust grains in g cm−3.
MoD (Groenewegen2012) was modified to fit photometric and spectroscopic data when running DUSTY in “density type =3” mode. The fitted parameters are luminosity, dust optical depth, and dust temperature at the inner radius. This is one pa-rameter less than the version used by GS16 where the slope of the density law (∼r−p) could also be fitted. In “density type=3” mode, the density varies as∼r−2 once the terminal velocity is reached.
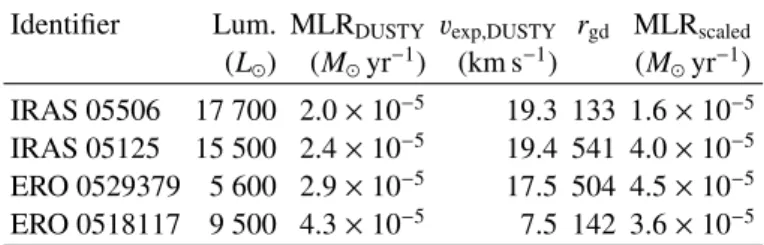
Table 3 presents the results. Appendix A shows the fitted models. The luminosities agree well with the values determined by GS16 (as repeated in Col. 6 in Table1). The next column lists the MLR and expansion velocity for a gas-to-dust ratio of 200, scaled to the actual luminosity and grain density used in the fitting. One can then compare this predicted expansion velocity to the observed value and determine the gas-to-dust ratio that makes them equal (reported in Col. 5) and then scale the MLR using this value (reported in Col. 6). The results do not depend too strongly on the luminosity,rgd ∼
√
Table 3.DUSTY modelling of the LMC carbon stars.
Identifier Lum. MLRDUSTY vexp,DUSTY rgd MLRscaled (L) (Myr−1) (km s−1) (Myr−1)
IRAS 05506 17 700 2.0×10⁻⁵ 19.3 133 1.6×10⁻⁵ IRAS 05125 15 500 2.4×10⁻⁵ 19.4 541 4.0×10⁻⁵ ERO 0529379 5 600 2.9×10⁻⁵ 17.5 504 4.5×10⁻⁵ ERO 0518117 9 500 4.3×10⁻⁵ 7.5 142 3.6×10⁻⁵
Notes.Columns 3 and 4 give the gas MLR and gas expansion velocity for a gas-to-dust ratio of 200. Column 5 gives the gas-to-dust ratio that makes the observed expansion velocity equal to the observed gas-to-dust ratio, and the last column lists the gas MLR for that gas-to-gas-to-dust ratio.
The statistical fitting error in the luminosity is about 10%, to which one should add the uncertainty in the distance (L ∼d2). The DUSTY manual states that the MLR calculated in the “den-sity type=3” mode has an inherent uncertainty of∼30%. The implications are further discussed below.
4.2. A Galactic comparison sample
Because the dust-driven wind theory predicts that the expansion velocity depends on the gas-to-dust ratio, it is of interest to com-pare expansion velocities, luminosities, and MLRs of the LMC targets to Galactic C stars.
Expansion velocities exist for hundreds of Galactic AGB stars, but reasonable estimates of distances (and thus lu-minosities), and, especially, MLR estimates derived from de-tailed modelling are much rarer. The Galactic sample of ordi-nary C stars is taken from Ramstedt & Olofsson (2014) and Danilovich et al. (2015), which both derive MLR estimates from multi-transitional CO data and detailed RT modelling.
Both samples contain 19 C stars, of which two are in com-mon, V384 Per and R Lep. Distances are taken from the lit-erature and based on a variety of methods that include revised H
ipparcos
parallax data, or the period-luminosity (PL) relation from Groenewegen & Whitelock (1996) for Miras2. The model is fitted to ground-based COJ =1−0, 2−1, 3−2, and 6−5 data, while Danilovich et al. (2015) additionally useHerschel/HIFI J = 5−4 and 9−8 data (and more transitions for selected sources). Both studies model the SEDs with DUSTY to provide the dust optical depth and dust temperature profile that enters in the calculations of the CO line transfer, and both studies use the Monte Carlo RT code developed by Schöier & Olofsson (2001). These two papers provide a sizeable sample of uniformly modelled AGB stars with probably the most accurately deter-mined MLRs currently available in the literature, but the samples contain only one source as red as the LMC targets.Therefore we also considered the∼30 sources classified as “extreme carbon stars” (Volk et al. 1992; “group V” sources from Groenewegen et al. 1992). These sources were identi-fied based on IRAS photometry and the shape of the IRAS LRS spectrum. Later, Speck et al. (2009) studied 10 of these sources (one new) using superior ISO/SWS spectra. Many of
2 Only two of these 36 (and none of the 7 extreme C stars discussed
be-low) have a parallax in theGaiaData Release 1 (Lindegren et al.2016) and have values that are consistent within the errors with the adopted distances in the literature.
these sources have the silicon carbide feature in absorption, as seen in ERO 0529379.
Distances are a challenge for Galactic sources. Therefore, we have selected only the seven extreme carbon stars with known pulsation periods. Table 4 lists the sample of extreme carbon stars. AFGL 3068 is the only star in common with the com-parison sample from Ramstedt & Olofsson (2014). All stars are LPVs. The longest period is similar to the three LMC targets and the periods range between∼700 and 1060 days. The CO-based expansion velocities in Col. 5 are from Groenewegen et al. (2002) . We determined the luminosities using thePLrelation of Groenewegen & Whitelock (1996), as for many stars in the local C-star sample.
The SED and mid-IR spectra (ISO/SWS or IRAS/LRS) are fitted using the modified MoD code using the “density type=3” mode, as for the LMC targets. For the assumed luminosity, the best-fitting distance (Col. 6) is determined. The remaining four columns have identical meanings as for the LMC targets: the ex-pansion velocity and MLR for a gas-to-dust ratio of 200, the gas-to-dust ratio required to obtain the observed velocity, and the MLR for that gas-to-dust ratio. The models fitted to SEDs and spectra are shown in AppendixB.
4.3. A preliminary synthesis
Figure2 compares the LMC targets to the Galactic sample of standard and extreme C stars. The panels show the expansion velocity against logP (for the local sample, only Miras were selected in this case, as the Galactic extreme C stars and the LMC targets are LPVs), expansion velocity against logL, and MLR versus logL. The luminosities for the LMC stars are de-rived from the SED fitting (and an assumed distance), while for the extreme C stars they are derived from the PL relation by Groenewegen & Whitelock (1996). For three of the four LMC stars the luminosity derived from the modelling is con-sistent with this PL relation. For periods between 1026 and 1150 days thePLrelation predicts luminosities between 15 800 and 17 300 L, in good agreement with the luminosities of
IRAS 05506 and 05125. The scatter in the observed PL rela-tion is 0.26 mag, and thus the luminosity of ERO 0518117 is consistent with thePLrelation at the 2σlevel. ERO 0529379 is underluminous (see below).
The Galactic extreme carbon stars indeed extend the more local sample to longer periods and higher luminosities, larger ex-pansion velocities, and larger MLRs, and they match the proper-ties of the four LMC stars better. The gas-to-dust ratio needed to obtain the observed expansion velocity for the Galactic extreme C stars shows two deviating values (67 and 477), but the five other stars show remarkably consistent values between 156 and 234 with a median of 191.
The situation is less obvious for the LMC stars. Two stars re-quire a value close to∼135, while the other two needrgd ∼520. Goldman et al. (2016) find a median value of 416 when using a similar technique to analyse OH/IR stars A higher value might be expected as the metallicity is lower in the LMC, but C stars dredge-up carbon from the interior in a way that is relatively in-sensitive of the initial metallicity and so the production of C-rich dust may be larger with respect to the gas content in MC stars than in the Galaxy, which would point torgd values lower than ∼200.
Table 4.Galactic extreme carbon stars.
Identifier Other name Period Amp. (Fil.) Ref. vexp Lum. d MLRDUSTY vexp,DUSTY rgd MLRscaled (days) (mag) (km s−1) (L
) (kpc) (10−5Myr−1) (km s−1) (10−5Myr−1)
AFGL 190 01144+6658 1060 1.2 (L) 1 18.0 16 400 3.30 5.7 10.5 67 3.3 AFGL 341 02293+5748 815 0.9 (L) 1 14.2 12 500 2.81 2.6 14.2 199 2.6 IRAS 03448+4432 AFGL 5102 729 0.7 (K) 2 13.3 11 100 2.31 1.4 20.6 477 2.2 AFGL 865 06012+0726 696 0.9 (K) 3 16.6 10 600 1.72 1.5 17.9 234 1.6 IRAS 08074-3615 V688 Pup 832 0.9 (K) 4 21.7 12 700 2.95 2.0 19.2 156 1.7 AFGL 2494 19594+4047 783 1.0 (L) 5 20.5 12 000 1.50 1.4 20.0 191 1.3 AFGL 3068 23166+1655 696 0.9 (K) 3 15.1 10 600 1.05 3.9 13.9 168 3.6
References.For the pulsation periods and semi-amplitudes are (1) Groenewegen et al. (1998), based onL-band data from R. R. Joyce (1996, priv. comm.); (2) Kerschbaum et al. (2006); (3) Le Bertre (1992); (4) Whitelock et al. (2006); and (5) Jones et al. (1990). The output from MoD for the gas MLR and expansion velocity scale with (rgd/200)pwith powerp=0.5 and−0.5, respectively.
Fig. 2. Four C-stars (filled red squares) in the LMC, Galactic C stars from Ramstedt & Olofsson (2014) and Danilovich et al. (2015) (open squares), and Galactic extreme C stars (filled black squares). The stars in overlap in the local sample are connected (R Lep, logP ∼ 2.64,
logL∼3.75, and V384 Per, logP∼2.72,logL∼3.92), as well as the
two independent estimates for AFGL 3068 (logP∼2.84, logL∼4.03).
The sample of Groenewegen et al. (2002) contains expansion velocities for 309 C stars, and 8 (or∼3%) have velocities be-low 8.5 km s−1, while 15% have velocities above 25 km s−1. The median value of the expansion velocity of the stars with luminosities above 5400 L (the lowest of the LMC stars) is
17.6 km s−1, while that for the 4 LMC C-stars is 11.4 km s−1. Although the LMC sample is small, and the selection of, and the comparison to, a suitable Galactic sample is non-trivial, it seems consistent with the finding for the Galactic halo C stars that the expansion velocities are smaller at lower metallicity. Hydrodynamical wind models by Wachter et al. (2008) support this trend.
The MLRs of the four stars turn out to be very similar and in agreement with the MLRs found for the Galactic extreme C stars. When plotted against luminosity there is one obvi-ous outlier, ERO 0529379. Its luminosity is low in an absolute sense, but also low for its pulsation period, which is similar to IRAS 05125 and IRAS 05506; these stars have similarly high luminosities. It is the only target with SiC in absorption (see Fig.A.1), so its very large MLR is not in question. One pos-sibility is that the modelling assumption of spherical symme-try is not valid. This might be the case, but the width of the CO profile favours the assumption of expansion in a stellar out-flow. Keplerian discs are known in only two objects, the Red Rectangle (Bujarrabal et al.2003) and AC Her (Bujarrabal et al. 2015), both post-AGB objects. Other objects may also have discs (Bujarrabal et al.2013) but objects with discs are observationally characterised by narrow line profiles, with a width of<∼5 km s−1 in most cases; although theoretically the line profile may not nec-essarily be narrow as it depends on the inclination angle (see Homan et al.2015).
Sloan et al. (2016) showed that in the LMC, the pulsation amplitude of the carbon stars increases as they grow redder, but it peaks before they have reached their reddest colours. These au-thors suggested that the stars beyond that peak may have evolved offof the AGB. Two of the carbon stars in our sample are beyond that peak. Even if their long periods and the outflow velocity of ERO 0529379 imply that they could not have evolved far from the AGB, the low luminosity of ERO 0529379 suggests that it may have a non-spherical geometry, which could be another in-dication of post-AGB evolution.
4.4. ERO 0518117
The CO observations now show that this object has the small-est expansion velocity of the four stars (but this may be statis-tically insignificant), and has a radial velocity of 164 km s−1. This is very atypical for the LMC for which Olsen et al. (2011) give a mean radial velocity of 263 km s−1 with a dispersion of 26 km s−1, but coincides with the velocity of the SMC for which Dobbie et al. (2014) find a mean radial velocity of 150 km s−1, and a dispersion of 26 km s−1. The star is located at about 4 degrees from the LMC centre and at its location the rotation of the LMC disc is such (van der Marel et al.2002; Olsen et al. 2011) that the line-of-sight velocity is about 220 km s−1. This reduces the difference with the mean SMC velocity, but it is re-mains large.
It is unclear how to interpret these properties. Olsen et al. (2011) present evidence that the LMC has accreted stars from the SMC, but this seems unlikely for this particular object. Evolved stars of this redness are not present among SMC stars in the GS16 sample, and specific searches for very dusty post-main-sequence objects in the MCs using far-infrared Heritage data (Meixner et al. 2013) have not turned up any such AGB stars in the SMC (Jones et al.2015; for the AGB star BMB-B 75 the far-IR emission is believed to be associated with a galaxy in the line of sight of the object, which would explain its redness in the mid-infrared).
4.5. Evolutionary considerations
Ventura et al. (2016) investigated the nature of the most ob-scured C-rich AGB sources in the MCs. They combined the ATON and MONASH stellar evolution codes with a dust for-mation prescription, and they concluded that the reddest C-rich sources have initial mass 2.5−3Min the LMC (withZ =0.008)
and∼1.5 Min the SMC (withZ =0.004). The difference
be-tween the galaxies is due to the difference in star formation histo-ries. These authors predict that the LMC sources have [3.6−4.5] colours of 3.4, luminosities in the range 8000−10 000L, MLRs
of order 15 × 10−5 M
yr−1, and SiC in absorption.
These parameters are close to the two ERO sources, which have [3.6−4.5] colours of 2.5−2.7, and ERO 0529379, which has SiC in absorption. The difference in MLRs is a factor of 3, but this could be because of differences in the calculation of the absorption coefficients of the grains.
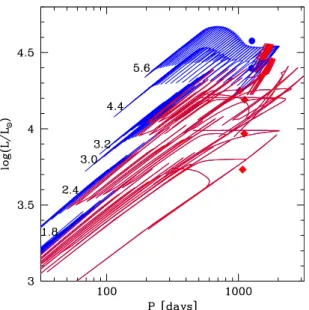
Figure3shows the evolution of the fundamental-mode pe-riod and luminosity during the TP-AGB phase for a few initial masses with metallicity Z = 0.006 based on the evolutionary models of Marigo et al. (2013) calculated with the COLIBRI
code. Pulsation periods for the fundamental mode are calcu-lated with the theoretical period-mass-radius relation given by Eq. (5) of Wood (1990). Mass loss on the AGB is included in
COLIBRIusing the formalism described by Marigo et al. (2013), updated as by Rosenfield et al. (2014, 2016), where the dust-driven regime follows an exponential increase as a function of stellar mass and radius. The results are similar to those ob-tained with the semi-empirical recipe introduced by Vassiliadis & Wood (1993).
The third dredge-up is one of the most uncertain processes in all TP-AGB models, so we opt to treat it with a parametric formalism. Its efficiency is assumed following the results of full stellar AGB calculations of Karakas et al. (2002), with subse-quent modifications as in Marigo & Girardi (2007). In the mod-els that experience hot-bottom burning (HBB), the third dredge-up is reduced compared to the original computations of Karakas. The changes in the surface chemical composition due to the third dredge-up and HBB are linked to the envelope
and atmospheric structures through the on-the-fly computation of molecular chemistry and opacities with the ÆSOPUS code (Marigo & Aringer2009). This is important for a consistent pre-diction of the effective temperatures during the TP-AGB phase. The stages with C/O<1 are indicated in blue and with C/O>1 in red. The 1.8, 3.0, and 3.2 M models experience the third
dredge-up, while the 4.4 and 5.6Mmodels experience the third
dredge-up and HBB. The observed points for the two OH/IR stars and four C stars are indicated with the blue circles and red diamonds, respectively.
The TP-AGB models can explain the location of the ob-served stars in the P-L diagram. The sizable excursions of the tracks both in luminosity and pulsation period are driven by the occurrence of thermal pulses. In all models the evolution is followed until they reach the stage of lowest possible eff ec-tive temperature (dictated by current mass and surface chem-ical composition), beyond which they invert the trend mov-ing towards higher temperatures and approachmov-ing the post-AGB stages. Regarding the C stars, their long periods are predicted to be reached during the last thermal pulses when intense mass loss is stripping the envelope, the total mass is reduced (down to 1−2 M), and the Hayashi evolutionary track for convective
stars shifts towards lower effective temperatures, yielding larger radii and, hence, longer periods. The initial masses of the pro-genitors should be in the approximate range 2−3 M, which
agrees with Ventura et al. (2016), and, more generally, with the typical mass range for the formation of C stars in the LMC, as indicated by their observed C-star luminosity function (Marigo & Girardi2007). The present TP-AGB models predict that the C stars will eventually become C−O white dwarfs with masses of 0.59−0.79M.
The two bright OH/IR stars are interpreted as initially mas-sive AGB stars in their final stages. The stars are well de-scribed by O-rich TP-AGB models with initial masses between 4.4−5.6 M. For IRAS 05298 this is consistent with the initial
mass estimate of∼4 M based on its membership of a cluster
(van Loon et al. 2001). The OH/IR stars should have experi-enced HBB in the previous stages, passing through overluminous stages well above the core-mass luminosity relation, as shown by the typical bell-shaped luminosity tracks in Fig.3. We expect that HBB is currently extinguished after most of the envelope is ejected by stellar winds, and the actual masses are≈2.0−2.6M.
Models predict that the stars will soon (in a few 10 000 yr) be-come C stars again due to a few final third dredge-up events (Frost et al.1998; Marigo et al.1998; van Loon et al.1999), and finally produce white dwarfs with masses of 0.95−1.05M. For
these specific models the final C-star stages take place after the stars have reached the minimum effective temperature and start to warm towards the post-AGB phase. The exact appearance of such late transition to the C-star domain critically depends on the efficiency of the third dredge-up.
While an overall good agreement between models and obser-vations on the P-L diagram is found, in a follow-up work we will perform a more detailed analysis to address various other aspects and their interplay (e.g. dust formation, radiative transfer across the dusty envelopes, expansion velocities, efficiency of the third dredge-up, HBB, and mass loss).
4.6. Gas MLRs
An estimate of the gas MLR can be made using the formula in Ramstedt & Olofsson (2008),
˙ M=sJ
Aθ2D2aJvbJ exp f
cJ
Fig. 3. Evolution of the fundamental-mode period and luminosity dur-ing the TP-AGB based on the evolutionary models of Marigo et al. (2013) computed with theCOLIBRIcode. Initial masses (in M) are
labelled and the metallicity isZ =0.006. The stages with C/O<1 are shown in blue and with C/O >1 in red. The observed points for the 2 OH/IR stars and 4 C-stars are indicated with the blue circles, and red diamonds, respectively.
where, for the J = 2−1 transition, sJ = (1.3 ± 0.7) ×
10−11 M
yr−1,aJ = 0.82, andbJ = 0.46,cJ = 0.59. The
dis-tance,D, is set to 50 kpc, and the averaged beam size,θ, is 1.4300. The integrated intensity,A, is taken from Table2.
The only parameter to fix is fCO, the CO abundance rela-tive to H2. The COLIBRIcode introduced in the previous sec-tion also predicts the abundances of various elements as a func-tion of evolufunc-tionary timescale. For a star of initial mass 2.4M,
what we believe is the mass of the extreme red C stars, fCOis roughly constant at 4.5 × 10⁻⁴ from the thermal pulse where the star turns into a C star until the end of the AGB evolution. This value basically depends only on the assumed initial oxygen abundance in the models. For massive intermediate-mass stars the time evolution of the CO abundance is much more complex due to HBB (which converts carbon into nitrogen), which is a function of time on the AGB (traced in the models by the pulsa-tion period as an observable proxy of time), details of the mod-elling of HBB, and initial mass. For a star of 4.4 M, the
typi-cal of the mass of the two OH/IR stars, at a pulsation period of about 1300 days, fCO is about 2.0 × 10⁻⁴, but is uncertain by at least a factor of 2. The CO-based MLRs are listed in the last column of Table2. These MLRs are compared to the dust-based MLRs in the last column of Table3 for the C stars, and to the dust-based MLRs from Goldman et al. (2016) for IRAS 05298 (8.4 ×10⁻⁵M
yr−1) and IRAS 04545 (7.1 ×10⁻⁵Myr−1).
These values systematically fall below those based on con-sistent modelling of the dust. The discrepancy is a factor >20 for the OH/IR stars, and it is a factor of 4−5 for the C stars with the exception of IRAS 05506, where the CO-based MLR is larger than that based on the dust modelling. In deriving Eq. (2), Ramstedt & Olofsson assume typical values of Galactic sources for the free parameter h = (100
rgd)( 2 ρd)(
0.05µm
ad ), withad the dust grain radius, in their models. A systematic difference of this pa-rameter between the solar neighbourhood and LMC likely has an effect on this relation.
If Eq. (2) is applicable and the dust-based MLRs are cor-rect, then the CO abundances must be substantially lower (by an order of magntiude) than assumed, and/or the observed CO in-tensities are lower than expected by a factor of∼7 for the C stars and>30 for the OH/IR stars based on Eq. (2). The dust emission and the CO J = 2−1 emission trace different radii in the en-velope, so one possible explanation for this difference between dust and CO based mass-loss rate is that it varies in time, which is a suggestion that was first made by Heske et al. (1990) in con-nection with Galactic OH/IR stars. Another possibility is that the interstellar radiation field (ISRF) is stronger in the LMC. Paradis et al. (2009) mention that, assuming the same spectral shape for the ISRF as in the solar neighbourhood, the ISRF in the diffuse LMC medium is∼5 times stronger. The strength of the [C
ii
] line relative to CO in LMC star-forming regions is much larger than in Milky Way star-forming regions, which also points to a stronger radiation field (Israel & Maloney 2009). Recent work by McDonald et al. (2015) and Zhukovska et al. (2015) have demonstrated the importance of the strength of the ISRF on the expected CO emission in clusters. Therefore, it is consis-tent that the largest difference between CO-based and dust-based MLR is observed for the IRAS 05298, which is known to be in a cluster. The influence of the ISRF and a full line radiative trans-fer modelling is detrans-ferred until the COJ =3−2 lines have been measured by ALMA.5. Summary and conclusions
The first results are presented of a programme that that aims to accurately determine gas and dust MLRs in AGB stars in the MCs. The keys to success are detection and modelling of CO thermal emission lines. In this paper we present observa-tions of the COJ=2−1 line of two OH/IR and four carbon stars in the LMC. The OH/IR stars are weaker than anticipated in this line, and only one OH/IR is marginally detected.
The detection of all four C stars in the CO J = 2−1 line allowed us to determine the expansion velocities and compare them to a sample of Galactic C stars, including extreme C stars that have MLRs as large as the LMC targets. Determining the gas MLR directly and through RT modelling is deferred until the COJ =3−2 data are in hand, and in this paper the MLR is determined from fitting the SED andSpitzer/IRS spectrum using the DUSTY code in the mode where the hydrodynamical equa-tions of dust and gas are solved and the expansion velocity and gas MLR are predicted.
These first results support the conclusions previously derived from CO observations of metal-poor C stars in the Galactic halo; at lower metallicity the expansion velocity in C stars is smaller and the MLR is similar to a comparable star at solar metallic-ity. It must be stressed, however, that our sample is small and finding a suitable sample of comparison stars in the Galaxy is challenging. Therefore, this conclusion awaits testing with im-proved samples both within the Galaxy and in the Magellanic Clouds.
Acknowledgements. This paper makes use of the following ALMA data:
grant G024112N. M.W.F. gratefully acknowledges the receipt of research grants from the National Research Foundation of South Africa (NRF). O.C.J. acknowl-edges support from NASA grant, NNX14AN06G. P.M. acknowlacknowl-edges support from the ERC Consolidator Grant funding scheme (project STARKEY, G.A. No. 615604). M.M. is supported by the STFC Ernest Rutherford fellowship. H.O. acknowledges financial support from the Swedish Research Council. R.S.’s con-tribution to the research described here was carried out at the Jet Propulsion Laboratory (JPL), California Institute of Technology, under a contract with NASA. G.C.S. was supported by the NSF through Award 1108645. J.v.L. ac-knowledges support from the UK Science and Technology Facility Council under grant ST/M001040/1. W.V. acknowledges support from the ERC through consol-idator grant 614264. A.Z. and I.M. acknowledge support from the UK Science and Technology Facility Council under grant ST/L000768/1.
References
Bujarrabal, V., Neri, R., Alcolea, J., & Kahane, C. 2003,A&A, 409, 573
Bujarrabal, V., Alcolea, J., Van Winckel, H., Santander-García, M., & Castro-Carrizo, A. 2013,A&A, 557, A104
Bujarrabal, V., Castro-Carrizo, A., Alcolea, J., & Van Winckel, H. 2015,A&A, 575, L7
Cioni, M., Clementini, G., Girardi, L., et al. 2011,A&A, 527, A116
Danilovich, T., Teyssier, D., Justtanont, K., et al. 2015,A&A, 581, A60
Dobbie, P. D., Cole, A. A., Subramaniam, A., & Keller, S. 2014,MNRAS, 442, 1663
Engels, D., & Brunzel, F. 2015,A&A, 582, A68
Frost, C. A., Cannon, R. C., Lattanzio, J. C., Wood, P. R., & Forestini, M. 1998,
A&A, 332, L17
Goldman, S. R., van Loon, J. Th., Zijlstra, A. A., et al. 2016, MNRAS, submitted Groenewegen, M. A. T. 2012,A&A, 543, A36
Groenewegen, M. A. T., & Whitelock, P. A. 1996,MNRAS, 281, 1347
Groenewegen, M. A. T., de Jong, T., van der Bliek, N. S., Slijkhuis, S., & Willems, F. J. 1992,A&A, 253, 150
Groenewegen, M. A. T., Oudmaijer, R. D., & Ludwig H.-G. 1997,MNRAS, 292, 686
Groenewegen, M. A. T., Whitelock, P. A., Smith, C. H., & Kerschbaum, F. 1998,
MNRAS, 298, 13
Groenewegen, M. A. T., Sevenster, M., Spoon, H. W. W., & Pérez, I. 2002,A&A, 390, 511
Gruendl, R. A., Chu, Y.-H., Seale, et al. 2008,ApJ, 688, L9
Heske, A., Forveille, T., Omont, A., van der Veen, W. E. C. J., & Habing, H. J. 1990,A&A, 239, 173
Homan, W., Decin, L., de Koter, A., et al. 2015,A&A, 579, A118
Israel, F., & Maloney, P. R. 2009,A&A, 531, A19
Ivezi´c, Ž, & Elitzur, M. 1995,ApJ, 445, 415
Ivezi´c, Ž, & Elitzur, M. 2010,MNRAS, 404, 1415
Jones, T. J., Bryja, C. O., Gehrz, R. D., et al. 1990,ApJS, 74, 785
Jones, O. C., Meixner, M., Sargent, B. A., et al. 2015,ApJ, 811, 145
Karakas, A. I., Lattanzio, J. C., & Pols, O. R. 2002,PASA, 19, 515
Kerschbaum, F., & Olofsson, H. 1999,A&AS, 138, 299
Kerschbaum, F., Groenewegen, M. A. T., & Lazaro, C. 2006,A&A, 460, 539
Kraemer, K. E., Sloan, G. C., Wood, P. R., Price, S. D., & Egan, M. P. 2005,ApJ, 631, L147
Lagadec, E., Zijlstra, A. A., Mauron, N., et al. 2010,MNRAS, 403, 1331
Le Bertre, T. 1992,A&AS, 94, 377
Lindegren, L., Lammers, U., Bastian, U., et al. 2016,A&A, 595, A4
Mainzer, A., Bauer, J., Grav, T., et al. 2011,ApJ, 731, 53
Mamon, G. A., Glassgold, A. E., & Huggins, P. J. 1988,ApJ, 328, 797
Marigo, P., & Aringer, B. 2009,A&A, 508, 1539
Marigo, P., & Girardi, L. 2007,A&A, 469, 239
Marigo, P., Bressan, A., & Chiosi, C. 1998,A&A, 331, 564
Marigo, P., Bressan, A., Nanni, A., Girardi, L., & Pumo, M. L. 2013,MNRAS, 434, 488
Marshall, J. R., van Loon, J. Th., Matsuura, M., et al. 2004,MNRAS, 355, 1348
Matsuura, M., Sargent, B., Swinyard, B., et al. 2016,MNRAS, 462, 2995
McDonald, I., Zijlstra, A. A., Lagadec, E., et al. 2015,MNRAS, 453, 4324
Meixner, M., Panuzzo, P., Roman-Duval, J., et al. 2013,AJ, 146, 62
Olofsson, H. 2008,Ap&SS, 313, 201
Olofsson, H., González Delgado, D., Kerschbaum, F., & Schöier, F. L. 2002,
A&A, 391, 1053
Olsen, K. A. G., Zaritsky, D., Blum, R. D., Boyer, M. L., & Gordon, K. D. 2011,
ApJ, 737, 29
Paradis, D., Reach, W. T., Bernard, J.-Ph., et al. 2009,AJ, 138, 196
Ramstedt, S., & Olofsson, H. 2014,A&A, 566, A145
Ramstedt, S., Schöier, F. L., Olofsson, H., & Lundgren, A. A. 2008,A&A, 487, 645
Riebel, D., Boyer, M. L., Srinivasan, S., et al. 2015,ApJ, 807, 1
Rosenfield, P., Marigo, P., Girardi, L., et al. 2014,ApJ, 790, 22
Rosenfield, P., Marigo, P., Girardi, L., et al. 2016,ApJ, 822, 73
Schöier, F. L., & Olofsson, H. 2001,A&A, 368, 969
Sloan, G. C., Kraemer, K. E., McDonald, I., et al. 2016,ApJ, 826, 44
Speck, A. K., Corman, A. B., Wakeman K., et al. 2009,ApJ, 691, 1202
van der Marel, R. P., Alves, D. R., Hardy, E., & Suntzeff, N. B. 2002,AJ, 124, 2639
van Loon, J. Th., Zijlstra, A. A., & Groenewegen, M. A. T. 1999,A&A, 346, 805
van Loon, J. Th., Zijlstra, A. A., Bujarrabal, V., & Nyman, L.-Å. 2001,A&A, 368, 950
Vassiliadis, E., & Wood, P. R. 1993,ApJ, 413, 641
Ventura, P., Karakas, A. I., Dell’Agli, F., et al. 2016,MNRAS, 457, 1456
Volk, K., Kwok, S., & Langill, P. P. 1992,ApJ, 391, 285
Wachter, A., Winters, J. M., Schröder, K.-P., & Sedlmayr, E. 2008,A&A, 486, 497
Whitelock, P. A., Feast, M. W., Marang, F., & Groenewegen, M. A. T. 2006,
MNRAS, 369, 751
Wood, P. R. 1979,ApJ, 227, 220
Wood, P. R. 1990, in From Miras to Planetary Nebulae: Which Path for Stellar Evolution?, eds. M. O. Mennessier, & A. Omont (Gif-sur-Yvette: Éditions Frontières), 67
Wood, P. R., Whiteoak, J. B., Hughes, S. M. G., et al. 1992,ApJ, 397, 552
Wright, E. L., Eisenhardt, P. R. M., Mainzer, A. K., et al. 2010,AJ, 140, 1868
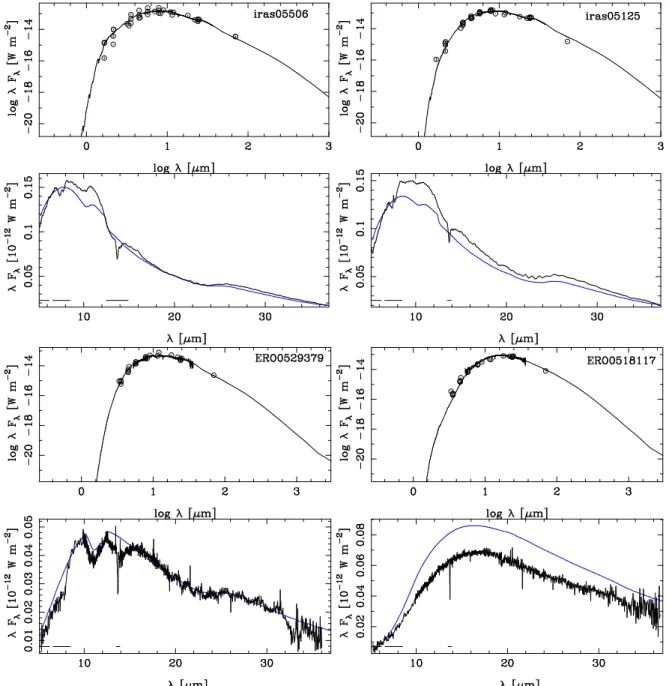
Appendix A: DUSTY fits to the LMC C stars
FigureA.1shows the fits to the SED and IRS spectra of the four C stars when running DUSTY in “density mode=3” mode. The top panel shows the photometry and IRS spectrum in a log– log plot together with the model. The bottom panel shows the IRS spectrum and the model (the blue line). The model is scaled to the observation based on the average flux in the 6.4−6.6µm
region. The small vertical lines near the bottom of the plot indi-cate wavelength regions excluded from the fitting.
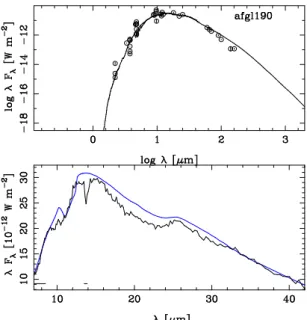
Appendix B: DUSTY fits to the Galactic extreme C stars
FigureB.1shows the fits to the SED and IRAS/LRS or ISO/SWS spectra of the seven Galactic extreme C stars when running DUSTY in “density type=3” mode.