STRATEGIES TO IMPROVE ELECTROCHEMICAL DETECTION OF NITRIC OXIDE IN BIOLOGICAL ENVIRONMENTS
Micah Daniel Brown
A dissertation submitted to the faculty at the University of North Carolina at Chapel Hill in partial fulfillment of the requirements for the degree of Doctor of Philosophy in the
Department of Chemistry (Analytical Chemistry).
Chapel Hill 2018
Approved by:
ABSTRACT
Micah Daniel Brown: Strategies to Improve Electrochemical Detection of Nitric Oxide in Biological Environments
(Under the direction of Mark H. Schoenfisch)
Nitric oxide (NO) is a gaseous molecule of vast biological significance whose activity is likely to be concentration-dependent. As our understanding of this molecule becomes more nuanced and precise, so too must detection strategies evolve to detect NO with greater precision and accuracy. Spectroscopic techniques are able to measure NO with high specificity, but the only technique unhindered by complex instrumentation and the requirement for additional reagents, and able to measure NO directly in situ, is electrochemistry. However, bare electrodes are unable measure NO with sufficient selectivity and sensitivity, particularly in biological environments, necessitating the use of transducer surface modifiers to improve performance.
nickel, and zinc) previously determined to have the highest electrocatalytic activity towards NO oxidation were evaluated for their selectivity characteristics. The ability to specifically coordinate with NO at the metal center (as opposed to weak physisorption on the aromatic periphery) proved an adequate predictor of selectivity findings.
Based on these evaluations of different modifiers, a solid-state electrochemical NO sensor was designed for long-term use in proteinaceous media. With extensive characterizations of sensocompatibility, the final NO sensor was capable of high sensitivity and selectivity retention with continuous operation in culture media. The sensor was then used to successfully interrogate the temporal (> 24 h) and spatial concentration profiles of macrophage NO release under neutral and pro-inflammatory stimulated conditions. Lastly, hydrogen sulfide (H2S) is another gasotransmitter
TABLE OF CONTENTS
LIST OF TABLES ... x
LIST OF FIGURES ... xi
LIST OF ABBREVIATIONS AND SYMBOLS ... xiv
CHAPTER 1: A CRITICAL OVERVIEW OF RECENT ADVANCES IN ELECTROCHEMICAL NITRIC OXIDE DETECTION ... 1
1.1 Introduction ... 1
1.2 Improvements to selectivity ... 3
1.2.1 Chemical modification ... 6
1.2.2 Biosensors and biomolecular catalysts ... 14
1.2.3 Dual and multi-analyte detection ... 20
1.3 Improvements to sensitivity ... 27
1.3.1 Electrocatalysts ... 28
1.3.2 Ultramicroelectrode arrays ... 32
1.4 Application to measurement in biological systems ... 33
1.4.1 Sensocompatibility ... 33
1.4.2 Biocompatibility ... 38
1.5 Conclusions and research aims ... 42
REFERENCES ... 46
CHAPTER 2: NITRIC OXIDE PERMSELECTIVITY IN ELECTROPOLYMERIZED FILMS FOR SENSING APPLICATIONS ... 58
2.1 Introduction ... 58
2.2 Experimental ... 60
2.2.2 Preparation of the working electrode ... 61
2.2.3 Electrodeposition of polymer films ... 62
2.2.4 Steady-state amperometric measurements ... 62
2.2.5 Sensor performance in simulated wound fluid ... 63
2.2.6 Contact angle measurements ... 63
2.2.7 Statistical analysis ... 64
2.3 Results and Discussion ... 64
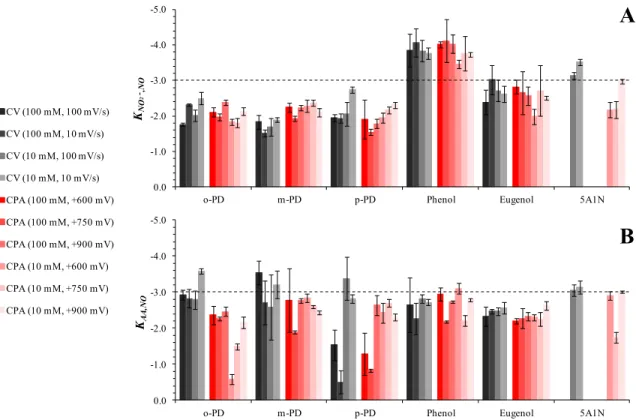
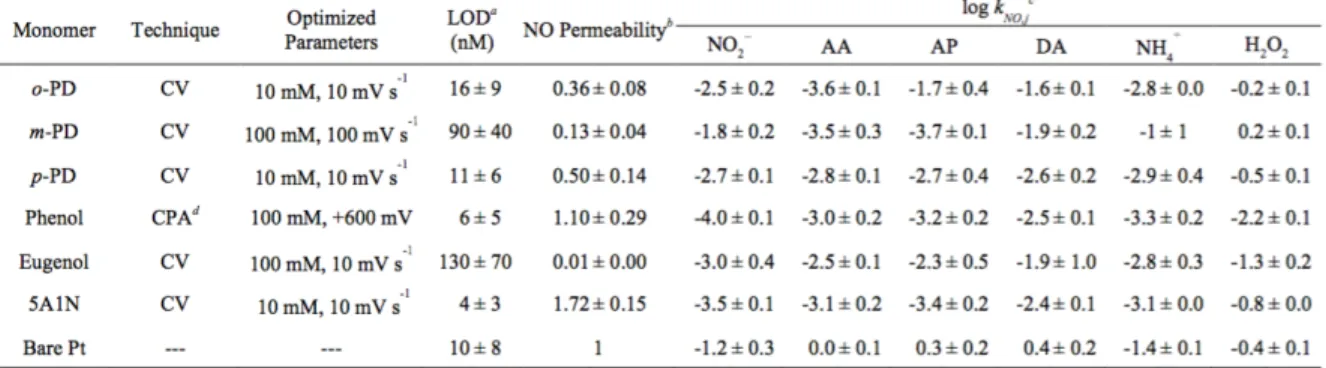
2.3.1 Cyclic voltammetry of monomers ... 65
2.3.2 Electropolymerization of monomers via cyclic voltammetry ... 67
2.3.3 Electropolymerization of monomers via CPA ... 69
2.3.4 Analytical performance of film-modified electrodes ... 72
2.3.5 Performance in simulated wound fluid ... 77
2.4 Conclusions ... 81
REFERENCES ... 82
CHAPTER 3: PROFILING SPATIAL AND TEMPORAL RELEASE OF NITRIC OXIDE FROM IMMUNOSTIMULATED MACROPHAGES ... 87
3.1 Introduction ... 87
3.2 Experimental ... 91
3.2.1 Materials, reagents, and apparatus ... 91
3.2.2 Preparation of Pt/poly(5A1N)/XG sensors ... 92
3.2.3 Steady-state amperometric measurements ... 93
3.2.4 Continuous NO measurements from RAW 264.7 macrophages ... 94
3.2.5 SECM measurements of NO from RAW 264.7 macrophages ... 95
3.2.6 Statistical analysis ... 96
3.3 Results and Discussion ... 96
3.3.1 Sensor fabrication ... 96
3.3.4 Measurements of NO from RAW 264.7 macrophages ... 102
3.4 Conclusions ... 110
REFERENCES ... 111
CHAPTER 4: CATALYTIC SELECTIVITY OF METALLOPHTHALOCYANINES FOR ELECTROCHEMICAL NITRIC OXIDE SENSING ... 115
4.1 Introduction ... 115
4.2 Experimental ... 119
4.2.1 Materials, reagents, and apparatus ... 119
4.2.2 Preparation of catalyst-modified glassy carbon electrodes ... 120
4.2.3 Electrochemical measurements via differential pulse voltammetry ... 121
4.2.4 Electrochemical measurements via constant potential amperometry ... 121
4.2.5 Calculations and statistical analysis ... 122
4.3 Results and Discussion ... 123
4.3.1 Differential pulse voltammetry ... 123
4.3.2 NO selectivity under DPV ... 126
4.3.3 Constant potential amperometry ... 131
4.4 Conclusions ... 134
REFERENCES ... 136
CHAPTER 5: A DIRECT AND SELECTIVE ELECTROCHEMICAL HYDROGEN SULFIDE SENSOR ... 140
5.1 Introduction ... 140
5.2 Experimental ... 143
5.2.1 Materials, reagents, and apparatus ... 143
5.2.2 Preparation of electropolymerized film-modified electrodes ... 144
5.2.3 Voltammetric measurements ... 145
5.2.4 Constant potential amperometric measurements ... 145
5.3 Results and Discussion ... 148
5.3.1 Voltammetry of H2S and interferents ... 148
5.3.2 Surface conditioning for continuous electrochemical H2S measurement ... 151
5.3.3 Analytical performance of film-modified electrodes ... 155
5.3.4 Performance in simulated wound fluid ... 162
5.4 Conclusions ... 166
REFERENCES ... 168
CHAPTER 6: SUMMARY AND FUTURE DIRECTIONS ... 173
6.1 Summary of research ... 173
6.2 Future directions ... 178
6.2.1 Dual-detection of NO and H2S ... 178
6.2.2 Measurement of NO from NO-releasing therapeutics ... 179
6.2.3 Integration of planar NO sensors into culture wells ... 180
6.2.4 Translation to a microfluidic device for cell culture ... 182
6.3 Conclusions ... 184
LIST OF TABLES
Table 1.1 Electroactive biological interferents.a ... 5
Table 1.2 Electrochemical NO sensors with selectivity-enhancing modifiers. ... 13
Table 1.3 Recent advances in electrochemical NO biosensor design. ... 19
Table 1.4 Recent advances in multi-analyte electrochemical NO sensor design. ... 26
Table 1.5 Electrocatalyst-modified electrochemical NO sensors. ... 31
Table 1.6 Sensocompatibility characterization of electrochemical NO sensors. ... 37
Table 2.1 Optimal electropolymerization deposition techniques observed in six self-terminating films and relevant analytical merits for selective nitric oxide detection. ... 75
Table 3.1 Analytical performance metrics of bare and modified Pt electrodes with extended use. ... 103
Table 4.1 Interferents to electrochemical detection of nitric oxide. ... 118
Table 4.2 Summary of nitric oxide sensitivity amplification and selectivity performance of MPc-modified and bare GC electrodes measured by differential pulse voltammetry. ... 129
Table 4.3 Summary of nitric oxide sensitivity amplification and selectivity of MPc-modified and bare GC electrodes measured under constant potential amperometry with different applied potentials. ... 133
Table 5.1 Anodic peak potentials of electroactive, biological interferents. ... 150
Table 5.2 Analytical merits of electropolymerized film-modified GCEs for hydrogen sulfide detection. ... 158
Table 5.3 Anodic peak potentials of monomers used in film electrodeposition. ... 158
LIST OF FIGURES
Figure 1.1 Representative Shibuki- and solid-type electrochemical NO sensor
designs . ... 8 Figure 2.1 Cyclic voltammograms collected at 2 mm (dia.) Pt disk electrodes in
10 mM monomer solutions of o-PD, m-PD, p-PD, phenol, eugenol, and
5A1N. ... 66 Figure 2.2 Cyclic voltammograms collected during the electrodeposition of 10
mM phenol in 0.01 M PBS using a 2 mm (dia) Pt disc electrode, with cycle
numbers provided. ... 70 Figure 2.3 The initial cyclic voltammogram cycle collected during the
electropolymerization of phenol from 10 and 100 mM monomer solutions in
0.01 M PBS (pH 7.4) as a function of scan rate. ... 70 Figure 2.4 Amperograms of the initial 10 s of CPA electropolymerizations of
phenol in 0.01 M PBS at +0.6, +0.75, and +0.9 V in 10 and 100 mM
monomer solutions. ... 71 Figure 2.5 Selectivity coefficients for nitric oxide against interferents nitrite and
L-ascorbate for electrodes modified by electropolymerized films of different
compositions and different deposition procedures. ... 74 Figure 2.6 Differential pulse voltammograms of nitric oxide collected on bare
Pt, poly-phenol-, and poly-5A1N-modified electrode (2 mm dia.) surfaces. ... 75 Figure 2.7 Retention of NO sensitivity for polymer-modified Pt electrodes (2
mm dia.) in SWF relative to PBS. Detection limit (S/N = 3) of electrodes in PBS, SWF, and after 1 h of SWF immersion. Static contact angle
measurements on polymer-modified planar Pt electrodes. ... 80 Figure 3.1 Schematic depiction of the Pt/poly(5A1N)/XG bilaminar sensor. ... 98 Figure 3.2 Example staircase amperogram collected on a Pt/poly(5A1N)/XG
electrode (2.0 mm dia.) in 10 mM PBS (pH 7.4) with 4 inj. of 0.25 µM, 3 inj. of 0.50 µM, and 3 inj. of 1.0 µM NO under CPA (applied potential: +0.8 V). Selectivity coefficients of bare and modified Pt electrodes against common
biological interferents. ... 99 Figure 3.3 Retention of NO sensitivity of bare and modified Pt electrodes (2
mm dia.) in 10% FBS-supplemented DMEM relative to calibrations carried
out in deoxygenated 10 mM PBS. ... 104 Figure 3.4 Electrochemical setup for the measurement of NO from cultured
(WE), Ag|AgCl reference (RE), and Pt counter (CE) electrodes. Setup inside
an incubator with lead attachments to an external potentiostat. ... 104
Figure 3.5 The NO-release profiles of stimulated and unstimulated RAW 264.7 macrophages measured using Pt/p(5A1N)/XG sensors (2.0 mm dia.) inside an incubator. ... 108
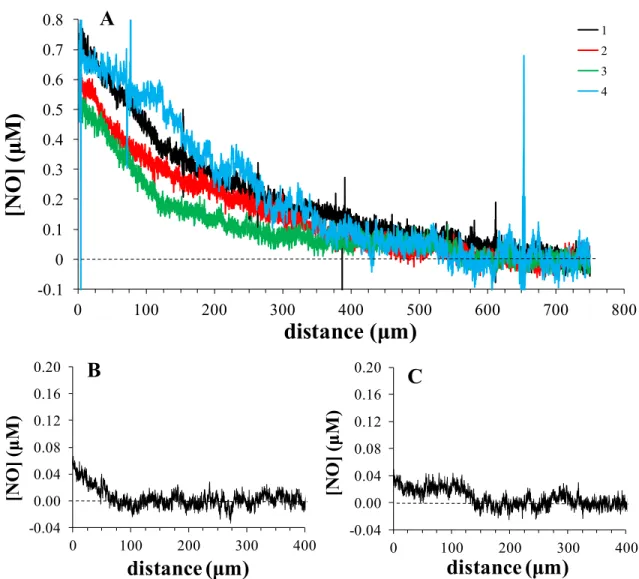
Figure 3.6 The NO diffusion profiles of a confluent sheet of macrophages 8 h after stimulation with 20 ng mL-1 LPS and 10 ng mL-1 IFN-γ as measured by a Pt/poly(5A1N)/XG microelectrode approaching at a rate of 1 µm s−1 using a SECM (4 biological repetitions shown). ... 109
Figure 4.1 Three-step electrochemical oxidation of nitric oxide. ... 118
Figure 4.2 Chemical structure of the metallophthalocyanines used in this study. ... 118
Figure 4.3 Metallophthalocyanine-mediated oxidation of nitric oxide. ... 118
Figure 4.4 High-resolution scans of the signature 2p peaks of the transition metal centers of iron-phthalocyanine (FePc), cobalt-phthalocyanine (CoPc), nickel-phthalocyanine (NiPc), and zinc-phthalocyanine (ZnPc) deposited on glassy carbon (GC). ... 124
Figure 4.5 (A) Differential pulse voltammograms of bare and MPc-modified GC electrodes in the presence of 23.75 uM NO in pH 7.4 PBS with corresponding peak potentials (n≥ 3). Overlay of DPV traces collected in the presence of different NO concentrations on a FePc-modified GC electrode. Nitric oxide sensitivity amplification of MPc-modified electrodes relative to bare GC. ... 125
Figure 4.6 Representative overlays of the DPV traces collected in the presence of various concentrations of NO in PBS on bare, FePc-modified, CoPc-modified, NiPc-CoPc-modified, and ZnPc-modified GC electrodes. ... 128
Figure 4.7 Experimental and theoretical selectivity coefficients for NO versus nitrite and L-ascorbate measured via DPV on MPc-modified and bare GC electrodes. ... 129
Figure 4.8 Staircase amperograms of bare and MPc-modified GC electrodes with successive NO injections in pH 7.4 PBS and an applied potential of +1022 mV; corresponding NO sensitivity amplifications relative to bare GC. Experimental and theoretical selectivity coefficients for NO versus nitrite. ... 133
Figure 5.3 Hydrogen sulfide sensitivity and LOD of a bare GCE (3.0 mm dia.)
as a function of the applied potential used under CPA. ... 153 Figure 5.4 Example staircase amperogram collected on a bare GCE (3.0 mm
dia.) in 10 mM PBS (pH 7.4) with successive injections of hydrogen sulfide
under CPA (applied potential: +0.3 V). ... 154 Figure 5.5 Analytical performance metrics of a GCE (3.0 mm dia.) as a
function of the number of standard hydrogen sulfide calibrations carried out, including: sensitivity retention, LODs, and background currents measured
under CPA with an applied potential of +0.3 V. ... 154 Figure 5.6 The first and second cycle of electrodepositions carried out on a 3.0
mm dia. GCE in 10 mM monomer solutions of 5A1N, phenol, eugenol, o -PD, m-PD, and p-PD in 10 mM PBS via cyclic voltammetry (0 to +1.0 V
positive sweep; scan rate: 10 mV s-1). ... 157
Figure 5.7 Hydrogen sulfide sensitivity retention on bare and electropolymerized film-modified GCEs (3.0 mm dia.) as a function of the number of standard calibrations (Ncalibration) carried out via CPA under an
applied potential of +0.3 V vs. Ag|AgCl. ... 160 Figure 5.8 H2S sensitivity retention of bare and electropolymerized
film-modified GCEs (3.0 mm dia.) in SWF relative to performance in PBS post-surface conditioning (significance with respect to the bare GCE). Detection limit (S/N = 3) of electrodes in PBS and in SWF. Response time (90% max
Δi) of electrodes in SWF. ... 164 Figure 6.1 Temporal buildup of NO and nitrite concentrations in culture
well-plates containing 1% tryptic soy broth-supplemented PBS with 5 h exposure
LIST OF ABBREVIATIONS AND SYMBOLS
% percent
° degree(s)
°C degree(s) Celsius ± margin of error < less than > greater than | redox couple
~ approximately
≈ approximately equal to
≤ less than or equal to
≥ greater than or equal to
17FTMS (heptadecafluoro-1,1,2,2,-tetrahydrodecyl)trimethoxysilane 3D 3-dimensional
3DG 3-dimensional graphene 5-HIAA 5-hydroxyindole-3-acetic acid 5-HT serotonin
5A1N 5-amino-1-naphthol AA L-ascorbic acid
AB acetate buffer; acetylene black Ach acetylcholine
Ag|AgCl silver-silver chloride reference electrode AlbSNO S-nitrosoalbumin
AP acetaminophen
APBA 3-aminophenylboronic acid APTES (3-aminopropyl)triethoxysilane
Ar argon
ATCC American Type Culture Collection
Au gold
BMIMPF6 1-butyl-3-methylimidazolium BSA bovine serum albumin
C coulomb(s)
CA cellulose acetate
ca. circa; around
Ca2+ calcium cation CAS catalase
CC chronocoulometry CE counter electrode CEC cyanoethyl cellulose CF carbon fiber
cGMP cyclic guanosine monophosphate cm centimeter(s)
CO carbon monoxide
CPA constant potential amperometry
CS chitosan
CTAB hexadecyltrimethylammonium bromide CV cyclic voltammetry
cyt c cytochrome c Cys cysteine
CysNO S-nitrosocysteine
D diffusion coefficient
d day(s)
D.C. diffusion-controlled
DA dopamine
DC direct current dec decade(s)
DFT density functional theory DHA dehydroascorbic acid
DI deionized
dia. diameter dim. dimension(s)
DMEM Dulbecco’s Modified Eagle Medium DOPAC 3,4-dihydroxyphenylacetic acid DPV differential pulse voltammetry e− electron(s)
Ea anodic peak potential Eappl applied potential
EASA electroactive surface area ECF extracellular fluid
ECM extracellular matrix
EDC N-(3-dimethylamino-propyl)-N’-ethylcarbodiimide EDTA ethylenediaminetetraacetic acid
eNOS endothelial nitric oxide synthase EPF electropolymerized film
EPR electron paramagnetic resonance spectroscopy
Eq. equation
ET electron transfer et al. et alii; and others etc. et cetera; and so forth ETH1001 calcium ionophore EtOH ethanol
eV electron-volt(s)
Fb fibrinogen
FBS fetal bovine serum
Fe iron
FeTCP iron(III)meso-tetra(4-carboxyphenyl)porphyrin
G graphene
GC glassy carbon Glu glutamic acid GO graphene oxide GSH glutathione
GSNO S-nitrosoglutathione
h hour(s)
H+ proton
H2O water
H2O2 hydrogen peroxide
H2S hydrogen sulfide
Hb oxyhemoglobin
HBSS Hank’s Balanced Salt Solution HCF hexacyanoferrate
HCl hydrochloric acid
HL60 human leukemia cell line HNG hierarchical nanoporous gold HNO2 nitrous acid
HS− hydrosulfide
HUVEC human umbilical vein endothelial cells HVA homovanillic acid
i.e. id est; in other words IFN-γ interferon-gamma
Ir iridium
IS internal solution ISE ion-selective electrode ITO indium tin oxide
j interferent
jNO NO current flux
K+ potassium cation
k0 standard heterogeneous electron transfer coefficient KCl potassium chloride
Km Michaelis-Menton constant
Kmapp apparent Michaelis-Menton constant
KOH potassium hydroxide
ks heterogeneous electron transfer rate constant
L-Arg L-arginine
L-NAME N-Nitroarginine methyl ester
LOD limit of detection
logkNO,j selectivity coefficient for NO over interferent j
LPS lipopolysaccharide
LSV linear sweep voltammetry
m meter(s)
M molar
m-PD meta-phenylenediamine
MEM Minimum Essential Media MeOH methanol
mg milligram(s) min minute(s) mM millimolar mm millimeter(s) mmol millimole(s)
mol moles(s)
MoS2-NH2 amine-modified molybdenum disulfide
MP metalloporphyrin; microperoxidase MPc metallophthalocyanine
ms millisecond(s)
MTMOS methyltrimethoxysilane mV millivolt(s)
MWCNT multiwalled carbon nanotube
MΦ macrophage
MΩ megaohm(s)
n natural number
N normal
N-G nitrogen-doped graphene
n.a. not applicable
n.q. not quantified
N2 nitrogen
nA nanoampere(s)
Na2S sodium sulfide
NaCl sodium chloride
NADPH nicotinamide adenine dinucleotide phosphate NaOH sodium hydroxide
NC nanocube
NCstr nanocluster
NED N-(1-naphthyl)ethylenediamine dihydrochloride NH3 ammonia
NH4+ ammonium cation
NH4OH ammonium hydroxide
NHS N-hydro-sulfosuccinimide sodium salt
Ni nickel
nm nanometer(s)
nM nanomolar
nNOS neuronal nitric oxide synthase NO nitric oxide
NO− nitroxyl anion NO+ nitrosonium cation NO2 nitrogen dioxide
NO2− nitrite
NOS nitric oxide synthase
NOX collective nitrogen oxide species
NP nanoparticle
NR nanorod
NYPA naphthalen-1-ylmethylphosphonic acid
Ø diameter
o-PD ortho-phenylenediamine
O2 oxygen
O2− superoxide
OH− hydroxide ONOO− peroxynitrite
p probability that the null hypothesis is true
P permeability
p-PD para-phenylenediamine pA picoampere(s)
PADA poly(acrylamide-co-diallyldimethylammonium chloride) PB phosphate buffer
PLEDGE poly(ethylene glycol) diglycidyl ether PLL poly(L-lysine)
pM picomolar
PMA para-methoxyamphetamine ppb parts per billion
ppm parts per million
Pt platinum
PTFE polytetrafluoroethylene PVD physical vapor deposition
q. quantitative
QC quaternized cellulose RE reference electrode ref. reference
ret. retention
RGD arginylglycylaspartic acid rGO reduced graphene oxide RNS reactive nitrogen species ROS reactive oxygen species
RPMI Roswell Park Memorial Institute media RSNO S-nitrosothiol species
RT room temperature
s second(s)
S-G sulfur-doped graphene S.C. surface-controlled S/N signal-to-noise ratio SA surface area
salen bis(2-hydroxy-benzaldehyde) ethylenediimine SAM self-assembled monolayer
SECM scanning electrochemical microscopy sGC soluble guanylate cyclase
Sn tin
SOD superoxide dismutase SWF simulated wound fluid SWV squarewave voltammetry
t time
T-C transparent carbon
T-CUA transparent carbon ultramicroelectrode array TAPc tetra-amine phthalocyanine
tech. technique
Ti titanium
TPDP tris(2,4,6-tribromophenoxy)dichlorophosphorane TTCA 5,2’:5’,2’’-terthiophene-3’-carboxylic acid U.S. United States
UA uric acid
UV ultraviolet
V volt(s)
v/v volume-to-volume ratio
vs. versus
W watt(s)
w/v weight-to-volume ratio WE working electrode
XG xerogel
XPS X-ray photoelectron spectroscopy
Zn zinc
α charge transfer coefficient
Δ change in
δ partial charge
µA microampere(s) µC microcoulomb(s) µg microgram(s) µL microliter(s) µm micrometer(s)
µM micromolar
µmol micromole(s)
ν scan rate
CHAPTER 1: A CRITICAL OVERVIEW OF RECENT ADVANCES IN
ELECTROCHEMICAL NITRIC OXIDE DETECTION1
1.1 Introduction
Since the discovery that nitric oxide (NO) was the endothelial derived relaxation factor, knowledge of the true breadth of NO’s activity in mammalian physiology has rapidly expanded.1 With roles to play in mediating the immune response,2,3 wound healing,4,5
vasodilation,1,6 cancer biology,7 and neurotransmission,8,9 this diatomic radical species— once only recognized as an environmental pollutant—is in fact vital to homeostasis. As our understanding of NO becomes more nuanced, it has become clear that the many functions of NO are activated in a concentration-dependent manner. In the immune system, low concentrations of NO exhibit anti-inflammatory effects by suppressing T helper cell proliferation,10 while higher concentrations elicit a robust pro-inflammatory response in the presence of infection.2,3,11,12 In cutaneous injury, high concentrations of NO can lead to prolonged oxidative stress and wound chronicity,5,13,14 while low concentrations mediate the transition to proliferative stages of healing, encouraging angiogenesis and tissue regranulation.15,16 The concentration-dependence of NO’s activity and bioavailability is also
significant in a number of different pathologies, including sepsis,17 Alzheimer’s,18 Parkinson’s,19,20 atherosclerosis,21 hypotension,22 and ischemia-reperfusion injury.23
Our understanding of the words ‘high’ and ‘low’ with respect to NO concentration is admittedly imprecise, commonly based on indirect immunohistochemical analysis of relevant enzymes (i.e., nitric oxide synthases; NOS) or the measurement of stable oxidative byproducts (i.e., NOx species, nitrite and nitrate) that accumulate in vivo.24-26 In order to
deepen our understanding of NO—its basal concentrations, the roles it plays in specific disease states, and how it can activate seemingly opposing biological processes—direct and precise measurement strategies are essential. Moreover, the ability to harness NO as a biomarker and therapeutic agent necessarily relies on accurate quantitation.
Traditionally, spectroscopy and electrochemistry are the only techniques that have enabled direct detection of NO.27 In chemiluminescent methods, reaction of NO with ozone produces excited-state nitrogen dioxide, which emits a detectable photon upon relaxation to the ground state. Adducts of NO formed with specialized dyes or spin-traps allow fluorescent and electron paramagnetic resonance (EPR) detection, respectively. In total, spectroscopic techniques offer high sensitivity (pM) and inherent selectivity, but are notably constrained by the need for complex instrumentation and additional reagents. Irreversible adduct formation in some cases also prevents monitoring NO fluctuations in real time.28 Exploiting NO’s ability to be oxidized or reduced, electrochemical sensors are better suited to in situ, biological monitoring of NO, benefitting from limited sample perturbation, freedom from exogenous reagents, superior spatial and temporal resolution, and easily miniaturized detection platforms.29-31
oxygen and superoxide.32,33 Additional scavenging/inactivation by heme-containing proteins (e.g., hemoglobin), free metals, and thiols limit the half-life of NO in physiological media to an estimated 10 seconds (and diffusion to hundreds of micrometers).34,35 Coupled with the broad range of biologically relevant NO concentrations (pM-µM), assurances must be made that an electrochemical sensor have suitable response time, sensitivity, and detection limit (LOD) for the given application.36 Additionally, there are a number of electroactive biological species that can interfere with accurate detection of NO. Electrochemical sensors must therefore be modified to meet these specific challenges of biological NO measurement.
With nearly thirty years since the development of the first electrochemical NO sensor by Shibuki et al.,37 there have been many incremental improvements to sensor construction and modification.29-31 The last decade in particular has witnessed the growth of multi-analyte detection platforms, ultramicroelectrode arrays, and microfluidic devices to improve analytical performance and accommodate cellular measurement of NO. Moreover, new transducer modifications (e.g., electrocatalysts, selectively permeable membranes, protective and biocompatible coverings) have recently been discovered or adapted to electrochemical NO sensors. Herein, we provide a critical overview of the last decade of electrochemical NO sensors, their construction, and transducer modification. Focus has been placed on rigorous, quantitative evaluations of analytical performance with respect to selectivity, sensitivity, and application to biological systems.
1.2 Improvements to selectivity
modified by heme-containing biomolecules (see Section 1.2.2).29,30,38 Oxidation of NO proceeds first through a transfer of one electron to the electrode sink (Eq. 1).
NO → NO+ + e− (Eq. 1)
NO+ + OH−→ HNO2 (Eq. 2)
HNO2 + H2O → NO3− + 2e− + 3H+ (Eq. 3)
The transient nitrosonium cation (NO+) is a relatively strong Lewis acid and in the presence of hydroxide reacts to form nitrous acid (i.e., protonated nitrite; Eq. 2).31 If the electrode is biased at a sufficiently positive potential, HNO2 can be further oxidized to nitrate (NO3−) in a
two-electron reaction (Eq. 3). Depending on the electrode material, oxidation of NO must be driven at potentials generally ranging from +0.7 to +1.0 V vs. Ag|AgCl. Such large overpotentials are also capable of oxidizing a number of electroactive biological molecules, posing a significant challenge to sensor selectivity, and therefore accuracy. Table 1 lists common biological interferents and their basal concentrations in vivo.
Table 1.1 Electroactive biological interferents.a
Interferent Charge (pH 7.4) Concentrationb Location logk
NO,jc
Acetaminophen (AP) 0 130 µMd Plasma −5.1
Ammonium/Ammonia (NH4+/NH3) +1/ 0 (pKa 9.2) 30 µM Blood −4.5
L-Ascorbic acid (AA) −1 43 µM Serum −4.6
Carbon monoxide (CO) 0 1.5 µM Kidney −3.2
Dopamine (DA) +1 2.0 nM Plasma −0.3
Hydrogen peroxide (H2O2) 0 3 µM Brain ECFe −3.5
Hydrogen sulfide/Hydrosulfide (H2S/HS−) 0 /−1 (pKa 6.6) 100 nM Blood −2.0
Nitrite (NO2−) −1 20 µM Plasma −4.3
Peroxynitrite (ONOO−) −1 30 pM Endothelium 1.5
Serotonin (5-HT) +1 1.14 µM Blood −3.1
Uric Acid (UA) −1 470 µM Serum −5.7
1.2.1 Chemical modification
By far the most common means of imparting selectivity to an electrochemical sensor is chemical modification on or near the transducer surface. These modifications primarily exploit the physical properties of NO (e.g., small size, neutral charge, lipophilicity) to permit NO selective access to the electroactive surface while obstructing interferent species. Selectivity coefficients provide a useful means of quantifying a sensor’s selectivity against a particular interferent j according to Eq. 4.39 Expressed as logarithmic ratio of interferent and
NO sensitivities (Sj and SNO, respectively), more negative coefficients are indicative of
greater selectivity.
log𝑘!",! = log !!
!!" (Eq. 4)
Given that many biological interferents are present at concentrations orders of magnitude greater than NO, large selectivity coefficients are required to achieve accurate NO measurement (Table 1). For instance, a selectivity coefficient of −4 against nitrite (NO2−) is
needed to quantify 10 nM of NO with 90% accuracy, corresponding to 10,000-fold greater sensitivity towards NO than NO2−. Clearly, quantitative measurements of selectivity against
pertinent interferents are essential to the overall analytical assessment of a NO sensor, although such measurements are surprisingly rare. Recent electrochemical NO sensors incorporating chemical modification, and for which quantitative evaluations of selectivity were undertaken, are summarized in Table 2.
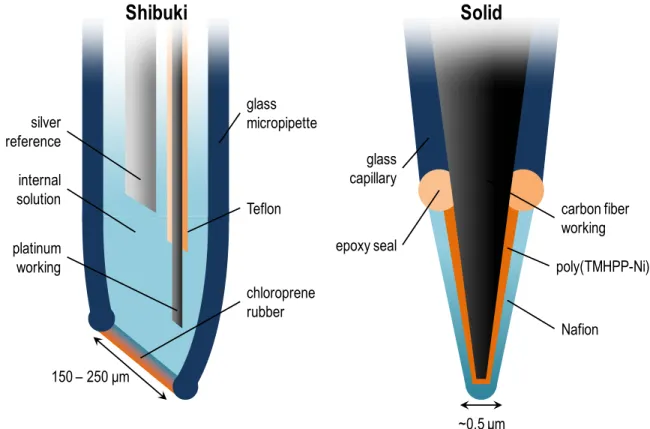
Electrochemical NO sensors can be broadly divided into two types of construction: Shibuki and solid (Figure 1.1.). The Shibuki-type sensor emerged first, based on the Clark-type O2 sensor, and comprised a micropipette containing an internal electrolyte solution, a
membrane.37 Small gaseous species such as NO and O2 were able to permeate the membrane
while larger interferents were blocked. There are only a few examples of Shibuki-type sensors recently developed,40-42 largely attributable to the difficulties associated with internal solutions (e.g., leakage, evaporation, replacement, and poor miniaturizability). Jensen et al. fabricated a NO sensor with an alkaline internal solution, Pt working electrode, and polytetrafluoroethylene (PTFE) membrane to improve selectivity against carbon monoxide (CO).43 Discrimination against CO is particularly challenging given its similar
physicochemical properties to NO. Polarization at +0.7 V vs. Ag|AgCl formed Pt oxides on the transducer surface in the alkaline environment, effectively inhibiting adsorption of CO. Unlike NO, adsorption is a key step in the electrooxidation mechanism of CO on Pt,44 and prevention of this process allowed the sensor to achieve a −2.1 selectivity coefficient for NO against CO. In this instance, chemical modification on (Pt oxide formation) and near (PTFE membrane) the transducer were used to enhance selectivity.
Figure 1.1 Representative Shibuki- and solid-type electrochemical NO sensor designs. TMHPP-Ni: tetrakis(3-methoxy-4-hydroxyphenyl)-nickel porphyrin.
glass micropipette
Teflon silver
reference
internal solution
chloroprene rubber platinum
working
Shibuki
150 – 250 µm
glass capillary
epoxy seal
carbon fiber working
poly(TMHPP-Ni)
Nafion
Solid
Since its initial use in a solid-type construction, Nafion has proven to be the most commonly applied selectivity-imparting membrane for electrochemical NO sensors.31,38,46,47
The highly fluorinated, Teflon-like backbone can be permeated by NO while rejecting bulkier interferents, and the negatively-charged sulfonate pendant groups repel critical anionic species (e.g., AA, UA, and NO2−; Table 1). Nitrite in particular, in spite of its similar
size to NO, is well rejected on the basis of charge-repulsion. Recently, Wynne et al. have meticulously evaluated the selectivity performance of Nafion films as function of different deposition procedures on Pt wires (i.e., pre-coats and annealing) and have achieved moderate selectivity against a wide range of tested interferents (Table 2).48 Moreover, they noted a phenomenon with ascorbate in which small amounts may permeate the film and be oxidized to dehydroascorbic acid (DHA) at the electrode surface. Once there, DHA remains within the membrane and helps to block further influx of AA, improving selectivity for NO.48,49 Given
the differences in nitrite selectivity reported by Wynne, Malinski, and others, it is clear that the performance of Nafion is highly depended on deposition procedure and underlying electrode substrate (Table 2). Moreover, based on a systematic evaluation of sensor sensitivity and hydrophobicity with different membrane modifications, Pontié et al. have suggested that the hydrophilic sulfonates of Nafion may force NO to concentrate within more hydrophobic domains, limiting diffusion and reducing sensitivity.50 Lastly, selectivity against neutral and positively-charged interferents remains a significant challenge (Table 1).51
sensor had excellent selectivity coefficients of −5.9 against both NO2− and AA and was able
to monitor long-term (>16 h) NO release from cultured macrophages stimulated with endotoxin. As with Nafion, the highly fluorinated backbone of TeflonAF is conducive to NO diffusion, but even without sulfonate pendant groups, TeflonAF is still capable of rejecting anionic species. This comparison suggests that size-exclusion and hydrophobic-interactions supersede charge-repulsion as the most impactful NO sieving mechanisms. Work by Shin, Lee, and Schoenfisch and colleagues has pioneered the use of fluorinated xerogel membranes for their NO-permselective traits in several recent electrochemical sensor configurations.
42,53-55 Based on standard sol-gel chemistry, hydrolysis and co-condensation of fluorinated and
backbone alkoxysilane precursors under acidic conditions yields a viscous sol solution than can be applied to micro- or planar electrodes. A rigid monolith forms after curing the sol, and excellent selectivity for NO against a range of anionic, cationic, and neutral interferents of different sizes can be achieved (Table 2).
self-terminating film growth. The growth of conducting polymers, which relay charge to the outer reaches of the film and continue to oxidize monomers, can be easily observed (and controlled) with the passage of current under CV or CPA techniques. These mechanisms of EPF formation result in both reproducible deposition and sensor performance.
Electropolymerized films were first optimized and used to impart H2O2 selectivity in
first generation glucose biosensors,56-59 but the similar size and neutral charge of NO has since prompted application to electrochemical NO sensors. Recently, a layering of poly(eugenol) and poly(phenol) was used by Quinton et al. to achieve good selectivity against anionic interferents,60 and polymers resulting from o- and m-phenylenediamine monomers have been used in several layered sensor designs.48,61,62 Because EPFs are most commonly used in conjunction with a secondary membrane or co-deposited modifier, it is difficult to isolate the permselectivity traits of a given monomer. Shim et al. undertook a comparative study of poly(m-phenylenediamine), poly(5-amino-1-naphthol), and poly(2,3-diaminonaphthalene) EPFs for their NO sieving ability and found that poly(5-amino-1-naphthol) (5A1N) performed best with a −3.7 selectivity coefficient against nitrite.63 They then demonstrated that a Pt microelectrode modified with Pt-black and poly(5A1N) had stable sensitivity and selectivity performance over 35 h of continuous polarization.
Table 1.2 Electrochemical NO sensors with selectivity-enhancing modifiers.
Electrode Designa Eapplb
(V) Media SNO
c
(pA nM-1) Dim.d LOD Selectivity e
(logkNO,j) Year Ref.
Pt/Pt-black/XG 0.85 PBS
(pH 7.4)
0.18 50 µm Ø 6 nM NO2− (−4.63) AA (−5.38) DA (−5.60) UA (−4.18) AP (−3.69) H2O2 (−3.25) H2S (−4.30)
2016 54
ITO/rGO-FeTCP/APBA 0.75 100 mM PBS (pH 7.4)
123.2 100 µm Ø 55 pM NO2− (−2.05) AA (−1.98) DA (−2.20 UA (−2.07)
2015 64
Pt/Nafion(1/2)/poly(o-PD) 0.945 40 mM PBS (pH 7.4)
1.07 127 µm Ø 8 nM NO2− (−2.17) AA (−2.24) DA (−2.32) UA (−2.32) H2O2 (−2.12) 5-HT (−1.82) DOPAC (−2.24) GSH (−2.72) 5-HIAA (−2.24) HVA (−1.91)
2014 48
Pt/Pt-black/IS(pH 11.7) /PTFE
0.7 10 mM PBS (pH 7.4)
n.r. 76 µm Ø n.r. CO (−2.1) 2013 43
Pt/APTES/XG 0.7 10 mM PBS
(pH 7.4)
1.4 100 µm
× 3 mm
840 pM NO2− (−5.3) AA (−4.2) UA (−5.0) AP (−4.0) NH3 (−3.8) NH4+ (−5.8) ONOO− (−4.0)
2013 53
GC/P-1Co(II)(salen)-MWCNT-CS
0.895 100 mM PBS (pH 7.4)
3870 3 mm Ø 2.99 nM NO2− (−2.66) AA (−4.22) GSH (−2.89)
2012 65
Au/poly(eugenol)
/poly(phenol) 0.8 100 mM PBS (pH 7.4) 0.56 50 µm Ø (× 110) 27 nM NO2 − (−3.04) AA (−3.15) DA (−1.74) H2O2 (−1.41)
2011 60
Pt/Nafion/poly(m -PD)-poly(resorcinol)/Nafion
0.74 10 mM PBS (pH 7.4)
17.1 n.r. n.r. NO2− (−2.80) AA (−4.06) NH4+ (−4.89)
2011 62
Pt/Pt-black/poly(5A1N) 0.75 PBS (pH 7.4)
0.122 25 µm Ø 5.8 nM NO2− (−3.70) CO (−1.54)
2010 63 Pt/MB/poly(o-PD)/CS n.r. 100 mM PBS
(pH 7.4)
20 125 µm Ø 1 nM NO2− (−1.62) AA (−2.01) DA (−1.57)
2010 61
ITO/Au/Au-HCF/TeflonAF 0.75 PBS
(pH 7.3) 10 1 mm Ø 1 nM NO2
− (−5.9) AA (−5.9) NH4+ (−5.4) GSH (−4.9)
2010 52
aSlashes signify separation between depositions of electrode modifiers; dashes indicate co-deposition. XG: fluorinated
xerogel; ITO: indium tin oxide; rGO: reduced graphene oxide; FeTCP: Fe(III) meso-tetra (4-carboxyphenyl) porphyrin; APBA: 3-aminophenylboronic acid; o-PD: ortho-phenylenediamine; IS: internal solution; PTFE: polytetrafluoroethylene; APTES: (3-aminopropyl)triethoxysilane; salen: bis(2-hydroxy-benzaldehyde) ethylenediimine; MWCNT: multiwalled carbon nanotube; 5A1N: 5-amino-1-naphthol; MB: Meldola blue; HCF: hexacyanoferrate.
bApplied potential vs. Ag|AgCl under constant potential amperometry. cSensitivity towards NO. n.r.: not reported.
dDimensions. Parathetical multipliers indicate the number of short-circuited electrodes of the given dimension.
eTested interferent species with reported selectivity coefficients or those calculated from Eq. 4 with provided data: AA:
L
1.2.2 Biosensors and biomolecular catalysts
The predominant means of imparting NO selectivity to an electrochemical sensor are chemical modifications of the transducer surface that take advantage of certain passive physical properties of NO, namely its small size and ability to permeate hydrophobic barriers.38 These properties are what allow NO to easily traverse lipid bilayers and act as an intercellular gasotransmitter. However, once inside the cell, nature has evolved a number of exquisite hemoprotein receptors to target NO, allowing it to exert its specific biological activity. Hemoglobin (Hb), myoglobin (Mb), cyctochrome c (cyt c), and soluble guanylate cyclase (sGC) are all known to bind NO to some extent at the Fe(II)|Fe(III) redox center of their heme prosthetic group(s).66,67 As a result, several electrochemical biosensors have incorporated these proteins to detect NO and potentially improve selectivity by harnessing NO’s unique chemistry for metal coordination (as opposed to its diffusional traits).
The electrochemical detection of biomolecule-mediated redox events has traditionally been achieved through three generations of biosensors.68 The first generation relies on the detection of electroactive co-products, -substrates, or -factors, whereas the second utilizes artificial redox mediators to shuttle electrons to the electrode. Third generation biosensors offer a more elegant means of detection, relying on direct heterogeneous electron transfer (ET) between the metal redox center and the electrode itself. Though simpler and reagentless, direct electron transfer can be hampered if redox centers are buried deep within the protein.69 For instance, the insulating effects of the peptide backbone are most pronounced for Hb, whose Fe(II)|Fe(III) redox couple exhibits poor electron transfer kinetics consequently.70 Moreover, immobilization of proteins onto the electrode surface can
the most selective protein for binding NO (particularly over O2), it is extremely unstable once
removed from its physiological environment, precluding the use of even the lightest immobilization techniques.66 Enhancing electron transfer kinetics and ensuring stability are therefore the most important preliminary considerations for NO biosensor design.
Recent strategies to immobilize different hemoproteins on electrode surfaces for the purpose of NO detection are summarized in Table 3. A notable shift in the latest formulations has been away from thiolated self-assembled monolayer (SAM) on gold schemes to those based on glassy carbon (GC), the latter offering greater flexibility in terms of covalent and electrostatic attachment and a wider potential window.71 Many of the formulations include either noble metal nanomaterials and/or different allotropes of carbon co-deposited with Hb or Mb. Combined with the choice in supporting matrix (e.g., a polymer, graphene oxide composite, or surfactant), the interfacing of highly electroactive materials such as these with hemoproteins markedly improves electron transfer kinetics, most commonly demonstrated by the appearance of well-known, quasireversible Fe(II)|Fe(III) cathodic and anodic peaks between −0.1 and −0.4 V vs. Ag|AgCl under cyclic voltammetry (CV). Voltammetry of a diffusionless system (i.e., surface-confined, as with an immobilized hemoprotein) enables calculation of the surface concentration and heterogeneous electron transfer rate constant (ks)
from Laviron’s model.72 Values of ks between 1.10 and 60.3 s-1 have recently been reported
After immobilization, most sensors incorporating a biological recognition element for NO yield a detectable signal through electroreductive means, which generally follow Eq. 5-7 when mediated through Fe(II).31,76
Fe(II) + NO → Fe(II)-NO (Eq. 5)
Fe(II)-NO + e−→ Fe(II)-NO− (Eq. 6) 2Fe(II)-NO− + 2H+→ 2Fe(II) + N2O + H2O (Eq. 7)
Reduction of the Fe(II)-NO complex occurs in the −0.7 to −0.8 V range vs. Ag|AgCl, observable under CV. The lifetime of the nitroxyl adduct (Fe(II)-NO−) is pH-dependent, as
seen in the decomposition and catalyst regeneration pathway in Eq. 7. As a result, the pH has been optimized for maximum NO sensitivity in several studies, even though such matrix alterations are not practical for most biological applications. Amperometric calibrations revealed low and, in most cases, sub-micromolar LOD values (Table 3). In some studies, the leveling-off of the calibration curve at high NO concentrations is characteristic of immobilized enzymes, and the Lineweaver-Burk equation was used to determine an apparent Michaelis-Menton constant (Kmapp).77 Values of Kmapp ranging from 0.12 to 75.39 µM have
been recently reported and offer an indication of the NO binding affinity.73,75,76 For comparison, sGC selectivity binds NO with a Km of 10 nM in what may represent an ideal
limit to natural receptor-modified NO biosensors.78
electroreductive ability with co-immobilized catalase and superoxide dismutase to improve selectivity (over H2O2 and O2−, respectively) through competitive binding.74 The resulting
biosensor had a low LOD of 4.3 nM and high purported selectivity, but measurements were performed under biologically irrelevant conditions at pH 4.0. Taking protein design a step further, Musameh et al. developed a sensor based on heme trapped in recombinant silk to loosely emulate the protein shell of sGC.80 The resulting sensor had a LOD of 2 nM under CV—the choice of technique allowing peak discrimination against O2 reduction. Ultimately,
the authors concluded that the protein scaffold of silk could be easily reengineered to further enhance selectivity against O2 and mimic sGC while still retaining stability.
Without a consistently reported set of analytical metrics, there is no strong basis of comparison across recent biosensor designs (Table 3). Selectivity is perhaps the main theoretical advantage of NO-binding proteins; however, it is often left unquantified in a meticulous fashion. Instead, what is very often displayed is an amperogram of interferent injections yielding imperceptible changes in current in comparison to injections of an arbitrary concentration of NO. Demonstrations of selectivity of this sort are too prone to misrepresentations stemming from the choice of scale, even if biologically relevant concentrations of interferents are used. And although electroreductive techniques (as with hemoprotein-based sensors) offer greater selectivity over many interferents found biologically (which are sooner oxidized than reduced), oxygen can be easily reduced below
−0.6 V vs. Ag|AgCl according to Eq. 8.38
O2 + 4H+ + 4e−→ 2 H2O (Eq. 8)
However, amperometric techniques will yield a single, cumulative current from all species reduced at the applied potential, including O2. Future evaluations of hemoprotein-based NO
sensors must include either a sensitivity ratio or selectivity coefficient for NO over O2 to
Table 1.3 Recent advances in electrochemical NO biosensor design.
Electrode Designa Tech.b Eapplc
(V) Mediad SNO
e
(nA nM-1) Ø LOD Selectivityf Year Ref.
GC/MWCNT/silk-hemin CV n.a. 100 mM AB (pH 3.0) 198 n.r. 2 nM DA, NO2
−
, AP, O2
(n.q.) 2018 80 Au/cysteamine
/(MoS2-NH2)-GO/Mb
CPA -0.3 PBS n.r. n.r. 3.6 nM NO2−, AA,
NaHCO3 (n.q.)
2017 81
GC/rGO-(AuNR-Mb) LSV n.a. 100 mM PB (pH 2.5)
0.0539 n.r. 5.5 µM NaNO3, NaF,
KCl, NH4Cl,
NaCO3, AA, DA,
glucose, UA, H2O2 (n.q.)
2016 82
GC/PEGDGE-(QC-AuNP)-Hb CPA -0.78 100 mM PBS (pH 7.0) n.r. 3 mm 12 nM AA, Cys, glucose, DA, L-Arg, NO2−
(n.q.)
2014 76
GC/(MWCNT-NYPA)-Hb/Nafion CPA -0.811 100 mM PBS (pH 7.0) ~0.0667 3 mm 15 nM H2O2 2013 71 GC/G-CTAB/CS-Hb CPA -0.655 100 mM PBS
(pH 7.0) 0.615 3 mm 6.75 nM HPO4
2−, K+, NO 3−,
AA, NO2−, H2O2 (n.q.)
2012 73
GC/AuNP/MWCNT-poly(TTCA)/MP /SOD/CAS
CPA -0.8 100 mM PBS
(pH 4.0) 1.20 3 mm 4.3 nM H2O2, O2
−, AA, L
-Arg, GA (n.q.) 2010 74
GC/poly(5A1N)/CC /cyt c
CPA -0.4 100 mM PBS (pH 7.4)
0.156 (nA nM-1
cm-2
)
n.r. 2.85 µM n.r. 2009 83
GC/CEC-Hb CPA -0.755 100 mM PBS
(pH 7.0) 0.025 n.r. 20 nM NODA, glucose, 2−, L-Arg (n.q.)
2009 75
aSlashes signify separation between depositions of electrode modifiers; dashes indicate co-deposition. Abbreviations in order of appearance: GC: glassy carbon; MWCNT: multi-walled carbon nanotube; MoS2-NH2: amine-modified molybdenum disulfide; GO: graphene oxide; Mb: myoglobin; rGO: reduced graphene oxide; AuNR: gold nanorod; PLEDGE: poly(ethylene glycol) diglycidyl ether; QC: quaternized cellulose; AuNP: gold nanoparticle; Hb: hemoglobin; NYPA: naphthalen-1-ylmethylphosphonic acid; CS: chitosan; G: graphene; CTAB: hexadecyltrimethylammonium bromide; TTCA: 5,2’:5’,2’’-terthiophene-3’-carboxylic acid; MP: microperoxidase; SOD: superoxide dismutase; CAS: catalase; 5A1N: 5-amino-1-naphthol; CC: cyanuric chloride; cyt c: cytochrome c; CEC: cyanoethyl cellulose.
bElectrochemical measurement technique. CV: cyclic voltammetry; CPA: constant potential amperometry; LSV: linear sweep voltammetry.
cApplied potential vs. Ag|AgCl. n.a.: not applicable.
dAB: acetate buffer; PB: phosphate buffer; PBS: phosphate buffered saline.
eSensitivity towards NO. Tildes signify approximations from calibration traces. n.r.: not reported.
1.2.3 Dual and multi-analyte detection
A quickly growing alternative means of imparting selectivity to an electrochemical sensor is dual- or multi-analyte detection.84-86 In place of blocking a particular electroactive species besides NO from the transducer surface, simultaneous detection allows for quantification of additional species and, if necessary, correction of the NO signal. In order to collect electrochemical information simultaneously for a given number of analytes, there must exist the same number of electrodes, each either biased or chemically modified to preferentially detect a specific analyte over the others. For biological measurements, ultramicroelectrodes (UMEs) positioned in close proximity to one another are ideal to ensure that each electrode samples the same concentration profile. Larger electrodes placed further apart may be used only if assurances are made that each electrode experiences identical chemical/biological phenomena. As an alternative to requiring multiple electrodes, for near-simultaneous detection, the same electrode may be used with different pulsed potentials (e.g., potential-step chronoamperometry), each potential selected based upon the specific redox properties of each analyte. Pulsed techniques reduce fabrication complexity, but variable capacitive currents and pulse lengths place an inherent limit on the sampling rate and ability to measure fast-releasing systems.87,88
system of two linear equations, where S1,ais the sensitivity of electrode 1 towards analyte a, Cais the concentration of analyte a, I1 is the current measured by electrode 1, etc. (Eq. 9, 10).
𝑆!,!𝐶!+𝑆!,!𝐶!= 𝐼! (Eq. 9) 𝑆!,!𝐶!+𝑆!,!𝐶! = 𝐼! (Eq. 10) Or, when expressed in matrix formalism (Eq. 11):
𝑆!,! 𝑆!,!
𝑆!,! 𝑆!,! 𝐶!
𝐶! = 𝐼!
𝐼! (Eq. 11)
Currents are measured, and all sensitivity values may be obtained through calibrations of the dual-sensor. The two unknown concentrations may be obtained easily by solving the system of equations (Eq. 12).
𝐶!
𝐶! =
𝑆!,! 𝑆!,! 𝑆!,! 𝑆!,!
!! 𝐼
!
𝐼! (Eq. 12)
The existence of the reciprocal matrix (i.e., the system of equations’ ability to be solved) depends on each electrode having unique sensitivities towards the analytes—which is to say that if electrodes 1 and 2 were identical (or simply different areas, such that their sensitivities were modified by some scalar), Eq. 9 and 10 would be redundant, and there would no longer exist a unique solution for Ca and Cb. Intuitively, it makes sense that a second electrode
𝐶!
⋮
𝐶! =
𝑆!,! … 𝑆!,!
⋮ ⋱ ⋮
𝑆!,! … 𝑆!,!
!! 𝐼!
⋮
𝐼! (Eq. 13)
With having to collect n × n calibration curves and solve a system of equations for each time-point, the computational complexity can quickly increase with each added analyte. Additionally, a key underlying assumption is that Faradaic current contributions from other electroactive species (besides those specifically targeted by the multi-sensor) are negligible. Programs to assist with data processing and additional selectivity-enhancing electrode modifiers can be used to address these problems, respectively.
The most pertinent application of multi-analyte detection within the context of electrochemical NO measurement is analysis of reactive oxygen and nitrogen species (ROS and RNS, respectively), including peroxynitrite (ONOO−), hydrogen peroxide (H2O2),
superoxide (O2−), and nitrite (NO2−). The balance of these species amongst themselves and
against antioxidants plays an essential role in mammalian physiology. Low levels of ROS/RNS species may promote cell proliferation, while higher concentrations can induce cell damage/death through oxidative stress and are implicated in a number of degenerative pathologies, such as Parkinson’s and Alzheimer’s diseases.20,86 While NO is produced from NOS, partial reduction of oxygen during aerobic respiration results in O2−, which may either
spontaneously breakdown to H2O2 or quickly react with NO to yield ONOO−.32,89,90 Nitric
oxide may also react with oxygen to yield NO2−. Given their differing lifetimes and
cross-reactivities, the ability to simultaneously monitor ROS/RNS dynamics is critical to fully understanding their individual and collective biological functions.
recently been adapted to facilitate populational measurements to reduce the number of trials required to achieve statistical significance.88 Macrophages were cultured and stimulated with
calcium ionophore in four separate chambers with Pt-black-modified microband electrodes. By applying four different potentials based off the voltammetric profiles of H2O2, ONOO−,
NO, and NO2− and applying appropriate signal deconvolution methods (as outlined above),
they were able to distinguish the temporal release profiles of each analyte upon stimulation.88,92 Integration of the signal allowed mean femtomole quantities of ROS/RNS
species per cell to be calculated for comparison to single-cell measurements. A reduction in the per cell amount of NO and ONOO− measured from populational vs. single-cell macrophages was attributed to intercellular interactions affecting the global response. However, poisoning of the Pt-black was also suggested, due to direct culturing of the cells onto the electrodes and lack of any surface protecting modifications.
Other attempts to simultaneously measure NO and other ROS/RNS species are summarized in Table 4. Bedioui and colleagues have demonstrated the utility of ultramicroelectrode (UME) arrays for measurements from cell cultures, and in a recent construction, they were able to detect NO and ONOO− from HL60 cells stimulated with p -methoxyamphetamine (PMA).93 By applying two different potentials to two different sets of
short-circuited UME arrays, they were able to eliminate crosstalk between NO and ONOO− current responses.60 The NO electrodes were additionally modified with poly(phenol) and poly(eugenol) to reduce interference from larger electroactive species capable of being oxidized at the high +0.8 V vs. Ag|AgCl overpotential.
Lee and colleagues have reported on a number of dual-sensor designs, spanning O2,
all in some way tied to the intrinsic biological activity of NO. Coordination of NO with sGC upregulates cyclic guanosine monophosphate (cGMP), which in turn activates K+ channels to
hyperpolarize the cell membrane.1 Hyperpolarization results in closure of voltage-gated Ca2+ channels, reducing intracellular levels of Ca2+ in smooth muscle cells, thereby regulating vascular tone. Dual detection of these cations with NO was achieved using specific ionophores to modify the secondary electrode surface: valinomycin for K+ and ETH1001 for Ca2+.95,96 Potentiometry was then used in the final ion-selective electrode (ISE) design. Given
the vastly different detection strategies, virtually no crosstalk occurred between cation and NO signals, greatly simplifying data processing. The dual-sensors were then applied to real-time, quantitative measurements in rat models. Also critical to NO’s activity, O2 is a required
cofactor in the biosynthesis of NO from NOS enzymes97 and is one of the main physiological scavengers of NO. Park et al. developed a miniaturized Shibuki/Clark-type sensor for simultaneous detection of NO and O2.94 The design comprised two working electrodes
(polarized at +0.75 and -0.4 V vs. Ag|AgCl for NO and O2, respectively) housed in an
internal solution separated from the sample matrix by a PTFE membrane. Although the NO-specific electrode was responsive to NO alone, the O2-specific electrode was partially
sensitive to NO, thus requiring signal deconvolution. Once the electrochemical responses were resolved from one another, they were able to monitor and correlate fluctuations of both analytes in the rat neocortex upon electrical stimulation.40
regulate many of the same processes physiologically, including vasodilation, neurotransmission, platelet aggregation, and the immune response.98 Overall, there is an
incentive both in improving selectivity and unraveling the coupled biology of NO and CO to pursue co-detection. Similar to their NO/O2 probe, Lee and colleagues developed a
Table 1.4 Recent advances in multi-analyte electrochemical NO sensor design.
Electrode Designa Analyte Eapplb
(V)
Analyte Modifiersc SNO
d
pA nM-1 Dim.e LOD Selectivityf Year Ref.
Pt/Pt-black /APTES/XG
K+ +0.85 (ISE)
valinomycin 0.106 50 µm Ø 9.55 nM NO2−, AP, AA, DA, UA, H2O2, H2S (n.q.)
2016 96
Pt/Pt-black H2O2, ONOO− , NO2−
+0.62 (+0.3, +0.45, +0.85)
n.a. n.r. 0.01 cm2 n.r. H
2O2, NO2−,
ONOO− 2016 88 Pt/Pt-black
/APTES/XG
Ca2+ +0.85 (ISE)
ETH1001 0.0408 25 µm Ø 20 nM NO2−, AA, UA, AP, DA, H2S,
H2O2 (n.q.)
2016 95
Pt/Pt-black/XG CO +0.85 (+0.20)
electroplated Au
0.180 50 µm Ø 6 nM NO2−, AP, AA, DA, UA, H2O2,
H2S
2016 54
Au/poly(eugenol) /poly(phenol)
ONOO− +0.8 (−0.1)
bare Au n.r. 20 µm Ø (×1234)
n.r. ONOO−, O
2, H2O2
2014 93 Pt/Pt-black H2O2,
ONOO− , NO2−
+0.62 (+0.3, +0.45, +0.85)
n.a. 1.3 200 µm × 197 µm
30 nM ONOO−, H
2O2, NO2−
2014 92
Pt/Pt-black/XG O2 +0.8 (−0.4)
n.a. 4.207 127 µm Ø
0.5 nM NO2−, AA, UA, AP (n.q.)
2013 42 Pt/Pt-Fe(III)NP
/(IS pH 1)/PTFE
CO +0.75
(+0.70)
electroplated Sn
0.65 76 µm Ø 5 nM CO (q.); AP, UA, NO2− AA,
DA (n.q.)
2012 41
Au/poly(eugenol) /poly(phenol)
ONOO− +0.8 (−0.1)
bare Au 0.56 50 µm Ø (×110)
27 nM H2O2, DA, NO2−, AA, ONOO−
2011 60
Pt/Pt-black /(IS pH 7.5)/PTFE
O2 +0.75 (−0.4)
n.a. 0.1781 25 µm Ø 5 nM O2, CO (q.); NO2− UA, AA,
AP, DA (n.q.)
2009 94
aSlashes signify separation between depositions of electrode modifiers; dashes indicate co-deposition. Abbreviations in order of appearance: APTES: (3-aminopropyl)triethoxysilane; Fe(II)NP: iron nanoparticle; IS: internal solution; PTFE: polytetrafluoroethylene.
bApplied potential vs. Ag|AgCl during constant potential amperometry; parentheses indicate potential or technique used for detection of other analytes.
cAdditional electrode modifiers used for separate detection of other analytes. n.a.: not applicable. dSensitivity towards NO. n.r.: not reported.
1.3 Improvements to sensitivity
The sensitivity of an electrochemical NO sensor will depend on the same variables that exert influence on selectivity, including technique, transducer modifications, and electrode material. Generally, lower potentials are more favorable for NO selectivity and improving signal-to-noise (S/N). Noble metal electrodes like platinum (Pt), platinum-iridium alloys (Pt-Ir), and gold (Au) are suitably electroactive towards NO and benefit from high electrochemical and mechanical stability.29,31 Carbon allotrope electrodes like glassy carbon
(GC), carbon fiber (CF), and graphene (G) are comparably rigid and conductive, also benefitting from a wider potential window (higher potential onset of water oxidation) and greater ease of chemical modification from a high density of oxygen-containing functional groups (e.g., carbonyl, epoxy, carboxylic acid).99 On the other hand, carbon-based electrodes are more friable and typically require higher overpotentials to oxidize NO.46 Indium tin oxide
(ITO) and transparent carbon (T-C) electrodes are amenable to cell culture, where the integration of transparent electrodes simplifies microscopic/spectroscopic interrogation of adherent cells.64,100 In certain applications where low levels of NO must be measured, and the bare electrode itself is not adequately sensitive, there are a number of techniques available to enhance sensitivity.
etching of hierarchical nanoporous gold (HNG) was developed by Liu et al. via an electrochemical alloying/dealloying method, increasing NO sensitivity over bare Au by a factor of 22.9.102 Unfortunately, if the oxidation of NO continues to occur in a diffusion-controlled (i.e., mass-transport-diffusion-controlled) manner on roughened surfaces, the capacitive current will often increase in parallel to the desirable Faradaic current.103 In order to isolate and amplify the NO signal, surface-confined (i.e., surface-controlled) interaction or adsorption of NO must occur.72 This goal is often achieved with the use of electrocatalysts,
relying on specific interaction/coordination with NO.
1.3.1 Electrocatalysts
Heterogeneous electrocatalysts lower the activation energy of an electrochemical reaction at or near (e.g., suspended in a conductive matrix) the electrode surface. Specific catalytic effects can be observed when oxidation wave features are shifted to lower potentials and peak/plateau currents are amplified (reduction-facilitating catalysts are discussed in Section 1.2.2). Table 5 lists recent constructions of electrocatalyst-modified NO sensors. Traditional metalloporphyrin (MP) and metallophthalocyanine (MPc) catalysts specifically coordinate with NO, either at the metal center or aromatic periphery.104,105 Formation of the nitrosyl adduct facilitates electron transfer, first to the macrocycle, and then to the electrode sink.106 Different metal centers alter the bond orientation, electronic structure, and oxidation potential; however, iron (Fe), cobalt (Co), and nickel (Ni) are most common due to favorable signal amplification.107 Though mediated through specific chemical interaction with NO, there has been no attempt to quantify the selectivity benefits of MP and MPc modification.30
nanostructures (Table 5). The high SA-to-volume ratio and density of reactive edge sites are favorable for NO signal amplification and enhancing electron transfer (ET) kinetics.108 As
such, the concentration of nanostructure and choice of suspension matrix (e.g., reduced graphene oxide, chitosan, electropolymerized films) must be carefully optimized to avoid agglomeration and return to bulk properties.109-111 Of note, the SA-enhancing and electrocatalytic effects of nanostructures are difficult to view in isolation without specific kinetic characterization. Too often, a simple increase in NO sensitivity or current flux (jNO) is
attributed to the electrocatalytic properties of the nanostructure without additional evidence. For instance, the wide range of jNO values reported in Table 5 is not at all expected to reliably
reflect the electrocatalytic ability of the respective modifier(s) without separation from EASA-enhancing effects. A better indicator of electrocatalytic ability is the change in anodic peak potential (ΔEa) relative to the bare electrode, but even then, the condition of the starting
electrode (e.g., presence of surface oxides, cleanliness) will influence the magnitude of ΔEa
with electrocatalyst modification. As a result, the best comparative investigations of catalytic activity have been carried out within the same study (where non-trivial experimental variability can be minimized more effectively).107 Notably, there has been no attempt to conduct such a comparison for nanostructure-modified electrochemical NO sensors, perhaps given the great variety of compositions.
A recent study by Xu et al. undertook a more rigorous characterization of the electrocatalytic mechanism of a FePc-modified, nitrogen-doped graphene electrode.112 Linear correlation between the scan rate and peak anodic current indicated a surface-controlled reaction,113,114 and variation of the peak potential with scan rate demonstrated the