ASSESSMENT OF REACTIVE BALANCE RESPONSES DURING WALKING IN ADULTS WITH CEREBRAL PALSY
Ilana Levin
A dissertation submitted to the faculty at the University of North Carolina at Chapel Hill in partial fulfillment of the requirements for the degree of Doctor of Philosophy in Human
Movement Science Curriculum in the School of Medicine.
Chapel Hill 2019
Approved by:
Deborah E. Thorpe
Carol Giuliani
Vicki S. Mercer
Michael D. Lewek
Christopher Rhea
ii
© 2019 Ilana Levin
iii ABSTRACT
Ilana Levin: Assessment of Reactive Balance Responses during Walking in Adults with Cerebral Palsy
(Under the direction of Deborah E. Thorpe)
People with cerebral palsy commonly experience balance deficits in walking. In
adulthood, many experience a decline in walking and balance, which increases their falls risk and
disability. When loss of balance occurs, effective reactive balance responses — quick body realignment and change in base of support — are essential to balance recovery. Reactive balance responses to unpredicted balance perturbations have been studied in different populations with
balance deficits. Evidence suggests that reactive balance training improves the ability to recover
balance and walking related outcomes and can lead to a reduction in falls risk. Reactive balance
responses to balance perturbation during walking have not been previously assessed in adults
with CP (ACP) and the relationships of these responses to known deficits of balance and walking
have not been established. Identifying such relationships could facilitate assessment of falls risk
and guide intervention research. The goals of this project were to (1) assess the test-retest
reliability of clinical measures of balance and walking in ACP, (2) describe the differences
between reactive balance responses to perturbations during treadmill walking of ACP and adults
without disabilities (AWD), and compare the changes in responses following repeated exposure
to balance perturbation between the two groups, and (3) assess the relationships between
iv
Results: Most clinical measures demonstrated good to excellent test-retest reliability and were
Compared with AWD, the walking of ACP was more disturbed by balance perturbations, and
they required more steps to return to regular walking. Both AWD and ACP improved reactive
balance responses following repeated exposure. The measured responses had moderate
correlations with several clinical measures of balance, walking and falls count which suggested
that adding measures of reactive balance responses during walking would provide a more
comprehensive evaluation of mobility-related balance. Further research is needed to develop
clinical assessment of reactive balance responses during walking and evaluate the ability of
v
vi
ACKNOWLEDGEMENTS
I am greatly indebted to the many people that helped me to develop ideas, explore them
in the lab, and write this dissertation. I would like to thank the members of my dissertation
committee that meticulously reviewed my research: Dr. Lewek, Dr. Giuliani, Dr. Mercer, Dr.
Rhea, Dr. Faldowski and, particularly, my advisor Dr. Thorpe. I could not have completed this
project successfully without their continued guidance and mentorship; what I have learned from
them will remain with me as I continue my academic research career.
I would also like to acknowledge the efforts of the undergraduate volunteers at the
Interdisciplinary Human Movement Laboratory and my research assistants Phillip Czuprynski
and Jerr Freeman. Their assistance with data collections and processing is greatly appreciated
and their academic curiosity is a cherished memory. I am particularly indebted to Jeff Feasel and
Alex Billingsley who applied their programming skills and spent numerous hours molding my
ideas to translate them into code.
I am grateful to my many financial supporters, without whom the pursuit of my doctoral
degree would not have been possible: the Academy of Pediatric Physical Therapy in Alexandria,
VA; the Foundation for Physical Therapy in Alexandria, VA; LSVT Global in Denver, CO; NC
TraCS Institute at the University of North Carolina at Chapel Hill; the Graduate School at the
University of North Carolina at Chapel Hill; and Dr. Deborah E. Thorpe of the Curriculum in
Human Movement Science, the Department of Allied Health Sciences, School of Medicine at the
vii
Finally, I would like to highlight the contribution of the adults with cerebral palsy who
participated in my studies. Not only did they take the time to come to the lab and take part in the
studies that formed this project, but they also shared with me their life stories, perspectives and
viii
TABLE OF CONTENTS
LIST OF TABLES ... xi
LIST OF FIGURES ... xii
LIST OF ABBREVIATIONS ... xiii
CHAPTER 1: INTRODUCTION ... 1
Background ... 1
Project Design Rationale... 3
Manuscripts ... 5
CHAPTER 2: TEST-RETEST RELIABILITY AND MINIMAL DETECTABLE CHANGE FOR MEASURES OF BALANCE AND GAIT IN ADULTS WITH CEREBRAL PALSY. (MANUSCRIPT ONE) ... 7
1. Introduction ... 7
2. Methods... 8
2.1. Participants ... 8
2.2 Outcome measures ... 9
2.3 Data analysis ... 11
3. Results ... 12
3.1 Balance outcome measures ... 12
3.2 Gait parameters ... 13
4. Discussion ... 13
4.1. Limitations ... 17
5. Conclusions ... 17
ix
CHAPTER 3: REACTIVE BALANCE RESPONSES TO REPEATED
SURFACE PERTURBATIONS DURING TREADMILL WALKING IN ADULTS WITH CEREBRAL PALSY AND ADULTS WITHOUT
DISABILITIES. (MANUSCRIPT TWO) ... 30
1. Introduction ... 30
2. Methods... 33
2.1. Participants ... 33
2.2. Protocol and data collection ... 34
2.3. Data processing ... 36
2.4. Statistical analysis ... 38
3. Results ... 39
3.1. Rail grabs. ... 39
3.2 Response Gait Variables ... 40
4. Discussion ... 41
4.1 Limitations ... 44
5. Conclusions ... 45
References ... 46
Supplement Materials. ... 60
CHAPTER 4: RELATIONSHIPS BETWEEN MEASURES OF REACTIVE BALANCE RESPONSES TO BALANCE PERTURBATIONS DURING TREADMILL WALKING AND CLINICAL MEASURES OF BALANCE AND WALKING IN ADULTS WITH CEREBRAL PALSY. (MANUSCRIPT THREE) ... 65
1. Introduction ... 65
2. Methods... 69
2.1 Participants ... 69
x
2.3 Data processing ... 73
2.4 Data analysis ... 74
3. Results ... 75
4. Discussion ... 76
4.1 Limitations ... 80
5. Conclusions and Clinical Significance ... 81
References ... 82
CHAPTER 5: SYNTHESIS ... 90
Summary of Findings ... 90
Significance of Findings ... 93
Strengths and Limitations ... 98
Future Research ... 100
APPENDIX 1: LITERATURE REVIEW ... 102
Introduction: Conceptualizing Balance... 102
Cerebral Palsy ... 104
Falls in Adults with CP ... 106
Impairments that Affect Balance in individuals with CP ... 110
Balance Control in Sitting, Standing, and Walking ... 114
Measures of Mobility-Related Balance ... 119
Interventions to Improve Gait and Balance in Individuals with CP ... 121
Evidence Related to Training Reactive Balance Responses ... 124
References ... 129
xi
LIST OF TABLES
Table 1.1: Demographic and functional characteristics of participants ... 21
Table 1.2: Test-retest reliability and minimal detectable change values of clinical balance measures ... 22
Table 1.3:Test-retest reliability and minimal detectable change values of gait variables ... 23
Table 1.4. Supplement material 1: Gait variable definitions ... 27
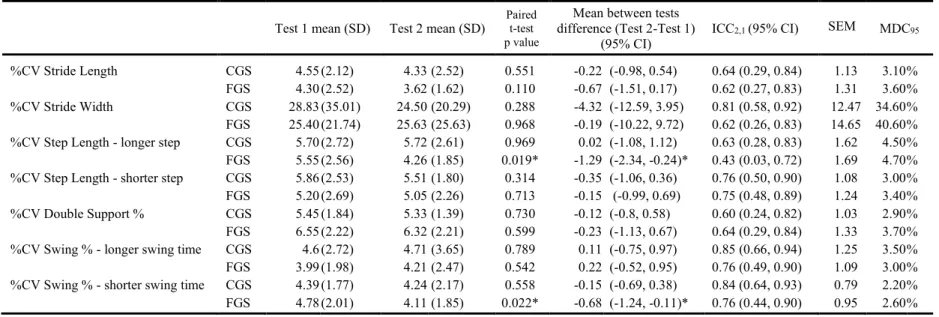
Table 1.5. Supplement material 2: Test-retest of coefficients of variation (%CV) of gait parameters ... 28
Table 2.1: Measured reactive balance responses ... 51
Table 2.2: Participant demographics... 52
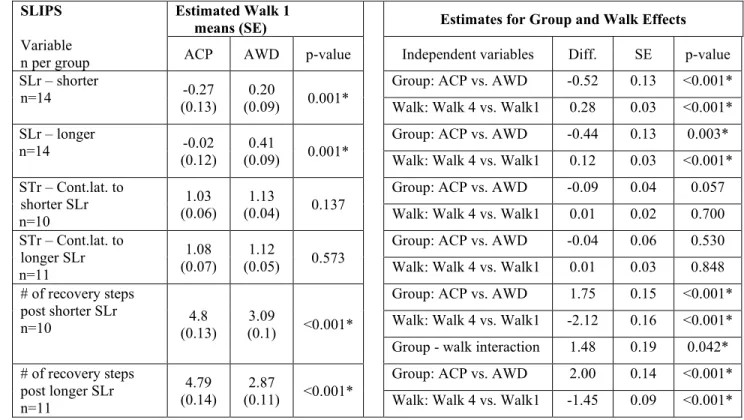
Table 2.3a: Walk1 means, and Group and Test effects on measures of reactive balance responses to slip perturbations ... 53
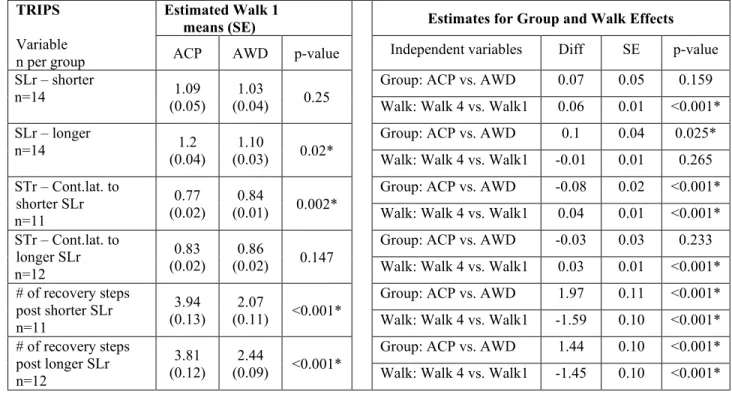
Table 2.3b: Walk 1 means, and Group and Test effects on measures of reactive balance responses to trip perturbations ... 54
Table 2.4a: Number of rail grabs of individual participants ... 56
Table 2.4b: Number of rail grabs by perturbation type ... 56
Table 2.5. Appendix 1: Slip SLrs with and without rail grabs ... 60
Table 2.6. Appendix 4: Effect size... 64
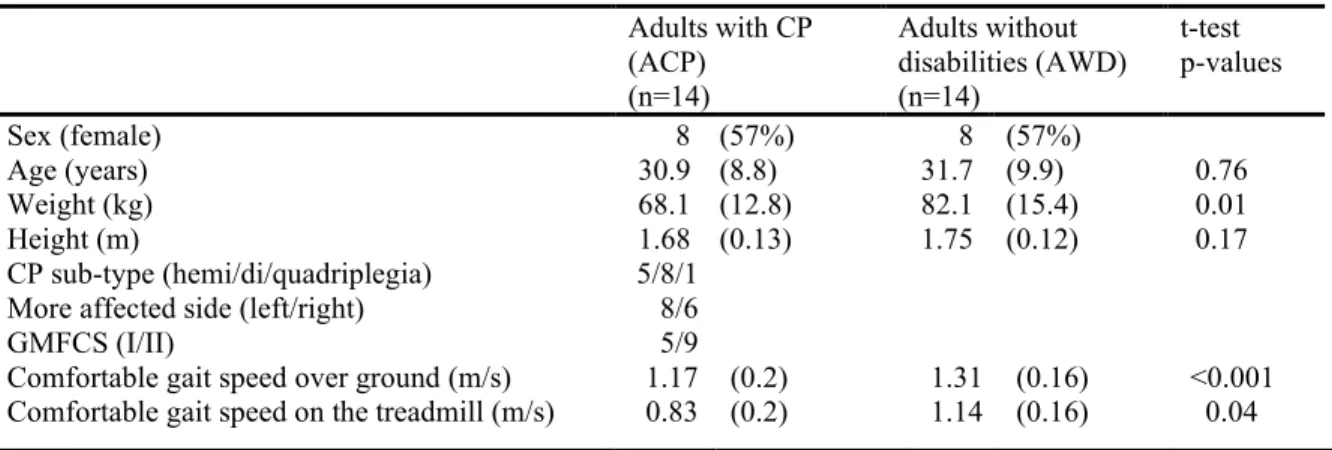
Table 3.1: Participant demographics... 86
Table 3.2: Descriptive statistics of outcome measures. ... 87
Table 3.3: Spearman's rank correlation analyses ... 88
xii
LIST OF FIGURES
Figure 1.1:Unity line score plots for balance outcome measures ... 24
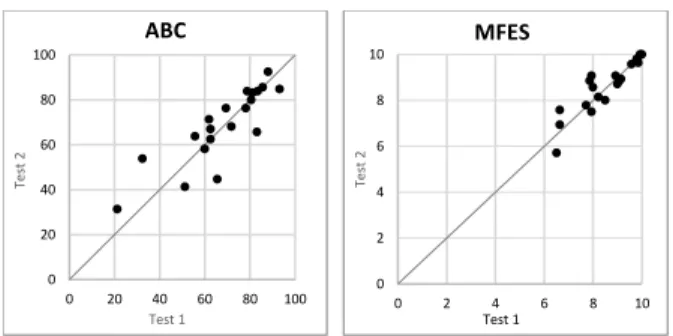
Figure 1.2:Unity line score plots for Activities-specific Balance Confidence (ABC) and Modified Falls Efficacy Scale (MFES) questionnaires ... 25
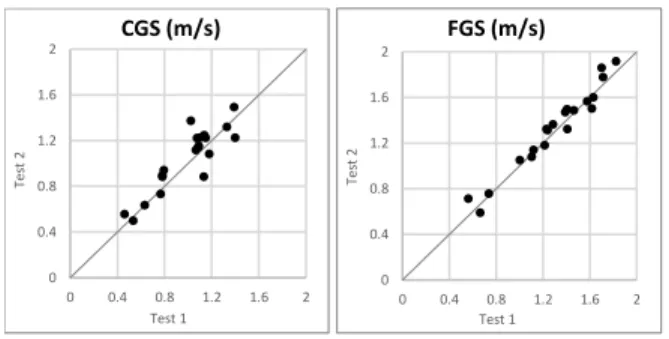
Figure 1.3:Unity line score plots for comfortable gait speed (CGS) and fast gait speed (FGS) ... 26
Figure 2.1: Perturbation onset ... 55
Figure 2.2: Mean number of rail grabs in each group ... 56
Figure 2.3: Step length responses (SLr) ... 57
Figure 2.4: Stance time responses (STr) ... 58
Figure 2.5: Number of recovery steps... 59
Figure 2.6. Supplement Material 2: Mean step responses of the weaker and the stronger leg ... 61
Figure 2.7. Supplement Material 3: ACP, means for five steps pre-perturbation ... 63
xiii
LIST OF ABBREVIATIONS
ABC Activities-specific Balance Confidence scale
ACP Adult/s with cerebral palsy
Age Age at the time of the testing
AWD Adult/s without disabilities
BESTest Balance Evaluation Systems Test
BOS Base of support
CGSOG Comfortable gait speed over ground
CGSTM Comfortable gait speed on the treadmill
COM Center of mass
CP Cerebral palsy
FSST Four Square Step Test
FGS Fast gait speed
FRT Functional Reach Test
GMFCS-E&R Gross Motor Function Classification System - Expanded & Revised
ICC Intra-class correlation coefficient
MDC Minimal detectable change
MFES Modified Fall Efficacy Scale
SL Step length
SLr Step length response
ST Stance time
STr Stance time response
xiv
TM Treadmill
1
CHAPTER 1: INTRODUCTION
Background
The brain lesion that results in a diagnosis of cerebral palsy (CP) occurs during the
perinatal or neonatal period and is non-progressive. The prevalence of CP in the US is estimated
to be 2.9-3.6 per 1000 children.1 Primary and secondary impairments commonly include
abnormal muscle tone, reduced selective motor control, impaired movement coordination,
muscle weakness, limitations in range of motion, and sensory deficits.2 The effects of the
impairments on mobility vary in nature and severity. Approximately 60% of school-age children
with CP are able to walk independently, but exhibit balance deficits.3 Balance deficits continue
to affect mobility into adulthood. Starting in early adulthood, about 60% of ambulant adults with
CP (ACP) experience a decline in walking abilities.4–8 ACP report falls and near falls that lead to
injuries and fear of falling.9 Reduced balance and walking limitations propagate a functional
downward spiral by imposing a more sedentary lifestyle, which further impairs mobility,
negatively affects health, employment, and quality of life, and results in increased disability.6,10– 14 While deterioration in balance is the most frequent self-reported change associated with the
decline in walking in ACP,15 balance research in cerebral palsy is not sufficient to guide
evidence-based interventions to improve walking related balance in this population.16–18
Common exercise programs to reduce falls risk and to improve mobility-related balance
in older adults and other populations use planned, self-initiated movements.19 These exercises
target gross motor capacities and address some of the risk factors, but they do not address the
2
unpredictable slips or trips.20 The ability to respond effectively to unanticipated loss of balance
during walking is essential to navigate real world environment without falls and injuries.21–23
A relatively new line of research in older adults, adults post stroke, and other populations
with balance deficits focuses on reactive balance responses to unpredictable balance
perturbations during walking. New technologies, which provide standardized unpredicted slip
and trip balance perturbations during walking, are used to characterize reactive balance
responses and evaluate changes with repeated exposure.21,24–26 There is evidence to suggest that
repeated exposure to balance perturbations may improve the efficiency of reactive balance
responses and reduce falls risk.27–31
There is little evidence related to the reactive balance responses of ACP, but there is
some evidence in children with CP.32,33 Compared with children without disabilities, children
with CP who were exposed to unpredictable balance perturbation in standing, presented less
efficient temporal and spatial organization of recovery patterns, which resulted in more falls.
Children with CP also showed less improvement in their reactive balance skills with age.32 These
deficits are carried over into adulthood, with ACP reporting losing their balance in various
circumstances in daily life, mainly during ambulation (walking and turning).9 Falls and losses of
balance mostly involve placing the foot in a way that creates an insufficient base of support,
failing to clear the foot sufficiently off the ground, or encountering obstacles that cause
destabilization. Such circumstances usually require quick adjustments of the step during
walking, which ACP are often unable to complete successfully.9
Preliminary pilot data provided some support for the hypothesis that reactive balance
responses following balance perturbation during walking in ACP differ from those of adults
3
balance perturbations walking on a treadmill (TM). The perturbations were produced by an
anterior or posterior acceleration of the belt under a single leg in an early stance phase.
Compared with AWD, ACP grabbed the rail more often to recover their balance following
balance perturbations. When experiencing backward sudden displacements of the center of mass
(COM) during walking, most ACP commonly stepped back - placing their foot behind that of the
perturbed leg, while most AWD only reduced the length of the step forward. ACP also stayed
longer on the perturbed leg (usually in double stance) before shifting their weight to the lead leg.
Finally, ACP demonstrated more recovery steps before returning to a regular steady state
walking pattern.
Like older AWD, ACP may improve reactive balance responses following perturbation
training. Characteristics of reactive balance responses during walking and the ability to modify
them have not been previously studied in ACP. The purpose of this project was to address the
gap in knowledge and to expand the foundations for the development of evidence-based
interventions to improve walking related balance in this population and reduce falls risk.
Project Design Rationale
The first project of this dissertation was to describe the functional status of a sample of
ACP using measures of balance, balance confidence, and spatiotemporal gait parameters, and to
assess the test-retest reliability of these measures. These measures had been previously used in
studies of ACP, but their reliability had yet to be established. To evaluate test-retest reliability,
the outcome measures were administered twice, within 10 days on average, estimates of
test-retest reliability and minimal detectable change (MDC) values were calculated, and the spread of
4
The second project was to characterize reactive balance responses to two types of
standardized balance perturbations applied randomly during TM walking and to evaluate
whether these responses differed between ACP and AWD. The number of rail grabs, the length
of the step taken following the perturbation relative to a regular-gait step length, the time on the
perturbed leg relative to regular-gait stance time, and the number of recovery steps were chosen
to characterize responses. The differences in responses between the groups were evaluated at
baseline (first exposure) and following repeated exposure. It was hypothesized that a reduction
in the extent of the disturbance to regular gait pattern caused by the perturbations would be
observed following repeated exposure to balance perturbations. Fewer deviations from the
regular gait pattern were hypothesized to be the result of improved reactive balance responses
and the ability to apply error-based learning to improve reactive balance responses.34 This would
support further studies addressing whether ACP can achieve permanent positive changes in
reactive balance responses to loss of balance during walking.
The last project was to evaluate the relationships between measures of reactive balance
responses and clinical measures of balance and walking in ACP. These relationships were
evaluated to assess whether measures of reactive balance responses may contribute to a more
comprehensive evaluation of balance and walking in ACP that would identify those at risk for
balance related functional deterioration.
We evaluated the responses to balance perturbations applied in the sagittal plane during
walking using short acceleration or deceleration of one of the belts of a split-belt TM. The
perturbations caused the center of mass (COM) to shift out of its regular progression relative to
the base of support (BOS) during walking. A slip (a perturbation causing the COM to move
5
(a perturbation causing the COM to move anteriorly to the BOS) was produced by accelerating
the belt under the single stance leg.35,36 Both the left and right legs were perturbed in a pre-set,
randomized order. The terms ‘slip’ and ‘trip’ in this project are used similarly to the way they have been used in other studies of reactive balance during standing and walking.37,38
The following were considered in designing the perturbation protocol: (1) Forward and
backward sudden displacements of COM, secondary to balance perturbations, are common
events during walking in ACP,9 (2) Increasing the unpredictability of the perturbation by
applying two opposing types of balance perturbations to both sides was expected to reduce
direction specific and side specific predictive preparations,38 (3) Regardless of the topographical
diagnosis of CP, most ACP present lower extremity motor control asymmetry to varying
degrees, and may respond differently on each side,39 therefore, responses to perturbations of both
sides were evaluated.
Manuscripts
Manuscript One: Test-Retest Reliability and Minimal Detectable Change for Measures of Balance and Gait in Adults with Cerebral Palsy.
Aim:
To establish estimates of test-retest reliability and minimal detectable change (MDC) values on a sample of ambulant ACP for (a) The Balance Evaluation Systems Test
(BESTest) and the Four Square Step Test (FSST) as measures of balance, (b) The
Activities-specific Balance Confidence scale (ABC) and the Modified Fall Efficacy Scale
(FES) as measures of balance confidence, and (c) spatiotemporal gait parameters at
6
Manuscript Two: Reactive Balance Responses to Repeated Surface Perturbations during Treadmill Walking in Adults with Cerebral Palsy and Adults without Disabilities.
Aims:
1. To compare the reactive balance responses to balance perturbations applied during
treadmill (TM) walking of ACP and age and gender-matched adults without disabilities
(AWD).
2. To measure the changes in reactive balance responses of ACP following exposure to
repeated balance perturbations while walking on a TM, and to compare these to changes
in reactive balance responses of AWD.
Reactive balance responses included: (a) the number of balance perturbations that resulted in a
rail grab to recover balance, (b) the length of the first step following a perturbation (relative to
step length of a regular TM gait), (c) stance time on the perturbed leg (relative to stance time of a
regular TM gait), and (d) the number of recovery steps.
Manuscript Three: Relationships between Measures of Reactive Balance Responses to Balance Perturbations during Walking and Clinical Measures of Balance and Walking in Adults with Cerebral Palsy
Aim:
To determine the relationships between reactive balance responses during walking (the
number of balance perturbations that resulted in a rail grab to recover balance, and the
step length response to slip perturbations) and clinical measures of balance, gait
7
CHAPTER 2: TEST-RETEST RELIABILITY AND MINIMAL DETECTABLE CHANGE FOR MEASURES OF BALANCE AND GAIT IN ADULTS WITH
CEREBRAL PALSY.1 (MANUSCRIPT ONE)
1. Introduction
An anoxic brain injury occurring prior to, during, or shortly after birth leads to the
diagnosis of cerebral palsy (CP), which is defined as a group of disorders of the development of
movement and posture which cause activity limitations throughout life.1 Approximately 60% of
school-age children with CP are able to walk independently, but exhibit balance deficits that
continue to affect their function into adulthood.2 Life expectancy for most adults with CP is
nearing that of the general population.3 Although not a progressive neurological disorder, more
than 50% of ambulant adults with CP experience a decline in balance and walking abilities in
their twenties or thirties.2 This decline can lead to a greater falls risk, a more sedentary lifestyle,
and increased disability.2,4,5
There is a paucity of intervention studies to improve dynamic balance and walking in
adults with CP.6,7 To design intervention protocols and interpret outcomes, we require
standardized outcome measures that demonstrate, in adults with CP, good test-retest reliability,
which confirms score consistency in the absence of intervention. We also must know the
minimal detectable change (MDC) values that inform about the magnitude of score change that
can be attributed to a true change in capacity, that is beyond random performance variations.8
Previous studies in ambulant individuals with CP used the Balance Evaluation Systems Test
8
Reach Test (FRT) and Timed Up and Go test (TUG),9,10 the Activities-specific Balance
Confidence scale (ABC), the Fall Efficacy Scale (FES),11 spatiotemporal gait parameters,10 and
the Four Square Step Test (FSST).12 However, the psychometric properties of these measures
have not been established for adults with CP. The purpose of this study was to establish
estimates of test-retest reliability and MDC values and to assess the distribution of scores over
the ranges of the scales of measures of balance, balance confidence, falls efficacy, and
spatiotemporal gait parameters in adults with CP. We hypothesized that test-retest reliability
would be high and MDC values would be clinically acceptable, and that scores would be broadly
spread along the scales of the measures.
2. Methods
2.1. Participants
Twenty participants (Table 1), completed the test-retest protocol (“Test 1”, “Test 2”)
within an average of 10 days between tests (SD=4.5, range: 6-23 days). Inclusion criteria were
age 18-55 years, diagnosis of spastic CP, classified by a physical therapist as Gross Motor
Function Classification Scale - Extended and Revised (GMFCS-E&R)13 Level I (able to walk in
all settings with some balance and coordination impairments) or Level II (walking is limited in
some settings), able to walk for 10 minutes on level ground with no more than one rest break,
and able to understand and follow simple instructions in English. Exclusion criteria included
conditions that limit the ability to exercise, like recurrent episodes of knee or hip pain in the
previous three months, uncorrected vision or hearing, vestibular disorders, uncontrolled seizures,
second or third trimester pregnancy, or a significant restriction in communication. Participants
9
Committee for the Protection of Human Subjects at the University of North Carolina at Chapel
Hill. All subjects provided informed consent prior to participation.
2.2 Outcome measures
All participants provided demographic and functional status information. All outcome
measures were repeated in the same order in both tests. Participants that required forearm
crutches or a cane for specific test items, used them in both tests. Scoring was done by a licensed
physical therapist with 20 years of clinical experience (IL). In order to estimate population
performance consistency on the selected measures between the two tests, while minimizing
scoring errors, the scores collected during the tests were verified using videotapes. In rare cases
of stopwatch failure, the participant was not asked to repeat the item, instead, videotape-based
times were used for analysis. To ensure assessment fidelity, the rater completed standardized
online training using the BESTest website prior to the study.14 Participants were assessed on the
following outcome measures in order:
1. Gait parameters: Participants completed four passes along a 20 ft. Zeno Walkway
System1 at a comfortable gait speed (CGS) and 4 passes at a fast gait speed (FGS). For
CGS, participants were instructed to “walk at your comfortable walking speed, as if going to get somewhere, but not rushing”, and for FGS, they were instructed to “walk as
fast as possible while maintaining safety”. Data were processed using ProtoKinetics Movement Analysis Software2 and the following gait parameters were extracted: average
cadence, stride length, longer and shorter step lengths, stride width, double support time,
longer and shorter percentage swing times, and coefficients of variation for step and
10
stride lengths, stride width, and gait phases percentage times (see supplementary material
for definitions).15,16
2. ABC scale: Participants completed the ABC scale independently, rating their confidence
in performing 16 activities “without losing balance or becoming unsteady” on a 0% (no
confidence) to 100% (complete confidence) 11-point scale. The responses were averaged
to produce the ABC total score.17
3. MFES: Participants completed the MFES independently, rating their confidence in
performing 14 activities “without falling” on a 0 (no confidence) to 10 (complete
confidence) 11-point scale. The responses were averaged to produce an MFES total
score.18
4. FSST: Following one to three untimed practice trials, participants were timed performing
the multidirectional stepping task twice and the fastest time was used for analysis.
Instructions were given and time was measured according to the published protocol.19
5. BESTest: Participants completed 36 items, which were organized into 6 sections
(Biomechanical Constraints, Stability Limits, Anticipatory Postural Adjustments,
Postural Responses, Sensory Orientation, and Stability in Gait). Short rests were provided
at the end of each section, and as needed. The BESTest was administered in accordance
with published procedures9 with a few modifications: (1) For all Sensory Orientation
items, participants stood within their usual base of support width and not with feet
together. Based on pilot data, testing with feet together would have resulted in many
participants scoring 0 on most items, which would have reduced the clinical usefulness of
this section. (2) Standing on the foam with eyes open and then eyes closed was done
11
did not initially follow instructions, secondary instructions were given, and trials
repeated. Each item was scored using a 4-point scale from 0 (worst performance) to 3
(best performance). Scores were summed and calculated as a percentage of the
achievable score for each section and for the total score.9 The best measured values of the
FRT and the TUG were scored (0-3) as part of the BESTest. In addition, the collected
values of distance and time were used for a separate analysis to obtain ICC estimates and
MDC values for each of the tests.
2.3 Data analysis
Sample size:An a priori power analysis20 indicated that a sample size of 19 was
sufficient to establish that a detected reliability coefficient above 0.80 (good reliability) was
significantly different from a reliability coefficient below 0.5 (cut off value for poor reliability)
with a power of 0.80 and an alpha of 0.05.21
For all outcome measures, the following values were calculated: the intraclass correlation
coefficient for test-retest absolute agreement for a single random rater (ICC2,1) and the respective
95% confidence interval, the standard error of measurement (SEM)2, and the derived MDC
95.3,8
Test-retest reliability was interpreted as “poor” if ICC was below 0.5, “moderate” if ICC2,1 was
0.5 to 0.75, “good” if ICC2,1 was 0.75 to 0.9, and excellent if ICC2,1 was above 0.90.22
Test 1 and Test 2 scores were plotted relative to a unity line and visually inspected to
assess range and proximity to the unity line. Systematic differences were identified using a
paired t-test. For all data analyses, the alpha was set at 0.05. All statistical calculations were
completed using R v.3.4.4 statistical software.
2SEM=SD×√(1−ICC)
12 3. Results
3.1 Balance outcome measures
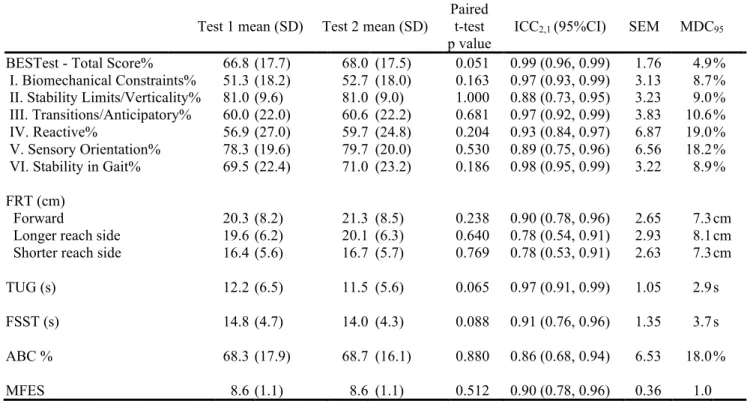
Test means, ICC2,1 and MDC95 values are presented in Table 2. Test-retest reliability
values for the BESTest scores were “good” to “excellent” (ICC2,1 values 0.88 to 0.99),
“excellent” for the forward FRT (ICC2,1 =0.90), “good” for the FRT to both sides (ICC2,1=0.78),
“excellent” for the TUG (ICC2,1 =0.97), “excellent” for the FSST (ICC2,1= 0.91), “good” for the
ABC (ICC2,1=0.86), and “excellent” for the MFES (ICC2,1=0.90).
The TUG scores (Test 1: 21s, Test 2: 15.5s) of one outlying participant reflected a
pronounced learning effect related to confidence getting up from and down to the chair and were
omitted from analysis. Two participants performed the FSST exceptionally slowly (>30s) and
were omitted from FSST analysis as outliers to prevent MDC inflation. Following the outlier
omissions, all analyzed balance scores demonstrated non-significant paired t-tests, reflecting the
absence of systematic difference between tests (Table 2).
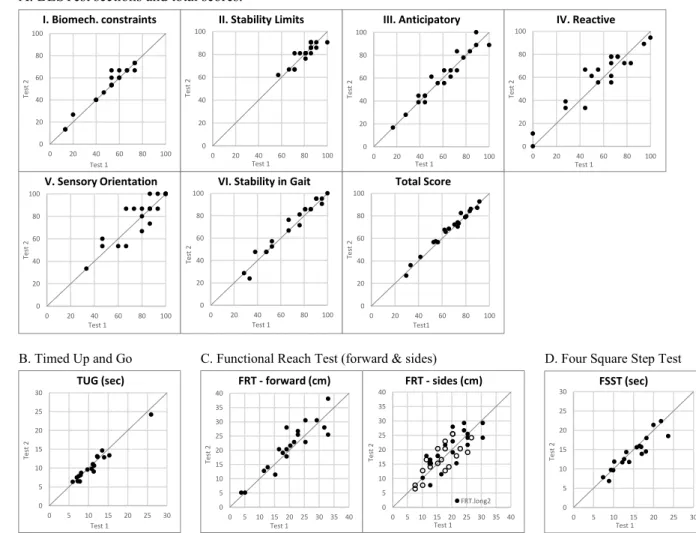
The scores on most BESTest section score plots (Fig.1a) were distributed broadly over
the ranges of the scales and were close to the unity line. In section II(Stability Limits), all
participants scored above 65%, and in section V (Sensory Orientation), 16/20 participants scored
above 80%. On the TUG (Fig.1b), and the FSST (Fig.1d), the lower performing participants
appeared to demonstrate slightly better scores on Test 2, but the differences between tests for the
whole sample were non-significant (Table 2). Measured FRT distances captured broad
performance ranges. Forward reach appeared to have a more consistent test-retest performance
than reach to the sides (Fig.1c) which was reflected in the relatively higher ICC values (Table 1).
ABC scores were distributed broadly over the range of the scale, while MFES scores were
13
3.2 Gait parameters
For each participant, an average of 36.2 (SD=9.2) steps were analyzed for CGS, and 30.5
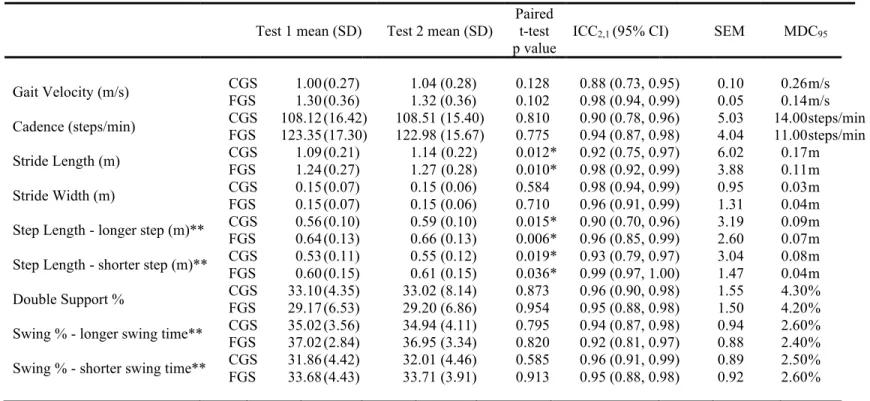
(SD=8.8) steps for FGS. Tests means, ICC2,1 and MDC95 values are presented in Table 3.
Test-retest reliability was “good” (ICC2,1=0.88) for CGS and “excellent” (ICC2,1=0.98) for FGS. At
both walking speeds, all spatiotemporal variables had “good” to “excellent” test-retest reliability. Step and stride length variables demonstrated small significant increase in values from Test 1 to
Test 2 for both speeds. All other variables had non-significant paired t-tests, reflecting the
absence of systematic difference between tests (Table 3). The coefficients of variation of the gait
variables had mostly “moderate” ICC values, which appeared to be lower at FGS (see
supplementary material for detailed results and discussion of gait variability metrics).
4. Discussion
This study provided evidence related to test-retest reliability and MDC95 values of
balance and gait outcome measures for ambulatory adults with CP. Our results suggest that all
balance measures and most spatiotemporal gaitvariables had “good” to “excellent” test-retest reliability, reflecting the tools’ ability to provide consistent test-retest measurements of performance.
Established MDC values can help identify a true change in measured performance that is
beyond random variations.8 As a derivative of the intraclass correlation and the standard
deviation of the scores, the MDC value provides some insights into the psychometrics of the
outcome measure. In this study, the MDC95 for the BESTest total score had a smaller value than
the scores of its individual sections, reflecting an overall reliable tool that is stable and has little
14
Balance and Sensory Orientation) had large MDC values, despite “excellent” and “good”
reliability, reflecting the nonsystematic test-retest variations (Fig.1a). High MDC values may
raise concerns regarding the precision of the outcome measure. For example, high MDC values
may indicate that either the assessed capacity is not stable from day to day, that the outcome
measure itself is not specific enough to measure the true capacity, or that the measured
performance is affected by other factors.24
In a population that demonstrates abroad range of scores on a given outcome measure,
the use of an MDC value may have some limitations when evaluating changes in individuals
with either very high or very low scores. On the FSST, the fastest participant scored 6.8s. For
this participant, lowering FSST time may not be a clinical goal. There is no FSST cutoff score
that indicates high falls risk in adults with CP to identify those who may benefit from lowering
FSST time by at least the MDC95 value (3.7s). Additionally, the FSST has a cognitive processing
component that may affect performance with repeated exposure. This was possibly demonstrated
by the two very low performing participants, who had large between test improvements and were
subsequently omitted from analysis. Similarly, the TUG captured a broad range of values
(Fig.1b) and had excellent test-retest reliability, but there is no cutoff score that predicts high
falls risk in adults with CP. Others have shown that the TUG is moderately associated with the
6-minute walk distance – explaining 67% of the variance in adults with CP.25 This suggests that the
TUG could be a useful measure of both balance and walking in adults with CP, but while the
TUG MDC95 value can identify true changes in measured performance, the clinical implications
of a given change need to be considered for each case.
15
consistency of the FGS (Fig. 3) may be attributed to participants’ interpretations of the
instructions. FGS instructions requested maximal effort, which may have been interpreted more
consistently compared with CGS instructions which asked participants to recall a feeling
(comfortable walking speed). Higher test-retest consistency led to a lower FGS MDC95 (0.14
m/s), compared to the CGS MDC95 (0.26m/s).
MDC values intend to reflect only random variations in performance. Step length values
at both speeds demonstrated small systematic increase in Test 2. All between - test differences
were normally distributed, and the cause of the small systematic shift was not identified. While
this violation alludes to the need to use the step length MDC values with caution, they can still
help assess changes in step length since the magnitude of the systematic differences was small
(20-30% of the MDC values). Further, these MDC values remain clinically reasonable and
similar to those of people with stroke.26
Participants demonstrated a broad range of scores on most outcome measures, which
suggests that these measures are able to capture population-specific functional range and have
the potential to reflect changes in these functional ranges (Fig.1,2,3). However, n BESTest
Stability Limits and Sensory Orientation (Fig.1a), and the MFES (Fig.2) participants
demonstrated score clustering close to the maximal score. This clustering reduces potential
responsiveness to change and may result in a ceiling effect. To increase responsiveness to change
in adults with CPwith high “Stability Limits” scores, clinicians may consider the distance scores of the FRT items, evaluating changes by using FRT MDC95 values, and test thosewith high
“Sensory Orientation” abilities with their feet together, as in the original instructions. Although
the BESTest was found to have no floor or ceiling effects, and to be sensitive to balance changes
16
validity study suggested that 25 out of the 36 items were the most appropriate to capture balance
in ambulatory patients post stroke.28 Revision of the BESTest specific to ambulant adults with
CP may be appropriate.
The high scores clustering on the MFES was likely because the MFES does not include
enough situations that are sufficiently challenging the balance of adults with CP. The Fall
Efficacy Scale International (FES-I) includes more challenging tasks and may better reflect the
circumstances in which adults with CP experience falls, such as walking on uneven or slippery
surfaces, walking around the neighborhood, and walking in crowds.29 For this study, the MFES
was chosen over FES-I, because it uses a similar scoring scale as the ABC, while the FES-I is
using a 4-point response scale. Future studies should evaluate test-retest reliability and the spread
of adults with CP scores over the FES-I scale.
ABC score plot along the unity line, suggests that test-retest score consistency may
depend on the functional level of the individual. The ABC questionnaire, which asks about
confidence completing tasks without losing balance, had a “good” overall reliability (ICC=0.86). While there was no significant difference between Test 2 and Test 1, there was a large
confidence interval (CI) for the difference (Table 2) and the score plot (Fig.2) demonstrated that
lower scores tended to be further away from the unity line compared to the higher scores. The
larger inconsistency in scores between tests, among lower functioning individuals, may reflect
either fluctuations in confidence experienced by participants, or the inability to assign the same
number consistently on an eleven-point scale. More consistent test-retest responses may be
17
4.1. Limitations
There are several factors that limit the generalizability of these findings. The sample of
convenience was not representative of the entire population of adults with CP GMFCS-E&R
Levels I and II. The study included only participants who were able to follow instructions in
English and no adults with CP who presented with significant communication or cognitive
impairment were included, though no formal screening tools were used to assess communication
and cognition.
5. Conclusions
A decline in balance and walking is experienced by many ambulant adults with CP.
Reliable outcome measures are needed to support the research and services that address this
decline. The current study established test-retest reliability and MDC values in ambulant adults
with CP for outcome measures of balance and gait that were previously validated for other
populations with balance impairments. Results show that these measures are useful for
evaluating balance and gait in most ambulant adults with CP. Further studies are needed to
improve the precision and responsiveness of some of these measures.
18
REFERENCES
1. Rosenbaum P, Paneth N, Leviton A, et al. A report: The definition and classification of cerebral palsy April 2006. Dev Med Child Neurol Suppl. 2007;109:8-14.
2. Morgan P, McGinley J. Gait function and decline in adults with cerebral palsy: A
systematic review. Disabil Rehabil. 2014;36(1):1-9. doi:10.3109/09638288.2013.775359 3. Strauss D, Ojdana K, Shavelle R, Rosenbloom L. Decline in function and life expectancy of
older persons with cerebral palsy. NeuroRehabilitation. 2004;19(1):69-78.
4. Haak P, Lenski M, Hidecker MJC, Li M, Paneth N. Cerebral palsy and aging. Dev Med Child Neurol. 2009;51 Suppl 4:16-23. doi:10.1111/j.1469-8749.2009.03428.x
5. Opheim A, Jahnsen R, Olsson E, Stanghelle JK. Walking function, pain, and fatigue in adults with cerebral palsy: A 7-year follow-up study. Dev Med Child Neurol.
2009;51(5):381-388. doi:10.1111/j.1469-8749.2008.03250.x
6. Jeglinsky I, Surakka J, Carlberg EB, Autti-Rämö I. Evidence on physiotherapeutic interventions for adults with cerebral palsy is sparse. A systematic review. Clin Rehabil. 2010;24(9):771-788. doi:10.1177/0269215510367969
7. Tosi LL, Maher N, Moore DW, Goldstein M, Aisen ML. Adults with cerebral palsy: A workshop to define the challenges of treating and preventing secondary musculoskeletal and neuromuscular complications in this rapidly growing population. Dev Med Child Neurol. 2009;51 Suppl 4:2-11. doi:10.1111/j.1469-8749.2009.03462.x
8. Haley SM, Fragala-Pinkham MA. Interpreting change scores of tests and measures used in physical therapy. Phys Ther. 2006;86(5):735-743.
9. Horak FB, Wrisley DM, Frank J. The Balance Evaluation Systems Test (BESTest) to differentiate balance deficits. Phys Ther. 2009;89(5):484-498. doi:10.2522/ptj.20080071 10. Morgan P, Murphy A, Opheim A, McGinley J. Gait characteristics, balance performance
and falls in ambulant adults with cerebral palsy: An observational study. Gait Posture. 2016;48:243-248. doi:10.1016/j.gaitpost.2016.06.015
11. Opheim A, Jahnsen R, Olsson E, Stanghelle JK. Balance in relation to walking
deterioration in adults with spastic bilateral cerebral palsy. Phys Ther. 2012;92(2):279-288. doi:10.2522/ptj.20100432
12. Leizerowitz G, Katz-Leurer M. Feasibility, stability and validity of the four square step test in typically developed children and children with brain damage. Brain Inj.
19
13. Palisano RJ, Rosenbaum P, Bartlett D, Livingston MH. Content validity of the expanded and revised Gross Motor Function Classification System. Dev Med Child Neurol.
2008;50(10):744-750. doi:10.1111/j.1469-8749.2008.03089.x
14. Horak FB. BESTest: Learn how to administer the BSETest. http://www.bestest.us/training/. Accessed March 15, 2018.
15. Thorpe DE, Dusing SC, Moore CG. Repeatability of temporospatial gait measures in children using the GAITRite electronic walkway. Arch Phys Med Rehabil.
2005;86(12):2342-2346. doi:10.1016/j.apmr.2005.07.301
16. Lewek MD, Randall EP. Reliability of spatiotemporal asymmetry during overground walking for individuals following chronic stroke. J Neurol Phys Ther. 2011;35(3):116-121. doi:10.1097/NPT.0b013e318227fe70
17. Powell LE, Myers AM. The Activities-specific Balance Confidence (ABC) Scale. J Gerontol A Biol Sci Med Sci. 1995;50A(1):M28-34.
18. Hill KD, Schwarz JA, Kalogeropoulos AJ, Gibson SJ. Fear of falling revisited. Arch Phys Med Rehabil. 1996;77(10):1025-1029.
19. Dite W, Temple VA. A clinical test of stepping and change of direction to identify multiple falling older adults. Arch Phys Med Rehabil. 2002;83(11):1566-1571.
20. Walter SD, Eliasziw M, Donner A. Sample size and optimal designs for reliability studies. Stat Med. 1998;17(1):101-110.
21. Lexell JE, Downham DY. How to assess the reliability of measurements in rehabilitation. Am J Phys Med Rehabil. 2005;84(9):719-723.
22. Koo TK, Li MY. A Guideline of Selecting and Reporting Intraclass Correlation Coefficients for Reliability Research. J Chiropr Med. 2016;15(2):155-163. doi:10.1016/j.jcm.2016.02.012
23. Development Core Team. R: A Language and Environment for Statistical Computing. Vienna, Austria.: R Foundation for Statistical Computing; 2008. http://www.R-project.org. 24. Hopkins WG. Measures of Reliability in Sports Medicine and Science. Sports Med.
2000;30(1):1-15. doi:10.2165/00007256-200030010-00001
25. Maanum G, Jahnsen R, Frøslie KF, Larsen KL, Keller A. Walking ability and predictors of performance on the 6-minute walk test in adults with spastic cerebral palsy. Dev Med Child Neurol. 2010;52(6):e126-132. doi:10.1111/j.1469-8749.2010.03614.x
20
27. Chinsongkram B, Chaikeeree N, Saengsirisuwan V, Viriyatharakij N, Horak FB,
Boonsinsukh R. Reliability and Validity of the Balance Evaluation Systems Test (BESTest) in People with Subacute Stroke. Phys Ther. June 2014. doi:10.2522/ptj.20130558
28. Miyata K, Hasegawa S, Iwamoto H, et al. Structural validity of Balance Evaluation
Systems Test assessed using factor and Rasch analyses in patients with stroke. J Phys Ther Sci. 2018;30(12):1446-1454. doi:10.1589/jpts.30.1446
21
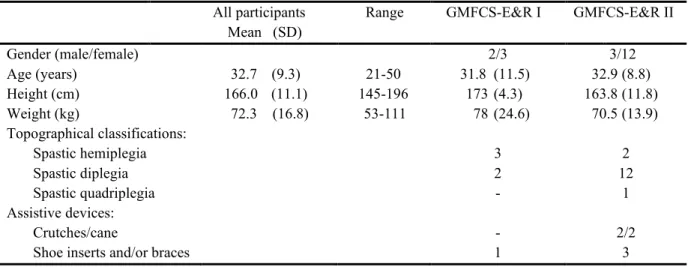
Table 1.1: Demographic and functional characteristics of participants (n=20)
All participants Range GMFCS-E&R I GMFCS-E&R II Mean (SD)
Gender (male/female) 2/3 3/12
Age (years) 32.7 (9.3) 21-50 31.8 (11.5) 32.9 (8.8)
Height (cm) 166.0 (11.1) 145-196 173 (4.3) 163.8 (11.8)
Weight (kg) 72.3 (16.8) 53-111 78 (24.6) 70.5 (13.9)
Topographical classifications: Spastic hemiplegia Spastic diplegia Spastic quadriplegia
3 2
-2 12
1 Assistive devices:
Crutches/cane
Shoe inserts and/or braces
- 1
22
Table 1.2: Test-retest reliability and minimal detectable change values of clinical balance measures
Test 1 mean (SD ( Test 2 mean (SD (
Paired t-test
p value ICC2,1 (95%CI) SEM MDC95 BESTest - Total Score%
I. Biomechanical Constraints% II. Stability Limits/Verticality% III. Transitions/Anticipatory% IV. Reactive%
V. Sensory Orientation% VI. Stability in Gait%
FRT (cm) Forward
Longer reach side Shorter reach side
TUG (s) FSST (s) ABC % MFES 66.8 51.3 81.0 60.0 56.9 78.3 69.5 20.3 19.6 16.4 12.2 14.8 68.3 8.6 (17.7) (18.2) (9.6) (22.0) (27.0) (19.6) (22.4) (8.2) (6.2) (5.6) (6.5) (4.7) (17.9) (1.1) 68.0 52.7 81.0 60.6 59.7 79.7 71.0 21.3 20.1 16.7 11.5 14.0 68.7 8.6 (17.5) (18.0) (9.0) (22.2) (24.8) (20.0) (23.2) (8.5) (6.3) (5.7) (5.6) (4.3) (16.1) (1.1) 0.051 0.163 1.000 0.681 0.204 0.530 0.186 0.238 0.640 0.769 0.065 0.088 0.880 0.512
0.99 (0.96, 0.99) 0.97 (0.93, 0.99) 0.88 (0.73, 0.95) 0.97 (0.92, 0.99) 0.93 (0.84, 0.97) 0.89 (0.75, 0.96) 0.98 (0.95, 0.99)
0.90 (0.78, 0.96) 0.78 (0.54, 0.91) 0.78 (0.53, 0.91)
0.97 (0.91, 0.99)
0.91 (0.76, 0.96)
0.86 (0.68, 0.94)
0.90 (0.78, 0.96)
1.76 3.13 3.23 3.83 6.87 6.56 3.22 2.65 2.93 2.63 1.05 1.35 6.53 0.36 4.9 8.7 9.0 10.6 19.0 18.2 8.9 7.3 8.1 7.3 2.9 3.7 18.0 1.0 % % % % % % % cm cm cm s s %
Abbreviations: FRT, functional reach test; TUG, Timed Up and Go; FSST, Four Square Step Test; ABC, Activities-specific Balance Confidence Scale; MFES, Modified Falls Efficacy Scale;
23
Table 1.3: Test-retest reliability and minimal detectable change values of gait variables
Test 1 mean (SD) Test 2 mean (SD) Paired t-test
p value ICC2,1 (95% CI) SEM MDC95
Gait Velocity (m/s) CGS FGS 1.00 1.30 (0.27) (0.36) 1.04 1.32 (0.36) (0.28) 0.128 0.102 0.88 (0.73, 0.95) 0.98 (0.94, 0.99) 0.10 0.05 0.26 0.14 m/s m/s
Cadence (steps/min) CGS FGS 108.12 123.35 (16.42) (17.30) 108.51 122.98(15.67) (15.40) 0.810 0.775 0.90 (0.78, 0.96) 0.94 (0.87, 0.98) 5.03 4.04 14.00 11.00 steps/min steps/min
Stride Length (m) FGS CGS 1.09 1.24 (0.21) (0.27) 1.14 1.27 (0.22) (0.28) 0.012* 0.010* 0.92 (0.75, 0.97) 0.98 (0.92, 0.99) 6.02 3.88 0.17 0.11 m m
Stride Width (m) CGS FGS 0.15 0.15 (0.07) (0.07) 0.15 0.15 (0.06) (0.06) 0.584 0.710 0.98 (0.94, 0.99) 0.96 (0.91, 0.99) 0.95 1.31 0.03 0.04 m m
Step Length - longer step (m)** CGS FGS 0.56 0.64 (0.(0.13) 10) 0.59 0.66 (0.13) (0.10) 0.015* 0.006* 0.90 (0.70, 0.96) 0.96 (0.85, 0.99) 3.19 2.60 0.09 0.07 m m
Step Length - shorter step (m)** FGS CGS 0.53 0.60(0.11) (0.15) 0.55 0.61 (0.12) (0.15) 0.019* 0.036* 0.93 (0.79, 0.97) 0.99 (0.97, 1.00) 3.04 1.47 0.08 0.04 m m
Double Support % CGS FGS 33.129.17 0(4.35) (6.53) 33.02 29.20(8.14) (6.86) 0.873 0.954 0.96 (0.90, 0.98) 0.95 (0.88, 0.98) 1.55 1.50 4.30 4.20 % %
Swing % - longer swing time** CGS FGS 35.02 37.02 (3.56) (2.84) 34.94 36.95 (4.11) (3.34) 0.795 0.820 0.94 (0.87, 0.98) 0.92 (0.81, 0.97) 0.94 0.88 2.62.40 0 % %
Swing % - shorter swing time** CGS FGS 31.86 33.68 (4.42) (4.43) 32.01 33.71 (3.91) (4.46) 0.585 0.913 0.96 (0.91, 0.99) 0.95 (0.88, 0.98) 0.89 0.92 2.50 2.60 % %
Abbreviations: CGS, comfortable gait speed; FGS, fast gait speed; ICC, intraclass correlation coefficient; CI, confidence interval; SEM, standard error of measurement; MDC, minimal detectable change.
* Paired t-test p-value <0.05, which suggest true difference between Test 1 and Test 2 means.
24
A. BESTest sections and total scores.
B. Timed Upand Go C. Functional Reach Test (forward & sides) D. Four Square Step Test
Figure 1.1:Unity line score plots for balance outcome measures (Test 1 - Test 2). Dots on the unity line represent identical test-retest scores. Lower scores on Test 1 appear above the line and lower scores on Test 2 beneath the line.
unity line 0 20 40 60 80 100
0 20 40 60 80 100
Tes
t
2
Test 1 I. Biomech. constraints
0 20 40 60 80 100
0 20 40 60 80 100
Tes
t
2
Test 1 II. Stability Limits
0 20 40 60 80 100
0 20 40 60 80 100
Tes t 2 Test 1 III. Anticipatory 0 20 40 60 80 100
0 20 40 60 80 100
Tes t 2 Test 1 IV. Reactive 0 20 40 60 80 100
0 20 40 60 80 100
Tes
t
2
Test 1
V. Sensory Orientation
0 20 40 60 80 100
0 20 40 60 80 100
Tes
t
2
Test 1 VI. Stability in Gait
0 20 40 60 80 100
0 20 40 60 80 100
Tes t 2 Test1 Total Score 0 5 10 15 20 25 30
0 5 10 15 20 25 30
Tes t 2 Test 1 TUG (sec) 0 5 10 15 20 25 30 35 40
0 5 10 15 20 25 30 35 40
Tes
t
2
Test 1 FRT - forward (cm)
0 5 10 15 20 25 30 35 40
0 5 10 15 20 25 30 35 40
Tes
t
2
Test 1 FRT - sides (cm)
FRT.long2 0 5 10 15 20 25 30
0 5 10 15 20 25 30
Tes
t
2
25
Figure 1.2:Unity line score plots for Activities-specific Balance Confidence (ABC) and Modified Falls Efficacy Scale (MFES) questionnaires (Test 1 - Test 2). Dots on the unity line represent identical test-retest scores. Lower scores on Test 1 appear above the line, and lower scores on Test 2 beneath the line.
unity line 0
20 40 60 80 100
0 20 40 60 80 100
Tes
t
2
Test 1 ABC
0 2 4 6 8 10
0 2 4 6 8 10
Tes
t
2
26
1.3:Unity line score plots for comfortable
gait speed (CGS) and fast gait speed (FGS)
Figure 1.3:Unity line score plots for comfortable gait speed (CGS) and fast gait speed (FGS) (Test 1 - Test 2). Dots on the unity line represent identical test-retest walking speeds. Lower walking speeds on Test 1 appear above the line, and lower walking speeds on Test 2 beneath the line.
unity line
0 0.4 0.8 1.2 1.6 2
0 0.4 0.8 1.2 1.6 2
Tes
t
2
Test 1 CGS (m/s)
0 0.4 0.8 1.2 1.6 2
0 0.4 0.8 1.2 1.6 2
Tes
t
2
27 Table 1.4. Supplement Material 1: Gait variable definitions
Gait Velocity (m/s) The sum of all Stride Length measurements divided by the sum of all Stride Time measurements of both feet.
Cadence (steps/min) The number of footfalls minus one divided by the ambulation time, converted to minutes.
Stride Length (m) The distance from the heel of one foot to the following heel of the same foot.
Stride Width (m) The perpendicular distance between the line connecting the two ipsilateral foot heel contacts (stride) with the contralateral heel contact between those events.
Step Length (m) The distance between corresponding successive heel points of opposite feet, measured parallel to the direction of progression for the ipsilateral stride Due to prevalent step length asymmetry in this population, step lengths for each side in each participant were defined as longer or shorter and the values of the variables were calculated accordingly.
Double Support % The sum of all periods in a gait cycle when both feet are in contact with the ground. Total Double Support Time presented as a percentage of the Gait Cycle Time.
Swing % The period of time the foot is not in contact with the ground presented as a percentage of the Gait Cycle Time.
Due to prevalent swing time asymmetry in this population, swing times for each side in each participant were defined as longer or shorter and the values of the variables were calculated accordingly.
%CV The Coefficient of Variation divides the Standard Deviation by the Mean and
presents the value as a percent of 100 (%). The value is normalized; thus, CVs can be compared across variables.
28
Table 1.5. Supplement Material 2: Test-retest of coefficients of variation (%CV) of gait parameters.
Test 1 mean (SD) Test 2 mean (SD) Paired t-test p value
Mean between tests difference (Test 2-Test 1)
(95% CI)
ICC2,1 (95% CI) SEM MDC95
%CV Stride Length CGS FGS 4.55 4.30 (2.12) (2.52) 4.33 3.62 (2.52) (1.62) 0.551 0.110 -0.22 -0.67 (-0.98, 0.54) (-1.51, 0.17)
0.64 (0.29, 0.84) 0.62 (0.27, 0.83)
1.13 1.31 3.10 3.60 % % %CV Stride Width CGS
FGS 28.83 25.40 (35.01) (21.74) 24.50 25.63 (20.29) (25.63) 0.288 0.968 -4.32 -0.19 (-12.59, 3.95) (-10.22, 9.72)
0.81 (0.58, 0.92) 0.62 (0.26, 0.83)
12.47 14.65 34.60 40.60 % % %CV Step Length - longer step CGS
FGS 5.70 5.55 (2.72) (2.56) 5.72 4.26 (2.61) (1.85) 0.969 0.019* 0.02 -1.29 (-1.08, 1.12) (-2.34, -0.24)*
0.63 (0.28, 0.83) 0.43 (0.03, 0.72)
1.62 1.69 4.50 4.70 % % %CV Step Length - shorter step CGS
FGS 5.86 5.20 (2.53) (2.69) 5.51 5.05 (1.80) (2.26) 0.314 0.713 -0.35 -0.15 (-1.06, 0.36) (-0.99, 0.69)
0.76 (0.50, 0.90) 0.75 (0.48, 0.89)
1.08 1.24 3.00 3.40 % % %CV Double Support % CGS
FGS 5.45 6.55 (1.84) (2.22) 5.33 6.32 (1.39) (2.21) 0.730 0.599 -0.12 -0.23 (-0.8, 0.58) (-1.13, 0.67)
0.60 (0.24, 0.82) 0.64 (0.29, 0.84)
1.03 1.33 2.90 3.70 % % %CV Swing % - longer swing time CGS
FGS 4.6 3.99 (2.72) (1.98) 4.71 4.21 (3.65) (2.47) 0.789 0.542 0.11 0.22 (-0.75, 0.97) (-0.52, 0.95)
0.85 (0.66, 0.94) 0.76 (0.49, 0.90)
1.25 1.09 3.50 3.00 % % %CV Swing % - shorter swing time CGS
FGS 4.39 4.78 (1.77) (2.01) 4.24 4.11 (2.17) (1.85) 0.558 0.022* -0.15 -0.68 (-0.69, 0.38) (-1.24, -0.11)*
0.84 (0.64, 0.93) 0.76 (0.44, 0.90)
0.79 0.95 2.20 2.60 % %
Abbreviations: CGS, comfortable gait speed; FGS, fast gait speed; %CV, coefficient of variation; ICC, intraclass correlation coefficient; CI, confidence interval; SEM, standard error of measurement; MDC, minimal detectable change.
* Paired t-test p-value <0.05, which suggest true difference between Test 1 and Test 2 means.
** Due to prevalent asymmetry in step lengths and swing time, steps on each side were defined, for each participant, as the “longer” or the “shorter”.
The coefficients of variation (%CV) of the gait parameters, had moderate to low test-retest reliability values. %CV Step Length -
longer step during FGS and %CV Swing % - shorter swing time during FGS had a significant difference between sessions and %CV
Stride Width during both speeds had very large MDC values. Individuals with CP, compared to peers without disability, demonstrated
high step-to-step variability.1 This could lead to differences in measured variability when data are collected from short walking
segments. Additionally, others have shown that the variability of gait parameters collected from passes that ended after one-length of a
29
Thus, contrarily to other assessed measures in this study, gait variability may not be a sufficiently reliable outcome when calculated
from discrete walkway passes.
References
1. Davies BL, Kurz MJ. Children with cerebral palsy have greater stochastic features present in the variability of their gait kinematics. Res Dev Disabil. 2013;34(11):3648-3653. doi:10.1016/j.ridd.2013.08.012
30
CHAPTER 3: REACTIVE BALANCE RESPONSES TO REPEATED SURFACE PERTURBATIONS DURING TREADMILL WALKING IN ADULTS WITH CEREBRAL PALSY AND ADULTS WITHOUT DISABILITIES. (MANUSCRIPT TWO)
1. Introduction
Cerebral palsy (CP) leads to permanent disorders in the development of movement and
posture that cause activity limitations throughout the lifespan.1 Approximately 60% of
school-age children with CP are able to walk independently, but exhibit balance deficits that continue to
affect their function into adulthood. More than 50% of ambulant adults with CP (ACP)
experience a decline in balance and walking abilities and report falls and near falls that cause
injuries and fear of falling.2–5 This decline may start as early as in their twenties and can lead to a
reduced walking capacity and a more sedentary lifestyle.3,6 Since life expectancy for most ACP
is nearing that of the general population, a gradual loss of function, beginning in early adulthood,
results in a substantial increase in falls risk and overall disability for many more years compared
with the general population of similar age.3,7–9
Exercise programs to improve balance employ volitional movements and show moderate
reduction in falls risk in community dwelling older adults and patient populations with
neurological deficits.10–12 New technologies, capable of providing standardized unpredictable
balance perturbations during walking allow the evaluation of reactive balance responses, reactive
balance training, and the development of intervention programs that may more efficient in
reducing falls risk.13–17 Emerging evidence suggests that repeated exposure to balance
31
post stroke.12,18,19 Considering the increased falls risk and similar balance deficits in ACP, the
study of reactive balance responses in ACP is warranted.
An unpredictable balance perturbation during walking creates a disruption to the normal
course of the center of mass (COM) that is movingin relation to the changing base of support
(BOS).20 Perturbations during walking create sudden displacements of the COM forward
(imitating trips), backward (imitating slips), and sideways and they all require reactive
adjustments of body alignment and, in most cases, changes to the normal stepping pattern to
adjust the BOS and prevent a fall.21 A reactive balance response is a sequence that includes
passive tissue responses, various levels of reflexes, and gait-phase specific modulations of the
step following the perturbation.22 The reactive response, which involves the detection of the
disturbance to the equilibrium by the sensory systems and the neuromuscular activation, happens
faster than the execution of a volitional movement. Following the initial response, additional
recovery steps are usually needed to restore normal gait.22 Compared with the response to a
perturbation experienced for the first time, responses to subsequent identical perturbations differ
in timing, magnitude, and organization pattern of muscle activations and imply the presence of
CNS modulations.23,24
Primary CNS and secondary musculoskeletal impairments impact the movement of
persons with CP and decrease their ability to restore balance following perturbations. Evidence
of reactive balance deficits exists in children, but not in adults, with CP. When perturbed in
standing on a movable platform, children with CP demonstrated poorer ability to recover balance
compared to children without disabilities.25 During recovery attempts, children with CP had
longer trajectories and more direction changes of the displacement of center-of-pressure. They
32
recovering balance.25 Children with CP demonstrate poorer temporal and spatial organization of
joint torque activation. They often activated all joints simultaneously and showed less consistent
torque-producing patterns among joints.26,27 Unlike children without disabilities, their reactive
balance patterns did not become more efficient and effective with age, and older children with
CP actually fell more often following perturbations than younger children with CP less than five
years of age.25,26
The ability to respond effectively to unpredictable losses of balance during walkingis
essential to navigate the environment without falls and injuries.13,28 ACP report losing their
balance in various circumstances in daily life, mainly during walking and turning. Falls and
losses of balance frequently involve placing the foot in a way that creates an insufficient BOS,
failing to clear the foot sufficiently off the ground, or encountering obstacles that create
destabilization.4 In these scenarios, quick adjustments of the step during walking are required,
and ACP report that often they are unable to complete these quick step adjustments.4
Reactive balance responses to unpredictable balance perturbations occurring during
walking have not been previously measured in ACP.29 Comparing responses of ACP and adults
without disabilities (AWD) can help identify key variables with which to measure reactive
balance deficits. Establishing whether these variables can be modified following repeated
exposure to perturbations during walking, and whether these modifications lead to improved
balance recovery could guide falls prevention interventions for ACP.19
Different measures have been used to assess reactive balance responses to perturbations
in standing and walking. We sought to employ measures of reactive balance that could help
future development of an observational rating tool applicable in clinical settings.30 Rail grabs
33
change in BOS caused by a perturbation.31,32 Stance time and the number of steps taken to
recover balance were used as measures to describe the destabilization.32–35
The goals of this case-control study were to: (1) compare the reactive balance responses
to unpredictable anterior-posterior (slip and trip) surface displacement balance perturbations that
occur during treadmill (TM) walking of ambulant ACP and age-and gender-matched AWD; and
(2) measure the changes in reactive balance responses of ACP following exposure to repeated
balance perturbations while walking on a TM, and to compare these to changes in reactive
balance responses made by AWD. We hypothesized that (1) compared AWD, ACP would
demonstrate: (a) higher number of balance recoveries that included a rail grab; (b) smaller step
length responses following slips; (c) longer stance times on the perturbed leg in slips, and shorter
stance times on the perturbed leg in trips; and (e) higher number of recovery steps to re-establish
regular walking; and (2) following repeated exposure, both AWD, and ACP would: (a) reduce
the number of balance recoveries that included a rail grab; (b) increase step lengths in response
to slips; (c) decrease stance time on the perturbed leg in slips, and increase stance time on the
perturbed leg in trips; and, (e) reduce the number of recovery steps following both slips and trips.
2. Methods
2.1. Participants
Fourteen ambulant ACP and 14 AWD, matched in gender and age (+/- 5 years),
completed the study. The inclusion criteria for all participants were English speaking, ability to
understand and follow simple instructions, and ability to walk comfortably for 10 minutes on the
TM without holding onto the rails. Additional inclusion criteria for ACP were a diagnosis of
34
with some balance and coordination impairments) or Level II (walking is limited in some
settings). Exclusion criteria for all participants were uncorrected vision and hearing deficit, any
condition that limited the ability to exercise, and second or third trimester pregnancy. Additional
exclusion criteria for ACP were self-reported diagnosis or observed by evaluator signs of other
neuromotor impairments (i.e. ataxia, athetosis, or dystonia), recurrent episodes of debilitating
musculoskeletal pain that affected gait in the previous 3 months, Botox to leg or back muscles in
the past 3 months, uncorrected vision or hearing, vestibular disorders, uncontrolled seizures, low
impact fracture in the past 2 years. Additional exclusion criteria for AWD were any neurological
or orthopedic conditions that affected walking or balance. This study was approved by the
Committee for the Protection of Human Subjects at the University of North Carolina at Chapel
Hill. All subjects provided informed consent prior to participation.
2.2. Protocol and data collection
Following an initial phone screening, all participants completed 3 testing sessions, each
scheduled 7 to 11 days apart. Participants wore comfortable shoes and any orthoses used for
everyday walking. They completed all TM walks on an instrumented split-belt TM1 that was
equipped with force plates mounted below the belts (170x40cm each). Participants were secured
by a safety harness, fully weight bearing, and were asked to try to avoid using the handrails to
recover balance.36 The harness load cell peak-force surpassed 30% of body weight.37 An
8-camera motion capture system (Vicon, Los Angeles, CA) recorded at 120Hz the 3-dimensional
positions of 14-mm retro reflective markers placed on the back of the heels of the participant’s
shoes. Additional markers were placed to on the trunk and lower extremities to track segmental
movement for observational purposes. The system also captured the ground reaction force