I n t e r n a t i o n a l J o u r n a l o f E n g i n e e r i n g R e s e a r c h a n d S p o r t s S c i e n c e Page1
S.S.Patil Physics Research Lab, Shri V.S.Naik Arts Commerce And Science College,Raver(M.S.)
Dr.P.V.Dalal Physics Research Lab, Shri V.S.Naik Arts Commerce And Science College,Raver(M.S.)
Dr.A.S.Zadgaonkar Director of RCET Bhilai (C.G.)
ABSTRACT
A computerized data collection system has been presented for thermal sensing equipment using thermal sensors. The thermal sensors can sense the temperature and can be used to measure thermal conductivity. The designed data collection system does perfect management of data received from different sensors used to find the temperature at different distances. Here the thermal sensing equipment is used to find the thermal conductivity using divided bar method. This system based on data logger system contains microcontroller and ADC(PIC16F882), which communicates with the designed computer interfaced program using RS-232 serial port communication and generates Microsoft Excel CSV file containing all reading of temperature for calculating thermal conductivity. __________________________________________________________________________________________________________
I. INTRODUCTION
In recent years energy crisis is a worldwide issue. Lake of resources and price rise are the main barrier in the supply of energy resources to an economy. Large fluctuations and manipulations in future derivatives are having impact on prices. Now a days it is important for each country to spend money on the research targeting maximum utilization of natural resources as well as contributory research providing substitute ideas on the devices who can improve efficiency of their thermal devices. To the country like India comes under the purview where sun energy available almost 300 days in a year. They can directly convert sun energy in other form of energy. Maximum emphasis is needed on the search of new thermo electric devices, and the materials for thermoelectric properties are required high figure of merit. Figure of merit depends on thermal conductivity as well as on thermo electric power. Fruitful and accurate data of thermal conductivity [1,2] and thermoelectric power of any material will help in designing thermo electric devices. Therefore in the present work, a computerized data collection system has been presented for the thermal sensing equipment using thermal sensors.Thermal conductivity measurement is installed at Physics research lab Shri V.S.Naik Arts, Commerce and Science College, Raver Dist. Jalgaon Pin 425508(M.S.). using this instrument and our designed computer interfaced program(software) we have measured the thermal conductivity of barium oxalate.
II. PHILOSOPHY OF THERMAL CONDUCTIVITY MEASUREMENT
The quantity of heat that passes through a substance in unit time of unit area and unit thickness, when its opposite faces are
differ in temperature by one degree is known as thermal conductivity. The S. I. unit of thermal conductivity is Watt per meter Kelvin (Wm-1K-1) Measurements of thermal conductivity is an important property for investigating lattice defects or imperfection in solid. This property also provides an opportunity for investigating existing intriguing physical phenomenon and therefore to study thermal conductivity of solid material is of great technological interest. A material possessing both very high and very low thermal conductivity has wide applications. Solid materials like diamond and silicon have high thermal conductivity and therefore they are used in thermal electronic devices [3-10]. Low thermal conductivity materials like skutterudites [11,12], clathrates [13,14], and Zintl phases [15] have found high thermoelectric efficiency [16]. The thermal conduction in solid is directly correlated with the anharmonicity of thermal vibrations. Thus, materials possessing harmonic thermal vibrations are responsible for very high thermal conductivity, whereas anharmonic vibrations are attributed for low thermal conductivity. A number of factors like impurities, dislocations and crystal boundaries contribute to thermal conduction in solids. In the present work the divided bar method is used to measure the thermal conductivity. This is perhaps the most widely used method for axial thermal conductivity testing. In this, the principle of the measurement lies with passing the heat flux through a known sample and an unknown sample and comparing the respective thermal gradients, which will be inversely proportional to their thermal conductivities. Most commonly, the unknown is sandwiched between two known samples, “the references”, to further account for minor heat losses that are very difficult to eliminate (Fig. 4.1). Where KR is the thermal conductivity of
the references. From this, the thermal conductivity of the unknown sample (KS) can be derived from the following
equation :-
COMPUTER INTERFACED PROGRAM FOR
THERMAL CONDUCTIVITY MEASUREMENT OF
SOLID CRYSTALS
COMPUTER SCIENCE
I n t e r n a t i o n a l J o u r n a l o f E n g i n e e r i n g R e s e a r c h a n d S p o r t s S c i e n c e Page2
Using the same philosophy of divided bar method the automated thermal conductivity measurement instrument is introduced as shown in fig.4.2 which helps us to calculate thermal conductivity of crystal Kc using following equation
c = m ---[ Eq..2]
Where, m is the coefficient of thermal conductivity of the
metal. is the temperature gradient of metal and
is the temperature gradient of the crystal.
III. STEPS FOR USING DESIGNED COMPUTER INTERFACED PROGRAM (SOFTWARE)
The functions of designed computer interfaced program (software) are described in flowchart ( fig.4.3)
Step 1. Do all arrangement as Shown in fig.
Step 2. Start Computer Interfaced Program.
Step 3. Select COM Port.
Step 4. Enter Thickness Of Sample In Millimetre.
Step 5. Click On Connect.
Step 6. Wait Till Coil Is heated up to desired temperature.
Step 7. Click On Disconnect.
Step 8. Click On Create CSV file to Create Excel File. Step 9. Click On Load CSV file to load Excel file into data
grid.
Step 10.Click On create Graph to plot graph.
Step 11.Calculate Slope for finding thermal Gradient. Step 12.Finally find thermal conductivity using thermal
gradient.
IV. EXPERIMENTAL WORKING
Distance of PT100 sensor A,B,C,D from heating end ‘H’(in mm)
Thermal conductivity of barium oxalate crystal was measured at 530C and 620C on a well- equipped instrument is installed at Physics research lab Shri V.S.Naik Arts, Commerce and Science College, Raver Dist. Jalgaon Pin425508(M.S.). and its schematic diagram is shown in figure 4.2. The equipment is interfaced with computer to record directly the temperatures of sectional parts of metal rod with the help of PT100 sensors, a crystal of 2.1mm thick was fixed in a stainless steel bar at a position X. Four PT100 sensors were fitted in a measured distance at position A, B, C and D. By using electrical heating coil, one end ‘H’ of metal bar was heated and kept at constant temperature at 53 0C throughout the experiment. Temperatures of a metal bar at thermocouple position A, B, C and D were measured after every minute and recorded on a computerized system. Successive lowering of temperature with increasing distance from heating end ‘H’ of metal rod at A, B, C and D were observed and the average temperature at each positions were simply determined. A plot of temperature versus distance on a rod at positions A, B, C and D is shown in figure 4.5 Exactly similar experiment was also carried out using another barium oxalate crystal of 1.5 mm thickness and measured the temperature at the same positions by keeping one end of a metal rod at 620 C. A plot of temperature versus distance at positions A, B, C and D is shown in figure 4.6. From these graphs the temperature gradients and thereby coefficient of thermal conductivity,c of the crystal were calculated using the
equation
c = m
Where m is the coefficient of thermal conductivity of the
metal. is the temperature gradient of metal and
is the temperature gradient of the crystal.
V. OBSERVATIONS AND RESULTS
I n t e r n a t i o n a l J o u r n a l o f E n g i n e e r i n g R e s e a r c h a n d S p o r t s S c i e n c e Page3
contents of these files. Using these files graph of temperature verses distance is automatically plotted. With the help of this graph thermal gradient of metal and crystal is calculated as, Determination of thermal conductivity of crystals (c)
Thermal conductivity of barium oxalate crystal at 53 0C Thermal conductivity of Stainless Steelmetal bar(Std. value)is- m = 3.8X10⁻² cal sec-1 cm-1 degree-1
Temperature gradient from Figure 4.5,
and
on substituting these values in the equation-
c=m
(c)53 0C= 0.008801 cal sec-1 cm-1 deg-1
i.e. (c)53 0C= 3.685 W m-1k-1
Thermal conductivity of barium oxalate crystal at 620C (c)62 0C= 0.007483 cal sec-1 cm-1 deg-1
i.e. (c)620C= 3.133 W m-1k-1
VI. SCHEMATIC BLOCK DIAGRAM OF AUTOMATED THERMAL CONDUCTIVITY
MEASUREMENT EQUIPMENT
Fig.4.2 Block diagram of automated thermal conductivity measurement
I n t e r n a t i o n a l J o u r n a l o f E n g i n e e r i n g R e s e a r c h a n d S p o r t s S c i e n c e Page4
VII. STRUCTURE OF MICROSOFT EXCEL CSV FILES CONTAINING ALL READINGS FOR BARIUM
OXALATE
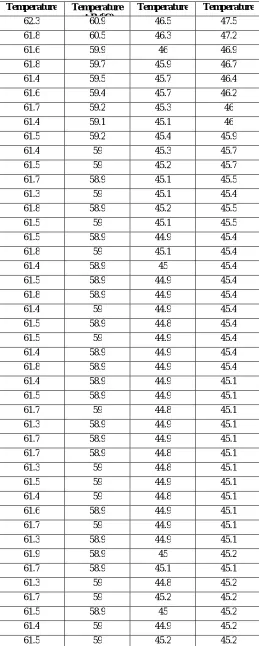
Table 4.1 all readings for barium oxalate crystal at 53 0C of 2.5 mm thickness
Temperature Temperature
at B (oC)
Temperature Temperature
62.3 60.9 46.5 47.5
61.8 60.5 46.3 47.2
61.6 59.9 46 46.9
61.8 59.7 45.9 46.7
61.4 59.5 45.7 46.4
61.6 59.4 45.7 46.2
61.7 59.2 45.3 46
61.4 59.1 45.1 46
61.5 59.2 45.4 45.9
61.4 59 45.3 45.7
61.5 59 45.2 45.7
61.7 58.9 45.1 45.5
61.3 59 45.1 45.4
61.8 58.9 45.2 45.5
61.5 59 45.1 45.5
61.5 58.9 44.9 45.4
61.8 59 45.1 45.4
61.4 58.9 45 45.4
61.5 58.9 44.9 45.4
61.8 58.9 44.9 45.4
61.4 59 44.9 45.4
61.5 58.9 44.8 45.4
61.5 59 44.9 45.4
61.4 58.9 44.9 45.4
61.8 58.9 44.9 45.4
61.4 58.9 44.9 45.1
61.5 58.9 44.9 45.1
61.7 59 44.8 45.1
61.3 58.9 44.9 45.1
61.7 58.9 44.9 45.1
61.7 58.9 44.8 45.1
61.3 59 44.8 45.1
61.5 59 44.9 45.1
61.4 59 44.8 45.1
61.6 58.9 44.9 45.1
61.7 59 44.9 45.1
61.3 58.9 44.9 45.1
61.9 58.9 45 45.2
61.7 58.9 45.1 45.1
61.3 59 44.8 45.2
61.7 59 45.2 45.2
61.5 58.9 45 45.2
61.4 59 44.9 45.2
I n t e r n a t i o n a l J o u r n a l o f E n g i n e e r i n g R e s e a r c h a n d S p o r t s S c i e n c e Page5
61.3 59 45 45.2
61.7 59 45.2 45.2
61.7 59 45 45.2
61.3 59 44.9 45.2
61.6 59 45.2 45.2
61.4 59 45.1 45.2
61.6 58.9 45.2 45.2
61.7 59 45.2 45.2
61.3 58.9 45.1 45.1
61.8 58.9 45.2 45.2
61.6 59 45.1 45.2
61.3 58.9 44.8 45.2
61.8 58.9 45.1 45.2
61.5 58.9 45.2 45.2
61.4 59 44.9 45.2
61.8 58.9 45 45.2
61.5 58.9 45.1 45.2
61.5 59 45.2 45.2
61.7 58.9 45.2 45.2
61.3 59 45.1 45.2
61.7 59 45.1 45.2
61.6 58.9 45.2 45.2
61.4 58.9 45.2 45.2
61.7 58.9 45.2 45.2
61.3 58.9 44.9 45.2
61.7 58.9 45.1 45.2
61.6 59 45.2 45.2
61.4 59 45.2 45.2
61.8 59 45.1 45.2
61.5 59 45.2 45.2
61.5 59 45.1 45.2
61.7 59 45.1 45.2
61.3 59 45.1 45.3
61.8 58.9 45.1 45.5
61.7 58.9 45.1 45.5
61.3 59 45.2 45.5
61.6 59 45.1 45.5
61.4 59 45.2 45.5
61.6 59 45.1 45.5
61.7 58.9 45.1 45.5
61.3 59 44.9 45.5
61.8 59 45.1 45.4
61.5 59 45.2 45.5
61.5 58.9 45.2 45.5
61.7 59 45.1 45.5
61.3 58.9 45.2 45.5
61.7 58.9 45.2 45.5
61.6 59 45.2 45.5
61.4 59 45.1 45.5
61.8 58.9 45.1 45.5
61.3 59 45.2 45.5
61.7 59 45.1 45.5
61.5 58.9 45.2 45.5
61.5 59 45.2 45.4
61.7 59 45.1 45.5
61.3 59 45.2 45.5
61.7 59 45.1 45.4
61.5 59 45.2 45.4
61.4 59 45.1 45.4
61.8 58.9 45.1 45.4
61.3 59 45.2 45.3
61.7 59 45.1 45.3
61.7 58.9 45.1 45.3
61.3 59 45.2 45.3
61.7 58.9 45.2 45.4
61.5 58.9 45.1 45.4
61.4 58.9 45.2 45.4
61.8 58.9 45.1 45.4
61.4 58.9 45.2 45.4
61.5 59 45.1 45.4
61.7 58.9 45.1 45.4
61.4 59 45.1 45.3
61.8 59 45.1 45.4
61.6 58.9 45.2 45.3
61.4 59 45.2 45.3
61.8 58.9 45.2 45.4
61.5 58.9 45.1 45.3
61.4 59 45.1 45.4
61.5 59 45.2 45.3
61.4 58.9 45.2 45.3
61.8 59 45.1 45.4
61.5 59 45.2 45.5
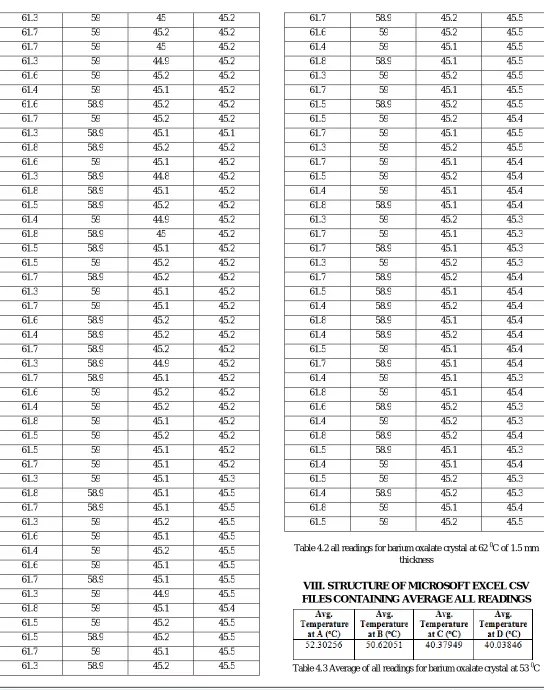
Table 4.2 all readings for barium oxalate crystal at 62 0C of 1.5 mm thickness
VIII. STRUCTURE OF MICROSOFT EXCEL CSV FILES CONTAINING AVERAGE ALL READINGS
I n t e r n a t i o n a l J o u r n a l o f E n g i n e e r i n g R e s e a r c h a n d S p o r t s S c i e n c e Page6 of 2.5 mm thickness
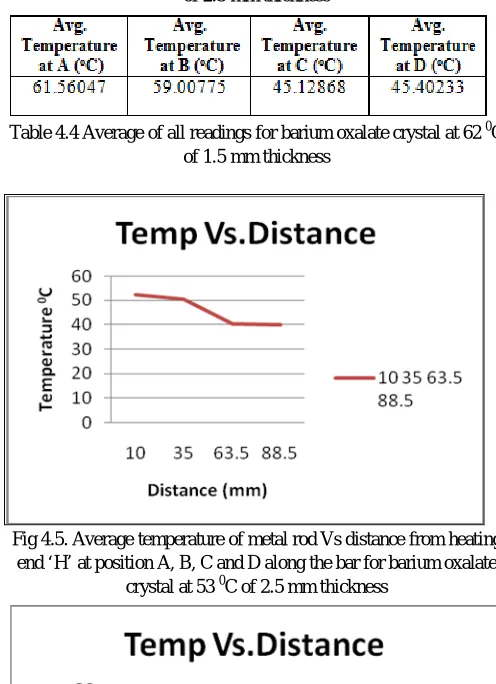
Table 4.4 Average of all readings for barium oxalate crystal at 62 0C of 1.5 mm thickness
Fig 4.5. Average temperature of metal rod Vs distance from heating end ‘H’ at position A, B, C and D along the bar for barium oxalate
crystal at 53 0C of 2.5 mm thickness
Fig 4.6. Average temperature of metal rod Vs distance from heating end ‘H’ at position A, B, C and D along the bar for barium oxalate
crystal at 62 0C of 1.5 mm thickness
Discussion and Conclusion
Using the designed computer interfaced program (software) and thermal conductivity measurement instrument it is quite easy to record all temperature reading data and storing it into file for further calculations. Also it is very useful for plotting the graphs. This automated thermal conductivity measurement equipment creates faithful and correct data reading for the purpose of thermal conductivity measurement. The thermal conductivity of barium oxalate crystal at 530C was found 3.685 and 3.133Wm-1K-1 at 620C.
REFERENCES
[1] C Codreanu., N.Codreanu , V. V. N. Obreja, Romanian Journal Of Information Science And Technology,10 (2007), 215-231. [2] A.K.Singh, V.Deo, G.C.Pant, Defence Science Journal,54 (2004), 515-524
[3] D. G.Onn, A.Witek, Y. Z.Qiu, T. R.Anthony, and W.F.Banholzer, Phys. Rev. Lett 68 (1992), 2806-2809.
[4] T. R.Anthony, W. F.Banholzer, J. F.Fleischer, L.Wei, P. K.Kuo, R. L.Thomas, and R. W.Pryor, Phys. Rev. B42 (1990), 1104-1111. [5] J. R.Olson, R. O.Pohl, Vandersande, A.Zoltan, T. R. Anthony and W. F .Banholzer, Phys. Rev. B 47 (1993), 14850-14856.
[6] L.Wei, P. K.Kuo, R. L.Thomas, T. R.Anthony, and W. F.Banholzer,Phys. Rev. lett. 70 (1993), 3764-3767.
[7] K.C.Hass, M.A.Tamor, T. R.Anthony, W. F.Banholzer, Phys. Rev. B-45 (1992), 7171
[8] R.Berman, Phys. Rev. B-45 (1992), 5726
[9] T.Ruf, W.Henn, M.Asen-Plamer, E.Gmelin, M.Cardona, H. J.Pohl, G. G.Devyatych, and P. G.Sennikov,
[10] D. T.Morelli, J. P.Heremans, and G. A.Slack, Phys. Rev. B-66 (2002), 195
[11] C.Uher, Skutterudites: prospective novel thermoelectrics.In: Tritt T M (ed.)Semiconductors and Semimetals. RecentTrends in Thermoelectric Materials Research, Academic Press, San Diego69 (2000), Chap.5,139
[12] G. S.Nolas, D. T. Morelli, T. M.Tritt, Annu. Rev. Mater.Sci. 29 (1999), 89
[13] Encyclopedia of Materials:Science and
Technology,Thermoelecrtic Materials :Principles, Properties and Applications, Elsevier Science Ltd.(2002),1
[14] G.S.Nolas, J.Poon, G.Kanatzidis, Mat.Res.Bull.31(2006),199 [15] S. M.Kauzlarich, S. R.Brown, G. J.Snyder,Dalton
Trans,21(2007),2099