doi: 10.4114/intartif.vol21iss61pp95-110
ISSN: 1137-3601 (print), 1988-3064 (on-line) ©IBERAMIA and the authors
INTELIGENCIA ARTIFICIAL
http://journal.iberamia.org/
Machine Learning-Based Analysis of the Association between
Online Texts and Stock Price Movements
František Dařena, Jonáš Petrovský, Jak Přichystal, Jan Žižka
Department of Informatics, Faculty of Business and Economics, Mendel University in Brno
[email protected], [email protected], [email protected], [email protected]
Abstract The paper presents the result of experiments that were designed with the goal of revealing the association between texts published in online environments (Yahoo! Finance, Facebook, and Twitter) and changes in stock prices of the corresponding companies at a micro level. The association between lexicon detected sentiment and stock price movements was not confirmed. It was, however, possible to reveal and quantify such association with the application of machine learning-based classification. From the experiments it was obvious that the data preparation procedure had a substantial impact on the results. Thus, different stock price smoothing, lags between the release of documents and related stock price changes, five levels of a minimal stock price change, three different weighting schemes for structured document representation, and six classifiers were studied. It has been shown that at least part of the movement of stock prices is associated with the textual content if a proper combination of processing parameters is selected.
Keywords: Stock price movements, machine learning, classification, textual documents, sentiment.
1
Introduction
A lot of research has been focusing on incorporating the vast amount of data available online into models of various social and economic phenomena. One such domain is the field of capital markets where the data provided by digital media can help, e.g., in explaining less rational factors such as investors’ sentiment or public mood as influential for asset pricing and capital market volatility [11].
Most of the past research in this domain utilized structured data, which is often objective, to analyze the impact of volatile data on business [19]. There exist several commercial financial expert systems that can be successfully used for trading on the stock exchange. When they rely primarily rely on time-series analysis of the market their capabilities are limited [63]. Including other information sources and types into various models can provide another perspective and potentially complementary information to quantitative evidence. In the financial forecasting domain, data mining, text mining, natural language processing, and behavioral economics are commonly used disciplines [29]. It is therefore obvious that unstructured texts, published by different types of subjects, containing additional hard-to-quantify knowledge are a typical source of this supplementary information [27]. This is supported by [30] that developed a stock price forecasting system combining financial and textual information.
Advantages of using online resources for decision making support include the timeliness of the information, which is particularly important for investment decisions. On the other hand, the quality of the messages posted in online environments (such as microblogs or discussions in social networks) is generally low. That is why Internet postings have been the least frequently studied source of textual sentiment [27]. Despite all difficulties, content generated by web users has become a widely accepted resource for mining sentiment or opinions regarding different aspects of the public mood [61]. It has been shown that a large number of people participating in a content generation process enables the creation of artifacts that are of equal or superior quality than those made by experts in the respective field [18]. Messages from millions of people are also unlikely to be biased [41].
The most commonly used source for analysing a relationship between textual data and problems in financial domain are financial news [29]. Many studies also focus on just a single data source, besides the newspapers it is also Twitter [32,46], Facebook [54], 8-K forms [30], 10-K forms [36] and others. Several studies also focus on an aggregate value representing stock price movements, such as [7,46,53]. Sentiment based approaches are quite popular but bringing contradictory conclusions [7,33].
Our goal is to determine whether there exist quantifiable associations between the content of online texts related to a company and the movements of the stock prices of that company. In our work we focus on analysis at the micro level, namely at the level of individual companies. In this research, we combine documents from three different sources, Yahoo! Finance, Facebook (posts and comments), and Twitter collected over a period of about 8 months. A sentiment lexicon and a machine learning-based approach, as two possible alternatives, are tested in order to find out whether subjective content or the entire content play an important role in revealing document-stock price movement association.
2
Related Work
The Efficient Market Hypothesis and Random Walk Theory postulate that it is impossible to predict future stock prices based on currently available information. Despite this, a lot of research has been done with the aim of achieving better than random predictions [17]. Sometimes, not only prediction, but explanation of the movements might be interesting. The research differs in the purpose (e.g., predicting a price or a movement direction), used data (e.g., historical stock prices, textual data from newspapers, Twitter, financial reports, including their combinations), level of detail (e.g., an entire market represented by an index or individual companies or industries), and methods (e.g., regression, optimization, classification, expert models, Granger causality).
Wuthrich et al. [65] investigated whether the content of newspaper articles can predict changes in selected composite indices. Their approach is based on training data from 100 days and a set of more than four hundred phrases provided by a human expert. They achieved the prediction accuracy between 40 and 47% with a great portion of additional outcomes that were only slightly wrong and were able to achieve a trading strategy comparable to or better than human managers. Rao and Srivastava [36] studied several characteristics of Twitter messages and their relation to stock price movements for 13 stock market indices. They found a strong correlation up to 0.88.
Ranco [46] studied 30 companies that form the Dow Jones Industrial Average (DJIA) index in a period of 15 months. They found a significant dependence between the Twitter sentiment and abnormal returns, which is relatively low (about 1–2%), during the peaks of Twitter volume. The prediction of stock price movements (up, down, or no movement) at the end of a trading day based on the content of news published in the Wall Street Journal before stock opening hours was studied by Ming et al. [38]. A similar approach was used by Sun, Lachanski, and Fabozzi [57]. However, they studied the impact of messages from StockTwits (a communication platform for the investing community) that were published before opening a stock exchange on closing stock prices. They also used different frequency for those predictions (within one day, but they found that the predictions between days were more successful. Schumaker and Chen [51] studied 484 companies from the S&P 500 for one month in 2005. They analyzed the impact of news releases on stock price movements. In their experiments using a support vector machine derivative they achieved 56 to 58% of directional accuracy. The prediction performance may depend on an industry – Li et al. [32] achieved better results in predicting stock prices based on Twitter data in the IT and media domains.
does not always bring useful predictions as their models using sentiment polarity did not perform well in all the experiments. The differences between the models using two different sentiment dictionaries was also quite negligible. Various sentiment dictionaries are quite popular. Their size may significantly differ, e.g., Henry’s dictionary [22] contains 189 words, the dictionary of Myšková and Hájek [42] 256 phrases, Loughran’s and McDonald’s dictionary [36] 2,709 words etc. The dictionaries can be created manually or derived using a learning algorithm. We can conclude that sentiment based approaches are quite popular but bringing contradictory conclusions [7,33].
Despite numerous attempts and application areas summarized by Hagenau, Liebmann and Neumann [21], prediction accuracies for the direction of stock prices following the release of corporate financial news rarely exceeded 58%. The same authors achieved accuracy of about 76% for one data set by employing a particular combination of advanced feature generation and selection methods together with exogenous market feedback. On the other hand, de Fortuny et al. [17] were able to perform slightly better than simple random guessing.
The suitability of online data for predictions in financial markets might vary according to a particular data source. The reason is that the people that through their behavior determine the stock prices use these data sources differently and are thus influenced by them to a different extent. For example, the Wall Street Journal reaches hundreds of thousands finance and investment professionals and is extremely well established and has strong reputations with investors [59]. On the other hand, although the average age of Facebook users is increasing over time, stock investors are likely to be underrepresented there [54].
Compared to other research, we analyze data from multiple sources using a common methodology employing both the dictionary based and content based approaches. Besides popular newspaper articles, we employ also data from Twitter and Facebook. On Facebook, we distinguish two types of documents – posts created by company representatives, and comments created by other Facebook users. Unlike other studies, that focus on an aggregate value representing stock price movements [7,46,53] we focus on the level of individual companies.
3
Data Used in the Experiments
In the experiments, data related to so-called blue chip (large and famous) companies was used. The reason for this choice was a higher probability of availability of a sufficient amount of related texts. The analyzed companies were selected from Standard & Poor’s 500 and FTSEurofirst 300 indices as they contain a sufficient number of listed companies, both US based and European. In order to analyze the relationship between stock price movements and facts and opinions expressed by Internet users, two types of data were needed – stock prices at desired moments in time, and texts containing information related to the selected companies.
The information about stock prices may be obtained at stock exchanges or in specialized Internet data sources. For our purpose, Yahoo! Finance was selected as a suitable one as it contains daily data for many stock exchanges around the whole world, with a long history, and is available free of charge. For every working day and company, opening, highest, lowest, closing, and adjusted closing stock prices are available together with traded volumes.
Texts related to the investigated companies may be found in many different sources. Usually, the objective ones are typically found on news servers. From available financial news servers Yahoo! Finance was selected. It contains news aggregated from several sources (unlike, e.g., Reuters.com), is one of the most visited servers (measured by the Alexa rank), contains also recommendations of financial analysts, and is accessible free of charge. Texts containing also subjective opinion are usually located on places where the content is created by individuals without many constraints imposed on the content. These places include social networks, microblogging sites, instant messaging platforms, sites for multimedia sharing, or discussion forums. In our work, the social networks and microblogging sites Facebook and Twitter were used. They belong to the biggest sites on the web, are used across the entire world (are not limited, e.g., to China), provide free public access through their APIs, and contain a lot of text data; Twitter also enables searching for specific content.
The previously-mentioned data was downloaded according to a predefined schedule. Information about stock prices was downloaded once every day as well as Yahoo! Finance articles and new posts on Facebook profiles. Together with them, the 100 most liked comments were also retrieved. Twitter data was collected every six hours because of larger volumes and the inability to retrieve more than 100 tweets at a time. Table 1 contains the total and average numbers of data items analyzed in the experiments.
Table 1: Amounts of data from different sources (from 1 August 2015 to 4 April 2016). Document type Total number Daily average /
company
Monthly average / company
Yahoo! Finance article 73,730 0.41 12
Facebook post 62,447 0.64 19
Facebook comment 1,314,148 13.63 399
Twitter status 1,451,493 609,87 17,846
4
Analyzing the Association Between Texts and Stock Prices
The presented problem belongs to a group of tasks that are described by variables whose values are recorded – and thus implicitly ordered – over a period of time. This is known as a time series and the variables are called series variables. Such problems usually need a more detailed mathematical investigation; a good overview of this area can be found, for instance, in [23]. A simple time series can be described as a discrete function Y taking its values yt at certain time points t, Y = {yt: t ∊ T}, where T stands for an index set of a given stretch of time. In
economics, a typical example may be the daily closing average values of stock prices, which is part of the investigated problem here. Except for the scalar values yt, the general function Y may also return vectors yt, which
is here a case of text comments that accompany the stock-price time series sharing the same time dimension. Looking at the comments from their meaning point of view expressed in a natural language, their message sense is given by the terms (words) included in it. The reader quite rightly may expect that the meaning points of the messages are not random but somehow logically relate to the values of the stock prices (or vice versa, the stock prices can relate to the comments). However, the question is how to express such mutual dependency?
The chosen point of departure is here the shared time dimension. The stock price values, st, can be expressed
as a time series S = {st: t ∊ T}, and similarly the meaning of comments as M = {wt: t ∊ T}, where wt stands for a
word-vector (a sequence of numeric values representing words in a comment). Words are included in the vocabulary, which is shared by the all investigated comments over the given stretch of time. Time and words are represented by numbers – for the time variable, it can be dates, and for words, for example, their either weighted or unweighted frequencies in individual comments. To look for the possible (and expected) interdependency between values returned by two functions Y1 and Y2, the statistical theory offers computations of so-called
correlation values provided by a correlation function C(Y1, Y2). Here, both Y1 and Y2 play the role of random
variables. Statistical methods include several possibilities for the correlation-degree calculation between two (or more) series of stochastic variable values; for example, perhaps the most popular is the classic Pearson’s correlation coefficient [4] based on the rate between the covariance of two variables and the product of their standard deviation. Good material on the analysis of the classical concepts of correlation and on the development of their robust versions, as well as discussion of the related concepts of correlation matrices, partial correlation, canonical correlation, rank correlations, with the corresponding robust and non-robust estimation procedures, can be found in [52].
However, the described problem here is complicated by the fact that in C(S, M) the wi is not a scalar value and,
without giving direct proof whether the relationship is causal or not. Such proof might be later empirically provided by, for example, analyzing the semantic contents of comments in each class. The method of revealing the interdependency is described in detail in the following sections, including the experimental testing using real-world data.
In the field of capital markets, behavioral finance considers factors such as investors’ sentiment or public mood as influential for asset pricing and capital market volatility. Thus, sentiment analysis is one of the important research approaches used in this area in the last few years [11]. Sentiment analysis mainly studies opinions that express positive or negative sentiments. The most important indicators of sentiment are so-called sentiment words or expressions [34] and a comprehensive, high quality lexicon is often essential for fast and accurate sentiment analysis on a large scale [25]. By application of such a lexicon to a document a single number (e.g., on a scale <-1;+1>) or a nominal value (e.g., negative, neutral, positive) representing the overall sentiment (that represents the document properties) can be determined.
As mentioned, the values representing stock price movements and properties of the related textual documents are considered a time series sharing the same time dimension. However, it is not clear when the values of one series react to the values of the other. It can be assumed that the time series are shifted in time relatively to each other, which is known as a lagged relationship. In this paper we study how financial markets react to news, which is a long-lasting question in finance [64]. We consider one-, two-, and three-day lags between the publication of documents and stock price movements.
4.1
Handling Stock Prices
A stock price is represented by a number expressing the price (in, e.g., US dollars) at which stocks are sold and purchased at a certain moment in time. Because the price is usually volatile (is changing very quickly) during trading periods (in opening hours of a stock exchange), only some of the values are important, especially for historical data. Typically, opening (at the beginning), closing (at the end), low (minimal), and high (maximal) prices in a day are considered [1].
In an investigated period, the stock prices can remain on the same level, which is very rare, or increase or decrease at different rates (slowly or rapidly). Naturally, the prices change very quickly and usually at small rates, reflecting many different events, habits, or sentiment [6]. Not all changes are, however, important – after a small drop the price might return to its original (or higher) level very quickly and vice versa, repeating such movements for a few days or weeks. The price at the end of a week might be thus almost the same as at the beginning while having undergone many small movements. These movements might have a reason but there is also evidence that price movements might be completely random [8] and it is not necessary to include them in reasoning about the data.
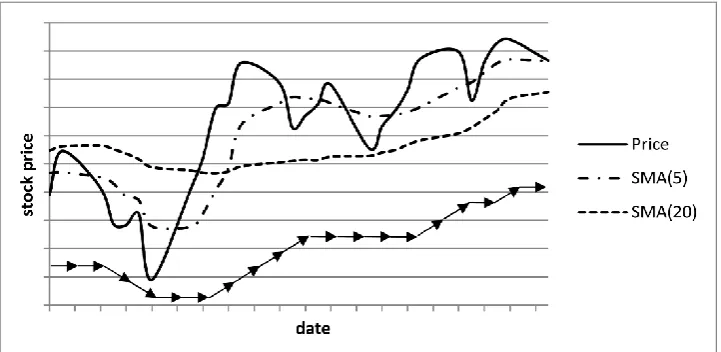
Thus for stock prices, considered non-stationary time series data, rather trends, cycles, or their combinations are more important [45]. These movements can be revealed by replacing the original values by other values not showing that high volatility (this process is known as smoothing). The “noise” is eliminated, better representing real and significant changes. Good candidates are moving averages that substitute the original data by sequences of averages calculated from subsets of the data sets. Changes in these average values are then better indicators of important changes in prices, see Fig. 1.
Moving averages of different types have been widely used in technical analyses studying stocks markets. Generally, a moving average calculation can work with sequences of subsequent values of different lengths. Short moving averages are more sensitive to changes than long ones [62]. Generally, there are two distinct groups of smoothing methods – averaging methods, and exponential smoothing methods, both calculating a new value based on n (here, a number of days) last original values. The former (Simple Moving Average – SMA) relies on calculating the mean of successive smaller sets of numbers of past data. The latter (Exponentially Weighted Moving Average – EWMA) assigns exponentially decreasing weights as the observations become older [43]:
SMAt = (pricet + pricet-1 + … pricet-n+1) / n
EWMAt = ∙ pricet + (1 – )∙ EWMAt-1, = 2 / (n+1)
In our experiments, besides working with the original stock prices, both types of moving averages based on two different periods, 5 and 20 days, were considered for calculations in order to include averages with different sensitivities.
average change in market indices is often much more, about 1.5%. Lee et al. [30] used the minimal change of 1% and Mittermayer [40] worked with 1% average change and 3% extremes in the change. In our work, the price movements were considered significant if the price changed by 1, 2, 3, 4, or 5 percent. Positive and negative changes above this threshold are then considered price increases and price drops (decreases), respectively. They then represent the classes (categories) for the stock prices data set.
Figure 1. A graph showing stock price development and its smoothing (using Simple Moving Average, SMA, working with 5 and 20 days). The smoothing can better reveal trends in the data as expressed by the arrows. Here,
three trend types (increase, stagnation, and decrease) based on a minimal price change are shown for the values smoothed using SMA(5).
4.2
Handling Text Data
Text documents generally contain information that has some relationship to reality (the reality is described, evaluated, judged, and compared). Understanding the messages might then help with interpreting or predicting events in reality without explicitly observing and studying it. For example, after looking at customer reviews of hotel accommodation at a travelers’ website the business performance of a hotel might be predicted [66].
This information consisting of objective facts, personal attitudes, feelings, assumptions, current mood, etc. is expressed by the words and their combinations contained in the text. A perfect understanding of the meaning of a text and its relation to reality is, however, a complicated task often not faultlessly accomplished even by human experts. Nevertheless, for many tasks perfect and complete comprehension of the text is not needed. It is, for example, possible to determine the main topic of a newspaper article on the basis of the presence of some keywords in the text. Similarly, according to a few properties (contained words, number of words, text visibility, presence of hyperlinks, etc.) an e-mail can be classified as spam or non-spam.
In the last years a lot of research has been devoted to extracting useful knowledge (e.g., sentiment or included topics) from texts written in natural languages. This discipline, known as text mining [16], is a branch of computer science that uses techniques from data mining, information retrieval, machine learning, statistics, natural language processing, and knowledge management [5].
4.3
Using Lexicons to Derive Properties of Text Documents
The principle of sentiment extraction based on sentiment lexicons is looking for sentimental words or expressions in texts and taking their sentiment categories or orientation into consideration. The sentiment might be expressed on a three-level scale (typically negative, neutral, and positive, or -1, 0, and 1) or on a finer grained scale (e.g., in the range -5 to +5). All occurrences of significant words or expressions and their sentiment values are then averaged, counted, or aggregated in another way. The final decision on the document/sentence/expression sentiment depends on the scale used and on the type of information needed. The decision results might be, for example, that a document is positive on aggregate, or that it contains both positive and negative parts, or that the sum of weights of all positive expressions is x while the sum of weights of all positive expressions is y [60].
In order to achieve satisfactory results, a sufficiently large and high-quality lexicon must be available. The problem is that a word or expression might have different sentiment polarity in different domains. Thus, using a sentiment lexicon, manually or automatically created for one domain does not have to work well in a different domain. There exist many available sentiment lexicons, see, e.g., [3,25,36,58]. It can be noticed that they significantly differ in the number of words or expressions they contain (from a few hundred to about 150,000). They are also tailored to different domains or are domain independent. Determining what a correct lexicon is, however, depends on the particular task and source of the data used in the research. For analyzing texts from microblogging sites a lexicon might be, for example, enriched by including a list of emoticons to increase accuracy of sentiment detection [2].
Using lexicons for sentiment determination is connected to several difficulties negatively affecting the results. Besides domain specificity, they include word sense disambiguation when looking at a particular word in a lexicon [24], distinguishing between parts of speech when finding sentimental words [37], or inability to handle informal expressions that are typical, e.g., for Twitter messages [9].
4.4
Using Machine Learning to Derive Properties of Text Documents
Textual documents contain mostly unstructured information which is not suitable, in terms of effectivity and efficiency, for most of the knowledge discovery procedures. Texts are therefore usually converted to a more appropriate structured representation. A widely used structured format is the vector space model proposed by Salton and McGill [50]. Every document is represented by a vector where individual dimensions correspond to the features (terms) and the values are the weights (importance) of the features. The weight wij of every term i in
document j is given by three components – a local weight lwij representing the frequency in every single
document, a global weight gwi reflecting the discriminative ability of the term, based on the distribution of the
term in the entire document collection, and a normalization factor nj correcting the impact of different document
lengths. Popular weighing measures include term frequency and term presence for the local weight [55], inverse document frequency for the global weight [48], and the cosine normalization [13] as the normalization factor. All vectors then form a so-called document-term matrix where the rows represent the documents and the columns correspond to the terms in the documents.
Very often, the features correspond to the words contained in the documents. Such a simple approach, known as the bag-of-words approach, is popular because of its simplicity and straightforward process of creation while providing satisfactory results [26]. Text mining heavily relies on the application of various preprocessing techniques including, e.g., text cleaning, white space removal, case folding, spelling error corrections, abbreviation expanding, stemming, stop words removal, negation handling, and finally feature selection [12, 15, 20]. These techniques influence what will be the features characterizing the documents.
In order to quantify the relationship between stock prices and related texts a classifier that assigns a label to a text, based on the values of attributes derived from the text, is trained. The label should be correlated to a class (movement trend) derived from the stock price changes of the corresponding time series. A classifier implements a function that assigns labels to objects provided on the input. This function h, called the hypothesis, can be induced from existing examples of input-output pairs, known as training examples. The outputs were generated by an unknown function y. The goal of training (a supervised learning problem) is to find a hypothesis that well approximates y. The hypothesis can be subsequently used for assigning labels to new, unseen instances. When the values of y are discrete, the process is known as classification [49].
To measure the quality of the trained classifiers, i.e., their ability to be used acceptably for unknown documents in the future, they are examined on test samples that are distinct from the training ones and for which correct answers are known. The values representing correctly and incorrectly classified examples are used to compute measures of classifier effectiveness. In the two class classification, the classes might be labelled as positive and negative. The positive and negative examples that are classified correctly are referred to as true positive (TP) and true negative (TN), respectively. False positive (FP) and false negative (FN) represent misclassified positive and negative examples. Commonly accepted classifier performance evaluation measures include accuracy, precision, recall, and F-measure combining the values of TP, TN, FP, and FN into a single measure [56]. The strength of the relationship between the input (the content of documents) and output (the label representing stock price movements) might be then expressed by standard classification performance measures, such as accuracy or F-measure since they contain information on how well a classifier is able to assign a correct label to a document based on the values of its attributes. High values of these measures say that there exist attributes or their combinations that are accurately able to distinguish between instances of different classes.
5
Experiments
Four different data sources (newspaper articles, Facebook posts and comments, and tweets) were investigated separately. The amount of available documents did not allow us processing them with available technology (memory limits were reached). Thus, a maximum 200 most retweeted tweets and 40 most liked Facebook comments for every company in every day were processed. The size of the two remaining data sets, i.e., Facebook posts and Yahoo! Finance articles, were not that huge, so no preselection needed to be performed.
In case of Facebook data, setting the upper limit to the number of processed documents affected about a half of the companies in just slightly more than 17% of the studied days. The reduction of the number of documents was more significant – almost a half of them with low numbers of reactions was eliminated. The exclusion of some tweets happened in 97% of the studied days and affected almost three quarters of the documents since publishing of the tweets happened quite frequently. After some of the data was eliminated, a significant number of documents was still available. However, considering only the documents having a higher popularity that could influence a higher number of people made the problem computationally feasible.
For both the lexicon- and machine learning-based approaches the stock price time series needed to be transformed using moving averages as explained above. For the machine learning-based procedure, a suitable class label for training a classifier in order to determine the correlation with stock price movements needed to be assigned to every text. In order to transform the stock price data and to determine a class label of a document Di
related to company Ci, released at time Tr, representing a change in stock price of company Ci at time Tc the
following aspects and parameters needed to be determined:
Concrete values of stock prices to be considered – here, adjusted closing values, simple moving average and exponential moving average, both based on 5 and 20 days were analyzed; for days when no value was available (weekends, holidays), the price was calculated as the arithmetic average of the last closing value and the first following opening value.
The lag between publication of texts at date Tr and a stock price movement at Tc – lags of 1, 2, and 3 days
were investigated.
The minimal relative difference in stock prices at Tc and Tc-1 to be considered significant – changes of 1, 2,
3, 4, and 5 percent were investigated. If a price change is within the percentage limit it is considered constant and all documents related to the specific date are labelled by the stagnation class label. If the price change is above the limit in the positive direction, i.e., increased more than, e.g., 3%, documents are labelled as increase. In the remaining case, the price decreased significantly and the corresponding documents are labelled by the decrease label.
5.1
Using lexicons to estimate stock price movements
As one can expect, documents containing positive sentiment about a company should be connected to stock price increase. On the contrary, stock price decrease should accompany negative sentiment. For this kind of analysis, we need two variables – sentiment contained in text documents (revealed using a sentiment lexicon) and movement categories derived from stock prices changes. To make the quantification of the interdependence between them comparable to the other experiments (machine learning-based procedure) the same set of metrics was used. In fact, sentiment in a document (or a document collection) can be considered a factor assigning a direction (class) to a stock price movement (positive sentiment = increase, negative sentiment = decrease, and neutral sentiment = stagnation). The actual movement should be, in an ideal case, the same as the predicted movement, which can be measured using standard classification performance measures, such as accuracy or F-measure.
To determine the sentiment contained in the investigated texts the VADER algorithm [25] was used. The algorithm enables determining the compound sentiment of a given piece of text based on a manually created sentiment lexicon with five general rules that embody grammatical and syntactical conventions for expressing and emphasizing sentiment intensity. The model is especially attuned to microblog-like contexts and demonstrates great correlation with the judgements of humans.
The output of the VADER algorithm is a number from [-1; 1] scale representing a sentiment polarity. To determine a particular sentiment class, e.g., negative, neutral, and positive, some thresholds for the sentiment value needed to be specified. Similarly to [25], these thresholds were set to the values -0.05 and +0.05.
Considering combinations of all possible parameters of this procedure, i.e., five options for stock price value transformation (adjusted close, simple and exponential moving averages working with 5 and 20 days), three options for the lag (1, 2, or 3 days), and five options for class determination (change 1-5 percent), 75 data sets where the expected document class was determined differently were prepared. These class labels were then compared to the outputs of VADER and the necessary metrics for measuring the success of the process were calculated. To make the experiments comparable to the machine learning-based experiments only positive and negative classes were considered.
5.2
Analyzing the dependence between stock prices and texts using classification
The texts of documents were modified in the way that all HTML tags, @ and # characters (marking user names and hashtags) and other non-alphanumeric characters were removed, selected emoticons were replaced by artificial terms representing positive and negative sentiment, all URLs were replaced by a single artificial term, and the text was converted to lower case. The minimal length of processed words was 2, and the minimal document frequency of terms was 10 for Yahoo! Finance articles and 5 for the other collections. The texts were converted to vectors using the bag-of-word approach to become acceptable for machine learning algorithms. As weighting schemes, three possibilities were investigated – simple term presence, term frequency with the inverse document frequency weight (tf-idf), and tf-idf with cosine normalization. In order not to bias a classifier against one bigger class the numbers of documents from both classes (increase and decrease) were balanced.
From the great amount of existing classifiers, the following ones, available in Python’s scikit-learn package [35] were investigated: Multinomial Naïve Bayes (with α=1, i.e., Laplace smoothing), Bernoulli Naïve Bayes, Logistic regression (Maximum entropy), CART decision tree, Random forest, and Linear SVC (Support vector machine with a linear kernel). These algorithms are among those often used in sentiment analysis and text classification [44,67]. The data was split into training and test sets in the proportion 65:35 percent.
To make the experiment’s results comparable to the lexicon-based approach, the same methods for document class determination and stock price series transformation were used. Seventy-five different data sets containing documents labelled differently were then encoded using the three weighing schemes (term presence, idf, and tf-idf with cosine normalization) into three different representations which were later supplied to six classifiers.
6
Results and Discussion
6.1
Lexicon Based Analysis
Generally, the number of days with positive aggregate sentiment largely exceeded the number of days with negative sentiment, in a ratio of 5:1 to 20:1, depending on the document source. On the contrary, the number of days in positive and negative classes, based on price movements was mostly in a ratio of 1:1 to 1:2 for the settings with a sufficient amount of available data. The results of comparing actual classes (based on stock price movements) with predicted classes (based on sentiment) were thus strongly biased towards the positive class. Accuracy was therefore not an ideal performance measure. For that reason, the presented results also contain the values of F-measure.
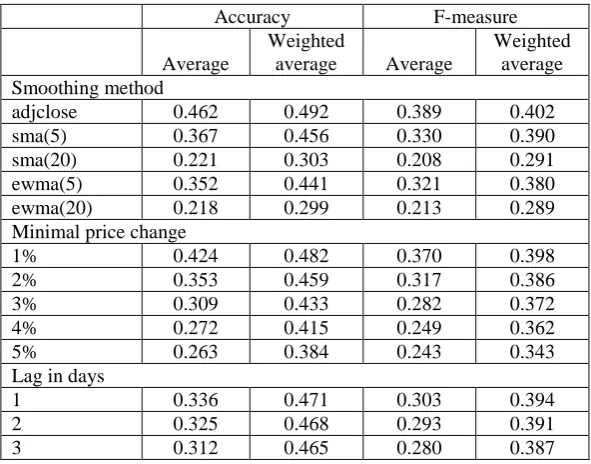
The classes (for each company and day) predicted with sentiment analysis were compared to the classes based on all combinations (75 in total) of stock price change category determination parameters, i.e., combinations of a smoothing method, minimal price change, and lag in days. The correctness of the matches between these two values was aggregated and 75 sets of classification performance measure values for each data source were obtained. These values were then averaged with a simple arithmetic average and a weighted average using the numbers of processed items in the experiments as the weights (the results of experiments with a higher number of items had a higher weight). The aggregated values, from the perspective of the three variable parameters, are presented in Table 2. As the differences between the values obtained for each of the four data sources were not significant the results aggregated over all experiments are presented.
Table 2: Aggregate values of accuracy and F-measure representing the association between stock price movements and sentiment of related documents.
Accuracy F-measure
Average
Weighted
average Average
Weighted average Smoothing method
adjclose 0.462 0.492 0.389 0.402
sma(5) 0.367 0.456 0.330 0.390
sma(20) 0.221 0.303 0.208 0.291
ewma(5) 0.352 0.441 0.321 0.380
ewma(20) 0.218 0.299 0.213 0.289
Minimal price change
1% 0.424 0.482 0.370 0.398
2% 0.353 0.459 0.317 0.386
3% 0.309 0.433 0.282 0.372
4% 0.272 0.415 0.249 0.362
5% 0.263 0.384 0.243 0.343
Lag in days
1 0.336 0.471 0.303 0.394
2 0.325 0.468 0.293 0.391
3 0.312 0.465 0.280 0.387
The smoothing method and minimal price change influenced the amount of data available for experiments. Higher numbers of days used for smoothing and higher minimal price change decreased the numbers of available items. Generally, when only tens of data items were available the values of accuracy or F-measure quantifying the results were lower than in the case of experiments with thousands or tens of thousands of items.
The correctness of the proposed approach is generally quite low, with accuracy and F-measure values below 0.5, decreasing with the decreasing number of data items available for the experiments. The influence of the smoothing method and minimal price change parameters cannot be thus reliably determined. The only parameter for which comparable data sets were analyzed was the lag in days. Here, the highest values of performance measures can be identified for the value of 1 day.
6.2
Classification based analysis
each experiment. To achieve sufficiently general results, collections with less than 500 documents were excluded from detailed analyses of the experiments.
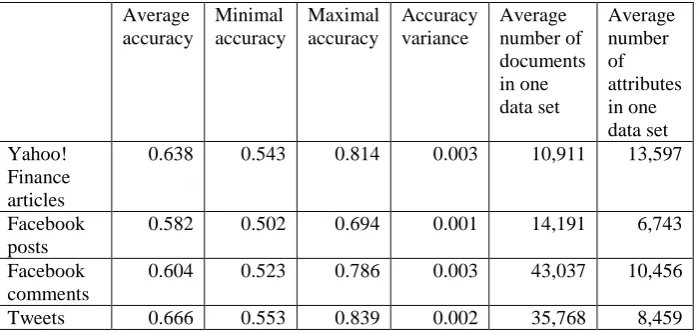
Selected statistical measures of the most important classification performance metrics and data set properties for all experiments can be found in Table 3. The values are based on experiments using all possible combinations of parameters. Because the collections were almost perfectly balanced in terms of class distribution in the data sets, the values of accuracy, precision, recall, and F-measure reached almost the same values. Thus, in the following text, only the values of accuracy are presented.
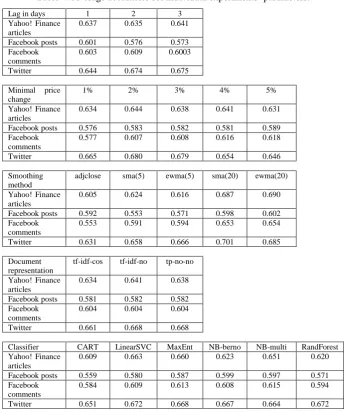
From Table 3 it is obvious that the accuracy varies quite significantly from its minimal to maximal values, which is given by different experimental settings. In practice, the experiments where higher accuracies are achieved are more interesting. Thus, a detailed exploration of the algorithms used and experimental settings was conducted in order to reveal how individual parameters influenced the success of the classification process. For every variable parameter (a method of stock price values smoothing, a lag between documents’ release and related stock price changes, minimal stock price change, classifier, and weighting scheme) average accuracies for all experiments with a fixed value of the parameter were calculated in order to reveal whether some parameter values lead to better results on average. The achieved average accuracies can be found in Table 4.
Table 3: Classification performance metrics values and data set characteristics for all experiments with data from all four sources.
Average accuracy
Minimal accuracy
Maximal accuracy
Accuracy variance
Average number of documents in one data set
Average number of attributes in one data set Yahoo!
Finance articles
0.638 0.543 0.814 0.003 10,911 13,597
Facebook posts
0.582 0.502 0.694 0.001 14,191 6,743
Facebook comments
0.604 0.523 0.786 0.003 43,037 10,456
Tweets 0.666 0.553 0.839 0.002 35,768 8,459
From Table 4 it is obvious that only the smoothing method and classifier used had a significant impact on accuracy values. Higher accuracies were achieved for sma(20) and ewma(20) and for LinearSVC, MaxEnt, and multinomial Naïve Bayes classifiers across all data sources (the average accuracies for all combinations containing only these values for respective parameters increased to 0.72 for Yahoo! Finance articles, 0.61 for Facebook posts, 0.67 for Facebook comments, and 0.70 for tweets). For further analysis, only these parameter values were considered to better evaluate the impact of the remaining experimental parameters.
When bigger minimal stock price changes were considered in the experiments, the achieved accuracies had a tendency to be higher. From the parameters used, the minimal percentage stock price change was the parameter that influenced the size of data set the most. The higher the minimal change to be considered significant, the smaller number of documents labelled as increase or decrease was available. The experiments were thus carried out with different numbers of documents based on the value of the minimal stock price change parameter. In order to take this into consideration when looking at the result of subsequent analyses, not only average accuracies, but also average accuracies weighted by the number of documents used in the experiments were calculated. The values of both achieved accuracies are presented in Table 5.
Because of high volatility of the stock price data, smoothing of the time series has proven to be a reasonable step in improving the accuracy for most of the data sources significantly. Moving averages based on 20 days had more positive impact than moving averages based on 5 days. The type of moving average (simple or exponential) was not considerably important.
the time distance between an article and a price movement is somewhat short. Texts that are published very quickly, such as Twitter messages, might anticipate a price movement earlier. Facebook posts that are often prepared by company representatives are usually not published timely so their nature is in this respect more similar to newspaper articles. The comments created by other people are sometimes immediate, sometimes delayed.
For all data sources, except Twitter, higher considered minimal stock price changes lead to better results in terms of classification accuracy. We can assume that these substantial changes were accompanied by an exceptional content of documents making them more distinguishable from the documents published in periods with no or small price changes. This parameter, however, influences the size of available data (there are fewer periods with large changes than periods with small changes) so the possibility of mining useful knowledge from the data might be limited.
The impact of different weighting methods was very low; the average accuracies lie in an interval of about 1%. Thus, the weighting scheme can be considered an unimportant factor of data preprocessing.
Table 4: Average accuracies for individual experiments’ parameters.
Lag in days 1 2 3
Yahoo! Finance articles
0.637 0.635 0.641
Facebook posts 0.601 0.576 0.573 Facebook
comments
0.603 0.609 0.6003
Twitter 0.644 0.674 0.675
Minimal price change
1% 2% 3% 4% 5%
Yahoo! Finance articles
0.634 0.644 0.638 0.641 0.631
Facebook posts 0.576 0.583 0.582 0.581 0.589 Facebook
comments
0.577 0.607 0.608 0.616 0.618
Twitter 0.665 0.680 0.679 0.654 0.646
Smoothing method
adjclose sma(5) ewma(5) sma(20) ewma(20)
Yahoo! Finance articles
0.605 0.624 0.616 0.687 0.690
Facebook posts 0.592 0.553 0.571 0.598 0.602 Facebook
comments
0.553 0.591 0.594 0.653 0.654
Twitter 0.631 0.658 0.666 0.701 0.685
Document representation
tf-idf-cos tf-idf-no tp-no-no
Yahoo! Finance articles
0.634 0.641 0.638
Facebook posts 0.581 0.582 0.582 Facebook
comments
0.604 0.604 0.604
Twitter 0.661 0.668 0.668
Classifier CART LinearSVC MaxEnt NB-berno NB-multi RandForest Yahoo! Finance
articles
0.609 0.663 0.660 0.623 0.651 0.620
Facebook posts 0.559 0.580 0.587 0.599 0.597 0.571 Facebook
comments
0.584 0.609 0.613 0.608 0.615 0.594
Twitter 0.651 0.672 0.668 0.667 0.664 0.672
The paper presents the result of experiments that were designed with the goal of revealing the association between texts published in online environments (Yahoo! Finance articles, Facebook posts and comments, and Twitter messages) and changes in stock prices of the corresponding companies at a micro level. To make the association quantifiable, several methods of transformation of the two time-series (texts and stock prices) were carried out. Stock prices were smoothed by four different methods, three different lags between the release of documents and related stock price changes were considered, five levels of a minimal stock price change to consider the change as significant were used, and three different weighting schemes for structured document representation used in the machine learning procedure were examined. From these parameters, the smoothing method played the most important role. It was found that smoothing the stock price data with moving averages based on the 20 preceding days led to better results than in the case of using only 5 days. Such smoothing removed excessive price oscillations which are quite typical for this type of data and are often random. On the other hand, some of the important changes, especially when followed by another change in the opposite direction might be lost.
The association between sentiment (detected with the application of a state-of-the-art sentiment lexicon) contained in the documents and movement of stock prices was not confirmed. The association expressed by the correctness of matching positive sentiment to stock price increase and negative sentiment to stock price decrease was very low as measured by the accuracy and F-measure.
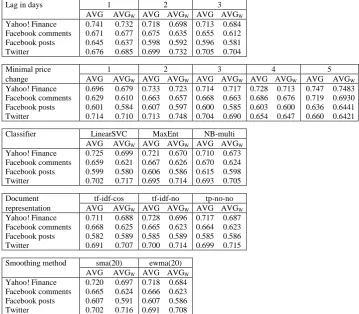
Table 5: Average accuracies (AVG) and weighted average accuracies (AVGW) for the parameters of individual
experiments. All experiments with classifiers and smoothing methods different from those presented were excluded.
Lag in days 1 2 3
AVG AVGW AVG AVGW AVG AVGW Yahoo! Finance 0.741 0.732 0.718 0.698 0.713 0.684 Facebook comments 0.671 0.677 0.675 0.635 0.655 0.612 Facebook posts 0.645 0.637 0.598 0.592 0.596 0.581 Twitter 0.676 0.685 0.699 0.732 0.705 0.704
Minimal price 1 2 3 4 5
change AVG AVGW AVG AVGW AVG AVGW AVG AVGW AVG AVGW Yahoo! Finance 0.696 0.679 0.733 0.723 0.714 0.717 0.728 0.713 0.747 0.7483 Facebook comments 0.629 0.610 0.663 0.657 0.668 0.663 0.686 0.676 0.719 0.6930 Facebook posts 0.601 0.584 0.607 0.597 0.600 0.585 0.603 0.600 0.636 0.6441 Twitter 0.714 0.710 0.713 0.748 0.704 0.690 0.654 0.647 0.660 0.6421
Classifier LinearSVC MaxEnt NB-multi AVG AVGW AVG AVGW AVG AVGW Yahoo! Finance 0.725 0.699 0.721 0.670 0.710 0.673 Facebook comments 0.659 0.621 0.667 0.626 0.670 0.624 Facebook posts 0.599 0.580 0.606 0.586 0.615 0.598 Twitter 0.702 0.717 0.695 0.714 0.693 0.705
Document tf-idf-cos tf-idf-no tp-no-no representation AVG AVGW AVG AVGW AVG AVGW Yahoo! Finance 0.711 0.688 0.728 0.696 0.717 0.687 Facebook comments 0.668 0.625 0.665 0.623 0.664 0.623 Facebook posts 0.582 0.589 0.585 0.589 0.585 0.586 Twitter 0.691 0.707 0.700 0.714 0.699 0.715
Smoothing method sma(20) ewma(20) AVG AVGW AVG AVGW Yahoo! Finance 0.720 0.697 0.718 0.684 Facebook comments 0.665 0.624 0.666 0.623 Facebook posts 0.607 0.591 0.607 0.586 Twitter 0.702 0.716 0.691 0.708
research goal). The difference between the maximal and minimal achieved accuracies for the same data was between about 20 and 30%. It was therefore obvious that the data preparation procedure had a substantial impact on the results. By further analysis of variable parameters, the values for which better results were accomplished could be identified.
There are generally many aspects that influence stock price movements and that are not always included in online texts. It is thus clear that the documents’ content cannot explain or predict all movements. It has been shown that at least part of these movements is associated to the texts and can be used as part of a more complex model of economic phenomena.
Future research directions will include a tighter interconnection with the economic aspects of the domain, including, e.g., other external market and economy information and industry specifics. Special attention will be paid to the process of transformation of texts to their structured representation including specific approaches to processing texts from different data sources and their combinations. From the machine learning perspective, processing the data in a stream using, e.g., a moving window approach [68], processing unbalanced data, or including additional features such as the dynamics of Facebook posts and comments likings, Yahoo! Finance articles sharing or Twitter messages popularity (expressed as number of shares/retweets of the document received) are possible ways.
Acknowledgements
This research was supported by the Czech Science Foundation [grant No. 16-26353S, “Sentiment and its Impact on Stock Markets”].
References
[1] C. Ang. Analyzing Financial Data and Implementing Financial Models Using R. Springer, 2015.
[2] M. Arias, A. Arratia, A., and R. Xuriguera. Forecasting with Twitter Data. ACM Transactions on Intelligent Systems and Technology, 59:1–8:24, 2013.
[3] S. Baccianella, A. Esuli, and F. Sebastiani. SentiWordNet 3.0: An enhanced lexical resource for sentiment analysis and opinion mining. In Proc. of the Seventh Conf. on Int. Language Resources and Evaluation LREC10 (European Language Resources Association, 2010), pages 2200–2204.
[4] J. Benesty, J. Chen, Y. Huang, and I. Cohen. Pearson Correlation Coefficient. Springer, 2009. [5] M. W. Berry, and J. Kogan. Text Mining: Applications and Theory. Wiley, Chichester, 2010.
[6] B. M. Blau, and T. G. Griffith. Price clustering and the stability of stock prices. Journal of Business Research, 69:3933–3942, 2016.
[7] J. Bollen, H. Mao, and X. Zeng. Twitter mood predicts the stock market. Journal of Computational Science, 2:1–8, 2011.
[8] K. Borch. Price movements in the stock market. Econometric research program, research paper no. 7, Princeton University, 1963.
[9] F. Bravo-Marquez, E. Frank, and B. Pfahringer. Building a Twitter opinion lexicon from automatically-annotated tweets. Knowledge-Based Systems, 108:65–78, 2016.
[10] L. Breiman. Statistical modeling: The two cultures (with comments and a rejoinder by the author). Statistical Science, 16: 199–231, 2001.
[11] J. Bukovina. Social media big data and capital markets—An overview. Journal of Behavioral and Experimental Finance, 11: 18–26, 2016.
[12] G. Carvalho, D. M. de Matos, and V. Rocio. Document retrieval for question answering: a quantitative evaluation of text preprocessing. In Proc. of the ACM first Ph. D. workshop in CIKM (ACM, 2007), pages 125– 130.
[13] E. Chisholm, and T. G. Kolda. New term weighting formulas for the vector space method in information retrieval. Computer Science and Mathematics Division, Oak Ridge National Laboratory, 1999.
[14] H. Cho, S. Kim, J. Lee, and J. S. Lee. Data-driven integration of multiple sentiment dictionaries for lexicon-based sentiment classification of product reviews. Knowledge-Based Systems, 71:61–71, 2014.
[15] E. Clark, and K. Araki. Text normalization in social media: progress, problems and applications for a pre-processing system of casual English. Procedia – Social and Behavioral Sciences, 27:2–11, 2011.
[16] R. Feldman, and J. Sanger. The text mining handbook: advanced approaches in analyzing unstructured data. Cambridge University Press, 2007.
[17] E. J. de Fortuny, T. de Smedt, D. Martens, and W. Daelemans. Evaluating and understanding text-based stock price prediction models. Information Processing & Management, 50:426–441, 2014.
[19] S. S. Groth, and J. Muntermann. An intraday market risk management approach based on textual analysis. Decision Support Systems, 50:680–691, 2011.
[20] E. Haddi, X. Liu, and Y. Shi. The role of text pre-processing in sentiment analysis. Procedia Computer Science, 17:26–32, 2013.
[21] M. Hagenau, M. Liebmann, and D. Neumann. Automated news reading: Stock price prediction based on financial news using context-capturing features. Decision Support Systems, 55:685–697, 2013.
[22] E. Henry. Are investors influenced by how earnings press releases are written? Journal of Business Communication, 45.4: 363–407, 2008.
[23] J. D. Hamilton. Time Series Analysis. Princeton University Press, 1994.
[24] C. Hung, and S. J. Chen. Word sense disambiguation based sentiment lexicons for sentiment classification. Decision Support Systems, 55:685–697, 2013.
[25] C. J. Hutto, and E. Gilbert. Vader: A parsimonious rule-based model for sentiment analysis of social media text. In Eighth International AAAI Conference on Weblogs and Social Media, 2014.
[26] T. Joachims. Learning to classify text using support vector machines: Methods, theory and algorithms. Kluwer Academic Publishers, 2002.
[27] C. Kearney, and S. Liu. Textual sentiment in finance: A survey of methods and models. Int. Review of Financial Analysis, 33:171–185, 2014.
[28] J. Krinitz, S. Alfano, and D. Neumann. How The Market Can Detect Its Own Mispricing-A Sentiment Index To Detect Irrational Exuberance. In Proceedings of the 50th Hawaii International Conference on System Sciences (2017).
[29] B. S. Kumar, and V. Ravi. A survey of the applications of text mining in financial domain. Knowledge-Based Systems, 114:128–147, 2016.
[30] H. Lee, M. Surdeanu, B. MacCartney, and D. Jurafsky. On the Importance of Text Analysis for Stock Price Prediction. In LREC (2014), pages 1170–1175.
[31] F. Li. The information content of forward‐looking statements in corporate filings—A naïve Bayesian machine learning approach. Journal of Accounting Research, 48:1049–1102, 2010.
[32] B. Li, K. C. C. Chan, C. Ou, S. Ruifeng. Discovering public sentiment in social media for predicting stock movement of publicly listed companies. Information Systems, 69:81–92, 2017.
[33] X. Li et al. News impact on stock price return via sentiment analysis. Knowledge-Based Systems, 69:14–23, 2014.
[34] B. Liu. Sentiment analysis and opinion mining. Synthesis lectures on human language technologies, 5:1– 167, 2012.
[35] B. Lorica. Six reasons why I recommend scikit-learn (2015), https://www.oreilly.com/ideas/six-reasons-why-i-recommend-scikit-learn.
[36] T. Loughran, and B. McDonald. When is a liability not a liability? Textual analysis, dictionaries, and 10-ks. The Journal of Finance, LXVI:35–65, 2011.
[37] I. Maks, and P. Vossen. A lexicon model for deep sentiment analysis and opinion mining applications. Decision Support Systems, 53:680–688, 2012.
[38] F. Ming et al. Stock market prediction from WSJ: text mining via sparse matrix factorization. In Data Mining (ICDM), 2014 IEEE International Conference on. IEEE (2014), pages 430–439.
[39] C. Mitchell. How to use a moving average to buy stocks — Investopedia, 2016. http://www.investopedia.com/articles/active-trading/052014/how-use-moving-average-buy-stocks.asp.
[40] M.-A. Mittermayer. Forecasting intraday stock price trends with text mining techniques. In Proceedings of the 37th Annual Hawaii International Conference on System Sciences (2014).
[41] M. M. Mostafa. More than words: Social networks’ text mining for consumer brand sentiments. Expert Systems with Applications, 40:4241–4251, 2013.
[42] R. Myšková, and P. Hájek. Novel Multi-word Lists for Investors’ Decision Making. In: International Conference on Text, Speech, and Dialogue (2015), pages 131–139.
[43] NIST/SEMATECH. e-Handbook of Statistical Methods, 2016. http://www.itl.nist.gov/div898/handbook/. [44] B. Pang, L. Lee, and S. Vaithyanathan. Thumbs up?: sentiment classification using machine learning techniques. In Proc.of the ACL-02 conference on Empirical methods in natural language processing, Vol. 10, 2002, pages 79–86.
[45] J. Patel, S. Shah, P. Thakkar, and K. Kotecha. Predicting stock and stock price index movement using trend deterministic data preparation and machine learning techniques. Expert Systems with Applications, 42:259–268, 2015.
[46] G. Ranco et al. The effects of Twitter sentiment on stock price returns. PloS one, 10.9: e0138441, 2015. [47] T. Rao, and S. Srivastava. Twitter sentiment analysis: How to hedge your bets in the stock markets. State of the Art Applications of Social Network Analysis, Springer, 2014, pages 227–247.
[49] S. Russel, and P. Norwig. Artificial Intelligence: A Modern Approach. Pearson Education, Upper Saddle River, 2016.
[50] G. Salton, and M. J. McGill. Introduction to Modern Information Retrieval, McGraw Hill, 1983.
[51] R. P. Schumaker, and H. Chen. Textual analysis of stock market prediction using breaking financial news: The AZFin text system. ACM Transactions on Information Systems, 27, 2009.
[52] G. L. Shevlyakov, and H. Oja. Robust Correlation: Theory and Applications. John Wiley & Sons, 2016. [53] A. Siganos, E. Vagenas-Nanos, and P. Verwijmeren. Facebook's daily sentiment and international stock markets Journal of Economic Behavior & Organization, 107, Part B:730–743, 2014.
[54] A. Siganos, E. Vagenas-Nanos, and Patrick Verwijmeren. Divergence of sentiment and stock market trading. Journal of Banking & Finance, 78:130–141, 2017.
[55] A. K. Singhal. Term Weighting Revisited, PhD dissertation, Faculty of the Graduate School of Cornell University, 1997.
[56] M. Sokolova, N. Japkowicz, and S. Szpakowicz. Beyond accuracy, F-score and ROC: a family of discriminant measures for performance evaluation. In Australasian Joint Conf. on Artificial Intelligence, 2006, pages 1015–1021.
[57] A. Sun, M. Lachanski, and F. J. Fabozzi. Trade the tweet: Social media text mining and sparse matrix factorization for stock market prediction. International Review of Financial Analysis, 48:272–281, 2016.
[58] M. Taboada, J. Brooke, M. Tofiloski, K. Voll, and M. Stede. Lexicon-based methods for sentiment analysis. Comp. linguistics, 37:267–307, 2011.
[59] P. C. Tetlock. Giving Content to Investor Sentiment: The Role of Media in the Stock Market. The Journal of Finance, LXII:1139–1168, 2007.
[60] M. Thelwall, K. Buckley, G. Paltoglou, D. Cai, and A. Kappas. Sentiment strength detection in short informal text. Journal of the American Society for Information Science and Technology, 61:2544–2558, 2010. [61] A. Tumasjan, T. O. Sprenger, P. G. Sandner, and I. M. Welpe. Election forecasts with Twitter: How 140 characters reflect the political landscape. Social Science Computer Review, 29:402–418, 2011.
[62] L. Wang, H. An, X. Xia, X. Liu, X. Sun, and X. Huang. Generating moving average trading rules on the oil futures market with genetic algorithms. Mathematical Problems in Engineering, 2014.
[63] B. Weng, M. A. Ahmed, and F. M. Megahed. Stock market one-day ahead movement prediction using disparate data sources. Expert Systems with Applications, 79:153–163, 2017.
[64] F. M. F. Wong, Z. Liu, and M. Chiang. Stock market prediction from WSJ: text mining via sparse matrix factorization. In 2014 IEEE Int. Conf. on Data Mining, 2014, pages 430–439.
[65] B. Wuthrich, V. Cho, S. Leung, D. Permunetilleke, K. Sankaran, and J. Zhang. Daily stock market forecast from textual web data. In 1998 IEEE Int. Conf. on Systems, Man, and Cybernetics, Vol. 3, 1998, pages 2720– 2725.
[66] Q. Ye, R. Law, and B. Gu. The impact of online user reviews on hotel room sales. Int. Journal of Hospitality Management, 28:180–182, 2009.
[67] J. Žižka, and F. Dařena. Automated Mining of Relevant N-grams in Relation to Predominant Topics of Text Documents. In Int. Conf. on Text, Speech, and Dialogue, 2015, pages 461–469.