R E S E A R C H A R T I C L E
Open Access
Surgery and risk for multiple sclerosis: a
systematic review and meta-analysis of
case
–
control studies
Carole Lunny, Jennifer A Knopp-Sihota and Shawn N Fraser
*Abstract
Background:Although the precise etiology of multiple sclerosis is largely unknown, there is some speculation that a prior history of surgery may be associated with the subsequent risk for developing the disease. Therefore, we aimed to examine surgery as a risk factor for the diagnosis of multiple sclerosis.
Methods:We searched for observational studies that evaluated the risk for developing multiple sclerosis after surgery that occurred in childhood (≤20 years of age) or“premorbid”(> 20 years of age). We specifically included
surgeries classified as: tonsillectomy, appendectomy, adenoidectomy, or“surgery”. We performed a systematic
review and meta-analyses and calculated odds ratios (OR) and their 95% confidence intervals (CIs) using a random effects model.
Results:We identified 33 case–control studies, involving 27,373 multiple sclerosis cases and 211,756 controls. There
was a statistically significant association between tonsillectomy (OR = 1.32, 95% CI 1.08-1.61; 12 studies, I2= 44%)
and appendectomy (OR = 1.16, 95% CI 1.01-1.34; 7 studies, I2= 0%) in individual’s≤20 years of age and the
subsequent risk for developing multiple sclerosis. There was no statistically significant association between risk for
multiple sclerosis and tonsillectomy occurring after age 20 (OR = 1.20, 95% CI 0.94-1.53; 9 studies, I2= 32%), in those
with appendectomy at > 20 years (OR = 1.26, 95% CI 0.92-1.72; 5 studies, I2= 46%), and in those with
adenoidectomy at≤20 years of age (OR = 1.06, 95% CI 0.68-1.68; 3 studies, I2= 35%). The combined OR of 15
studies (N = 2,380) looking at“surgery”before multiple sclerosis diagnosis was not statistically significant (OR = 1.19, 95% CI 0.83-1.70; I2= 71%).
Conclusions:We found a small but statistically significant and clinically important increased risk for developing
multiple sclerosis, in those with tonsillectomy and appendectomy at≤20 years of age. There was no convincing
evidence to support the association of other surgeries and the risk for multiple sclerosis. Well-designed prospective etiological studies, pertaining to the risk for developing multiple sclerosis, ought to be conducted and should include the examination of various surgeries as risk factors.
Keywords:Adenoidectomy, Appendectomy, Multiple sclerosis, Observational studies, Risk, Surgery, Systematic review, Tonsillectomy
* Correspondence:[email protected]
Centre for Nursing and Health Studies, Faculty of Health Disciplines, Athabasca University, 1 University Drive Athabasca, Alberta T9S 3A3, Canada
© 2013 Lunny et al.; licensee BioMed Central Ltd. This is an Open Access article distributed under the terms of the Creative Commons Attribution License (http://creativecommons.org/licenses/by/2.0), which permits unrestricted use, distribution, and reproduction in any medium, provided the original work is properly cited.
Background
Multiple sclerosis (MS) is a complex immune-mediated in-flammatory disease of the central nervous system affecting an estimated 2 million people worldwide [1]. MS, one of the most common non-traumatic neurological disorders in younger adults, affects more females (than males) with a population prevalence of approximately 0.1% in North America [1]. The epidemiological and clinical importance of MS lies in the significant disability and morbidity attributed to the disease. Not only is the condition relatively common, it is costly with an estimated economic burden exceeding $6 billion annually in the United States alone [2].
Description of the condition
The first symptoms or signs of MS, diagnosed by a phys-ician, are referred to as the clinical onset of the disease. As there are limited (and consistent) clinical, laboratory, and imaging findings in MS, diagnostic classifications are gener-ally reduced to “definite MS” and “possible MS”. Several established diagnostic standards have been used over the years to assist physicians in the diagnosis of MS; these in-clude criterion such as the Poser criteria [3] and most re-cently the McDonald criteria [4].
Although the precise etiology of MS is largely un-known, epidemiological studies point at an important role in both genetic and environmental factors that seem to act synergistically increasing an individual’s risk of de-veloping the disease. Specifically, risks such as genetic factors (the presence of HLA-DRB1*15 alleles), infec-tious causes including Epstein-Barr virus (EBV), vitamin D insufficiency, exposure to cigarette smoke, and a more northern geographic residence (latitude) have all been well documented in the literature [5-9]. There is some speculation that other factors, including a history of ton-sillectomy, appendectomy, or other surgery may also be associated with the risk of developing MS [10].
Relevance of systematic review and meta-analysis
Although there have been studies examining prior surgery as a risk factor for MS, these studies have generally been smaller-scale observational studies of varied methodological quality in which a wide range of both positive and negative results have been reported. Therefore, we conducted a for-mal Cochrane style systematic review and meta-analysis of observational studies to examine the association between tonsillectomy, appendectomy, adenoidectomy, and other “surgery”and the risk of developing MS. We are not aware of another similar published meta-analysis on this topic; therefore, a systematic review (SR) including meta-analysis is timely.
Methods
We followed the procedures for conducting systematic reviews and meta-analysis as outlined by the Cochrane
Collaboration [11] and the reporting guidelines of the Meta-Analysis of Observational Studies in Epidemiology (MOOSE) [12].
Search strategy
Studies were identified by several methods. First, we searched for completed reviews in the Database of Abstracts of Reviews of Effects (DARE), Evidence for Policy and Practice Information (EPPI) Centre, the HealthEvidence.ca website, and the Cochrane Database of Systematic Reviews (CDSR). We searched for individ-ual studies in the MEDLINE, EMBASE, SCIRUS, Web of Science, PubMed, and the LILACS (Latin American and Caribbean Computer Library Center) databases. The Google Web search engine (www.google.com) and Google Scholar (scholar.google.com) were used to locate articles that may not have been included in the above databases. Grey literature was searched using ‘OpenSIGLE’, ‘NTIS’, ‘Health Management Information’,‘British National Bibliog-raphy for Report Literature’, Proquest Dissertations and Theses - Full Text, Dissertation Abstracts, CINHAL, and CyberTesis.
We used the following text words and Medical Subject Headings: (a) multiple sclerosis OR demyelinating dis-ease, and (b) surgery; surgical intervention; operations; medical history; hospitalisation; tonsillectomy; anaes-thetic; appendectomy; adenoidectomy; risk factor; etio-logic factor; severe; minor; association; causation; case– control; cohort.In addition, reference lists of all relevant articles were examined for further pertinent studies; and conference proceedings were sought from various web sites and organizations. Forward citation searches of in-cluded studies and relevant literature reviews were also done. Primary authors and experts in the field were contacted to identify additional published, unpublished, or 'in-progress' studies. The search was not limited by publication date, language, or publication status. All da-tabases were last accessed in August 2012.
Inclusion criteria
We planned to include a broad range of observational studies: cohort, case–control, and cross sectional de-signs. As there were few primary studies, we also planned to include retrospective studies utilizing second-ary data from healthcare databases. To be eligible for in-clusion, studies needed to include patients with physician diagnosed MS (preferably by using diagnostic criteria for a definite diagnosis of MS) and report ori-ginal data. Studies were excluded if there was no control group.
The primary outcome of interest was the development of MS following a past history of tonsillectomy, append-ectomy, adenoidappend-ectomy, or other surgery. If the authors did not specify the type of surgery, we included these
Lunnyet al. BMC Neurology2013,13:41 Page 2 of 15
studies and classified them as “other surgery”. Surgeries were defined according to their classification in each in-dividual study. Further, due to the estimated mean latency period and the critical age at puberty, these cat-egories and sub-catcat-egories were divided by age at the time of surgery: (1) age≤20 years, and (2) > 20 years.
Data collection and analysis Selection of studies
One of the study investigators (CL) performed the initial search of all databases to identify potentially relevant citations. Where it was not possible to accept or reject the study, the full text of the citation was obtained for further evaluation. Following the screening of titles and abstracts, the full texts of potential articles were re-trieved (and translated into English where required) and assessed independently by two of the study investigators (CL, JKS). If any differences in opinion occurred, they were resolved by consensus with a third reviewer.
Data extraction and management
Data were independently extracted by one unmasked re-viewer (CL) using a standardized electronic data collec-tion form and were then checked by a second reviewer (JKS) for accuracy. When raw data were not provided, the data were extracted from figures; where necessary, we attempted to seek additional information from first or corresponding authors of the included studies via electronic mail. The following information was obtained for each study (where possible): source, eligibility, methods, participant demographics, MS diagnostic infor-mation, confounding variables adjusted for, outcome ex-posures, and results.
Quality assessment: Risk of bias in included studies
After identification of articles meeting the inclusion cri-teria, two review authors (CL, JKS) independently assessed the methodological quality of studies according to the criteria of the Newcastle-Ottawa Quality Assess-ment Scale (NOS) as recommended by the Cochrane Collaboration for assessing the quality of non-randomized studies [13]. The NOS is based on a cumu-lative score in each of three broad categories: selection of study groups, comparability of their cases and con-trols, and their ascertainment of the outcome / exposure on cases and controls. If a study fulfils the criteria for an item, a score of 1 point is allocated, with the exception of comparability which can score up to 2 points, resulting in a maximum score of 9. Similar to other re-views, we considered studies that received a score of≥6 on the NOS criteria to be of high quality. We specifically classified studies as high risk of bias (1–3 points), medium risk of bias (4–5 points), or low risk of bias (6–9 points). In the case of disagreement between
reviewers, differences were to be resolved by discussion until consensus was achieved.
Dealing with missing data
As missing data (statistics) were evident in many of the included studies, we attempted to contact 13 separate investigators at least twice. Six authors replied, and two provided the requested data; therefore, available data were extracted from published reports, and missing data were imputed. For those studies reporting “no signifi-cance”, with no additional statistical data, we assumed an odds ratio (OR) of 1.0 and estimated the confidence intervals (CIs) based on the number of reported MS cases [14]. Sensitivity analyses were performed to check the effect of imputation.
Assessment of heterogeneity and reporting bias
Heterogeneity between studies was examined visually using the I2 statistic. Deeks and colleagues (for the Cochrane Collaboration) [15] suggest the following as a rough guide for interpreting the I2statistic:
0% to 40%: might not be important;
30% to 60%: may represent moderate heterogeneity;
50% to 90%: may represent substantial
heterogeneity;
75% to 100%: considerable heterogeneity.
Possible sources of heterogeneity were assessed by sensitivity analyses and described qualitatively in Table 1 (Characteristics of included studies).
Stratified meta-regression, based on sub-groups in-cluding 10 or more studies, was performed to further examine heterogeneity. A priori, we planned to explore the following population-level continuous variables (geo-graphic latitude, female-to-male MS case ratio, mean age of MS onset), and study-level dichotomous variables (language [English vs. non-English]), publication type [published vs. unpublished], number of covariates ad-justed for [≤ 2 vs. > 2], total sample size [≤ 100 vs. > 100], and sample size of MS cases [≤ 100 vs. > 100]. Odds ratios (β) and 95% CIs were calculated using the study level log OR and the standard error (SE) of the es-timate by constructing univariate random effects (RE) meta-regression models in STATA 12 using themegareg command. A plot of ORs was done against NOS scores to determine if there was a linear relationship between the methodological quality of the studies and their re-sults [16]. We planned to explore publication bias and other potential reporting biases, in those pooled compar-isons with 10 or more studies, using funnel plots. We used the graphical approach described by Peters et al. for assessing dichotomous outcomes with effects mea-sured as odds ratios [17].
Lunnyet al. BMC Neurology2013,13:41 Page 3 of 15
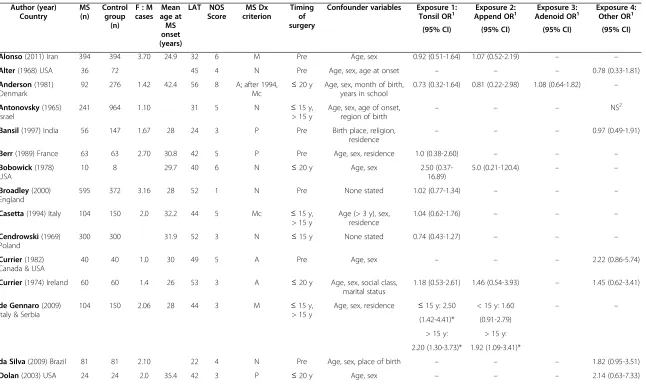
Table 1 Characteristics of included studies
Author (year) Country
MS (n)
Control group
(n) F : M cases
Mean age at MS onset (years)
LAT NOS Score
MS Dx criterion
Timing of surgery
Confounder variables Exposure 1:
Tonsil OR1 Append ORExposure 2:1 Adenoid ORExposure 3:1 Exposure 4:Other OR1
(95% CI) (95% CI) (95% CI) (95% CI)
Alonso(2011) Iran 394 394 3.70 24.9 32 6 M Pre Age, sex 0.92 (0.51-1.64) 1.07 (0.52-2.19) – –
Alter(1968) USA 36 72 45 4 N Pre Age, sex, age at onset – – – 0.78 (0.33-1.81)
Anderson(1981) Denmark
92 276 1.42 42.4 56 8 A; after 1994,
Mc ≤
20 y Age, sex, month of birth, years in school
0.73 (0.32-1.64) 0.81 (0.22-2.98) 1.08 (0.64-1.82) –
Antonovsky(1965) Israel
241 964 1.10 31 5 N ≤15 y,
> 15 y
Age, sex, age of onset,
region of birth – – –
NS2
Bansil(1997) India 56 147 1.67 28 24 3 P Pre Birth place, religion, residence
– – – 0.97 (0.49-1.91)
Berr(1989) France 63 63 2.70 30.8 42 5 P Pre Age, sex, residence 1.0 (0.38-2.60) – – –
Bobowick(1978) USA
10 8 29.7 40 6 N ≤20 y Age, sex 2.50
(0.37-16.89)
5.0 (0.21-120.4) – –
Broadley(2000) England
595 372 3.16 28 52 1 N Pre None stated 1.02 (0.77-1.34) – – –
Casetta(1994) Italy 104 150 2.0 32.2 44 5 Mc ≤15 y, > 15 y
Age (> 3 y), sex, residence
1.04 (0.62-1.76) – – –
Cendrowski(1969) Poland
300 300 31.9 52 3 N ≤15 y None stated 0.74 (0.43-1.27) – – –
Currier(1982) Canada & USA
40 40 1.0 30 49 5 A Pre Age, sex – – – 2.22 (0.86-5.74)
Currier(1974) Ireland 60 60 1.4 26 53 3 A ≤20 y Age, sex, social class, marital status
1.18 (0.53-2.61) 1.46 (0.54-3.93) – 1.45 (0.62-3.41)
de Gennaro(2009) Italy & Serbia
104 150 2.06 28 44 3 M ≤15 y,
> 15 y
Age, sex, residence ≤15 y: 2.50 < 15 y: 1.60 – –
(1.42-4.41)* (0.91-2.79)
> 15 y: > 15 y:
2.20 (1.30-3.73)* 1.92 (1.09-3.41)*
da Silva(2009) Brazil 81 81 2.10 22 4 N Pre Age, sex, place of birth – – – 1.82 (0.95-3.51)
Dolan(2003) USA 24 24 2.0 35.4 42 3 P ≤20 y Age, sex – – – 2.14 (0.63-7.33)
Lunny
et
al.
BMC
Neurology
2013,
13
:41
Page
4
o
f
1
5
http://ww
w.biomedce
ntral.com/1
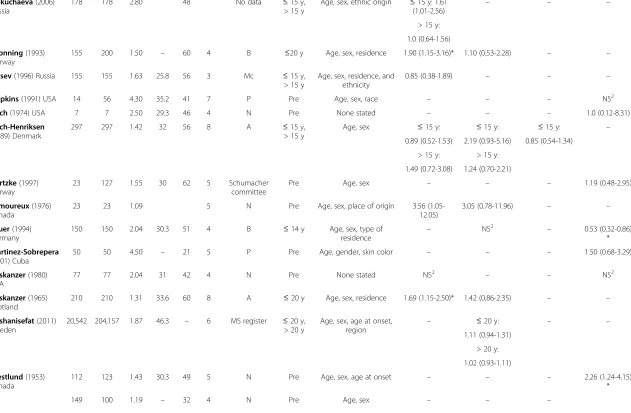
Table 1 Characteristics of included studies(Continued)
Dokuchaeva(2006) Russia
178 178 2.80 48 No data ≤15 y,
> 15 y
Age, sex, ethnic origin ≤15 y: 1.61
(1.01-2.56) – – –
> 15 y:
1.0 (0.64-1.56)
Gronning(1993) Norway
155 200 1.50 – 60 4 B ≤20 y Age, sex, residence 1.90 (1.15-3.16)* 1.10 (0.53-2.28) – –
Gusev(1996) Russia 155 155 1.63 25.8 56 3 Mc ≤15 y, > 15 y
Age, sex, residence, and ethnicity
0.85 (0.38-1.89) – – –
Hopkins(1991) USA 14 56 4.30 35.2 41 7 P Pre Age, sex, race – – – NS2
Koch(1974) USA 7 7 2.50 29.3 46 4 N Pre None stated – – – 1.0 (0.12-8.31)
Koch-Henriksen (1989) Denmark
297 297 1.42 32 56 8 A ≤15 y,
> 15 y
Age, sex ≤15 y: ≤15 y: ≤15 y: –
0.89 (0.52-1.53) 2.19 (0.93-5.16) 0.85 (0.54-1.34)
> 15 y: > 15 y:
1.49 (0.72-3.08) 1.24 (0.70-2.21)
Kurtzke(1997) Norway
23 127 1.55 30 62 5 Schumacher committee
Pre Age, sex – – – 1.19 (0.48-2.95)
Lamoureux(1976) Canada
23 23 1.09 5 N Pre Age, sex, place of origin 3.56 (1.05-12.05)
3.05 (0.78-11.96) – –
Lauer(1994) Germany
150 150 2.04 30.3 51 4 B ≤14 y Age, sex, type of residence
– NS2 – 0.53 (0.32-0.86)
*
Martinez-Sobrepera (2001) Cuba
50 50 4.50 – 21 5 P Pre Age, gender, skin color – – – 1.50 (0.68-3.29)
Poskanzer(1980) USA
77 77 2.04 31 42 4 N Pre None stated NS2
– – NS2
Poskanzer(1965) Scotland
210 210 1.31 33.6 60 8 A ≤20 y Age, sex, residence 1.69 (1.15-2.50)* 1.42 (0.86-2.35) – –
Roshanisefat(2011) Sweden
20,542 204,157 1.87 46.3 – 6 MS register ≤20 y, > 20 y
Age, sex, age at onset,
region – ≤
20 y: – –
1.11 (0.94-1.31)
> 20 y:
1.02 (0.93-1.11)
Westlund(1953) Canada
112 123 1.43 30.3 49 5 N Pre Age, sex, age at onset – – – 2.26 (1.24-4.15)
*
149 100 1.19 – 32 4 N Pre Age, sex – – –
Lunny
et
al.
BMC
Neurology
2013,
13
:41
Page
5
o
f
1
5
http://ww
w.biomedce
ntral.com/1
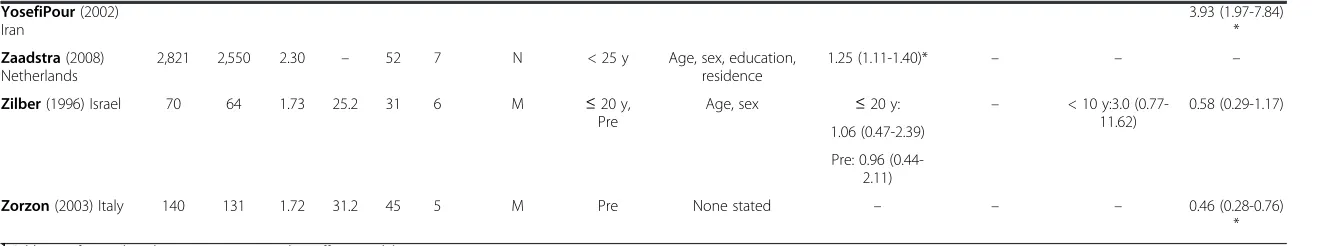
Table 1 Characteristics of included studies(Continued)
YosefiPour(2002) Iran
3.93 (1.97-7.84) *
Zaadstra(2008) Netherlands
2,821 2,550 2.30 – 52 7 N < 25 y Age, sex, education, residence
1.25 (1.11-1.40)* – – –
Zilber(1996) Israel 70 64 1.73 25.2 31 6 M ≤20 y, Pre
Age, sex ≤20 y: – < 10 y:3.0 (0.77-11.62)
0.58 (0.29-1.17)
1.06 (0.47-2.39)
Pre: 0.96 (0.44-2.11)
Zorzon(2003) Italy 140 131 1.72 31.2 45 5 M Pre None stated – – – 0.46 (0.28-0.76)
*
1
Odds ratio for combined surgeries using a random effects model. 2
Reported as not statistically significant, no data provided. * Indicates statistically significant results.
A= Allison & Miller criteria,Append= appendectomy,Adenoid= adenoidectomy,B= Bauer criteria,CI= confidence interval,Dx= diagnosis,LAT= latitude,Mc= McAlpine criteria,M= McDonald criteria,MS= multiple sclerosis,NOS= Newcastle-Ottawa Scale,N= neurologist diagnosed,NS= not significant,OR= odds ratio,P= Poser criteria,Pre: Premorbid, age not specified other than surgery occurring before MS diagnosis, Tonsil= tonsillectomy,Y= years.
Lunny
et
al.
BMC
Neurology
2013,
13
:41
Page
6
o
f
1
5
http://ww
w.biomedce
ntral.com/1
Effect measurement and data synthesis
Meta-analyses were performed using the Cochrane Col-laboration software program Review Manager (Rev Man) Version 5.1 [18]. To estimate the strength of association between surgery exposure variables and risk for MS diagnosis, data were pooled using the inverse variance (IV) approach to calculate the OR and 95% CIs and stat-istical significance was set atp< 0.05. When interpreting results of the forest plots for dichotomous data, the area to the right side of the forest plot graph (> 1) favoured the control group. Studies were weighted based on sam-ple size and the number of events.
Meta-analyses methods were selected based on study heterogeneity and the number of studies included in the analyses. When the I2statistic was greater than 75%, we considered it substantial heterogeneity and pooled the study results using a RE model [19].
Subgroup analysis and investigation of heterogeneity A priori, we planned to explore and address possible clinical heterogeneity as well as to investigate the magni-tude and precision of effects by performing sub-group analyses based on type of surgery (tonsillectomy, ap-pendectomy, adenoidectomy, other surgery), and age at time of surgery (≤20 years of age and those > 20 years of age). Sub-group analyses were also performed on reported association (number of covariates), female to male sex ratio, NOS score, latitude, and age at MS onset.
Sensitivity analysis
We performed sensitivity analyses by examining the re-sults of the meta-analysis under different assumptions and checked for robustness of the observed findings. A priori, the following sensitivity analyses were planned:
1. By limiting included studies in the analyses to those with the highest methodological quality, do the results change?
2. For studies in which the OR was reported as“not
significant”and therefore had to be imputed, do the
results of the pooled analysis change if these are excluded from the results?
Results
Characteristics of included studies
After excluding duplicate studies, we identified 100 indi-vidual studies, of which 75 were potentially relevant. Of these, despite our best attempts to contact primary or corresponding authors, eight studies could not be lo-cated [20-27]; therefore, 67 potentially relevant full text articles were retrieved for closer examination. Of the re-trieved articles, 34 were excluded for the following rea-sons: 18 did not examine surgery as a risk factor [28-45]; six did not have a control group [46-51]; five were
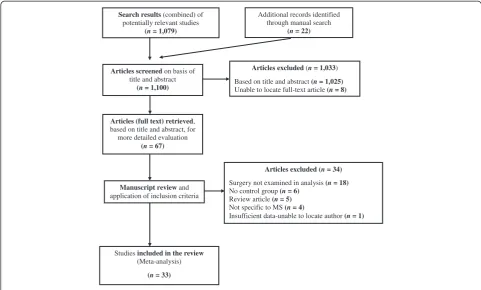
review articles [52-56]; four were not specific to MS [57-60]; and one had insufficient data, and we were un-able to locate study authors [61]. A total of 33 studies were identified which met the inclusion criteria for the systematic review [62-94]. One additional cohort study was found but was not included due to heterogeneity in study design and exposure [95]. Figure 1 outlines the study selection process.
All of the included studies were case–control studies and were published between 1953 and 2011. Seventeen individual studies reported tonsillectomy data [62,64, 67-69,71,73,75,76,78,79,82,84,87,88,92,93], 11 reported appendectomy data [62,64,68,73,75,78,82,84,85,87,89], three reported adenoidectomy data [64,82,93], and 18 reported on other surgeries [63,65,66,70,72-74,77,80, 81,83,85,86,88,90,91,93,94]. The majority of the studies (17 studies) were published in European countries [64,67,69-71,73,75,78,82,83,85,87,89,92-94], followed by nine in North America [63,68,72,77,80,81,84,88,90], four published in the Middle East [62,65,91,93], and lastly one each from India [66], Brazil [74], and Cuba [86].
Exposure risks for MS were reported as ORs in most of the studies while others simply reported whether the exposure risk for MS was “significant” or “not signifi-cant” [65,80,81,85,88]. The ORs ranged from 0.46 to 5.0 depending on the type of surgery reported. Eight inde-pendent studies reported statistically significant results for specific exposures [75,78,85,87,90-92,94], while the remaining 25 did not. See characteristics of included studies in Table 1.
Quality assessment
Included studies were classified according to the NOS with seven studies considered high risk of bias [66,69,71,73,75,77,79]; 16 studies had a medium risk of bias [63,65,67,70,72,74,78,81,83-86,88,90,91,94]; and nine studies had a low risk of bias [62,64,68,80,82,87,89,92, 93]. One study could not be assessed due to lack of in-cluded data [76].
Exposure results
The meta-analysis included data from all 33 studies with 27,373 MS cases and 211,756 controls; there were twice as many females than males included in the studies and the mean age of MS diagnosis was 31 years. See Table 2 for pooled surgery exposure results.
Tonsillectomy
Of the 17 separate studies reporting on tonsillectomy, 12 examined tonsillectomy at age≤20 and 9 examined ton-sillectomy at age > 20, or simply “premorbid”. Pooled analyses displayed statistical heterogeneity hence the es-timates were based on the RE model.
Lunnyet al. BMC Neurology2013,13:41 Page 7 of 15
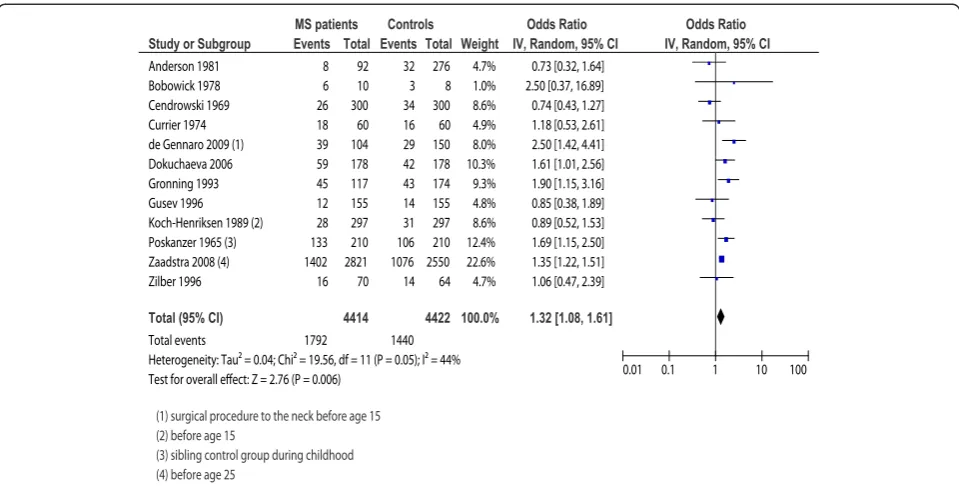
The 12 studies examining tonsillectomy at age≤20 in-cluded 4,414 MS cases and 4,422 controls. The pooled RE model revealed moderate heterogeneity in the sample (I2= 44%;p= 0.05) and a statistically significant relation-ship between tonsillectomy and MS onset (OR = 1.32; 95% CI, 1.08-1.61;p= 0.006). To further explore hetero-geneity, we conducted a sensitivity analysis based on study quality (removing those studies with a NOS score < 6). Although removing the six studies with a NOS score of < 6 provided a more homogenous sample (I2= 12%; p= 0.34) the difference was not significant as the direction and magnitude of the effect did not change
(OR = 1.29; 95% CI, 1.08-1.53; p= 0.005); therefore, we included all 12 studies in the final analysis. Sensitivity analysis based on removing the one study where the OR was imputed did not change the significance nor magni-tude of the effect (OR = 1.27; 95% CI, 1.02-1.58; p= 0.03); therefore, we included all 12 studies in the final analysis. Forest plot results for tonsillectomy expos-ure occurring at≤20 years of age are presented in Figure 2.
The nine studies examining tonsillectomy in pa tients’> 20 years or “premorbid” included 1,801 MS cases and 1,618 controls. The RE model revealed a
Search results(combined) of potentially relevant studies
(n= 1,079)
Articles (full text) retrieved, based on title and abstract, for more detailed evaluation
(n= 67)
Manuscript reviewand application of inclusion criteria
Articles excluded(n = 1,033)
Based on title and abstract (n= 1,025) Unable to locate full-text article (n = 8)
Articles excluded (n= 34)
Surgery not examined in analysis (n= 18) No control group (n= 6)
Review article (n= 5) Not specific to MS (n= 4)
Insufficient data-unable to locate author (n= 1) Articles screenedon basis of
title and abstract (n = 1,100)
Studies included in the review (Meta-analysis)
(n= 33)
Additional records identified through manual search
(n= 22)
Figure 1Flow diagram of study selection.
Table 2 Odds ratios for pooled surgery exposures using a random effects model
Exposure Included
studies (n)
MS case group
(n)
Control group
(n)
Total (n)
Level of heterogeneity
I2(χ2p)
Pooled OR (95% CI)
Test for overall effect
Z (p)
Tonsillectomy≤20 years 12 4,414 4,422 8,836 44%(0.05) 1.32 (1.08-1.61)* 2.76 (0.006)*
Tonsillectomy > 20 years 9 1,801 1,618 3,419 32%(0.16) 1.20 (0.94-1.53) 1.45 (0.15)
Appendectomy≤20 years 7 21,218 205,124 226,342 0%(0.54) 1.16 (1.01-1.34)* 2.06 (0.04)*
Appendectomy > 20 years 5 21,360 205,021 226,381 46%(0.11) 1.26 (0.92-1.72) 1.43 (0.15)
Adenoidectomy≤20 years 3 458 636 1,094 35%(0.21) 1.06 (0.68-1.68) 0.27 (0.79)
Surgery≤20 years 4 485 1,202 1,687 19%(0.30) 0.95 (0.70-1.31) 0.29 (0.77)
Surgery > 20 years 15 1,099 1,371 2,470 71%(0.0001) 1.19 (0.83-1.70) 0.94 (0.35) *
Indicates statistically significant results atp< 0.05.
CI= confidence interval, MS= multiple sclerosis,OR= odds ratio.
Lunnyet al. BMC Neurology2013,13:41 Page 8 of 15
homogeneous sample (I2= 32%; p= 0.16) with no statis-tical difference between the groups (OR = 1.20; 95% CI, 0.94-1.53;p= 0.15). When four studies with a NOS score of < 6 were excluded, the pooled results became more homogeneous (I2= 0%; p= 0.88) but the magnitude and the significance of the results did not change (OR = 1.04; 95% CI, 0.78-1.37; p= 0.85). All nine studies reported exact OR data thus, sensitivity analysis, based on the im-putation of data, was not required and all nine studies were included in the final analysis.
Appendectomy
Eleven separate studies examined appendectomy; nine examined appendectomy in those≤20 years and five ex-amined appendectomy at age > 20, or “premorbid”. Pooled analyses displayed statistical heterogeneity, for that reason the estimates were based on the RE model.
The nine studies examining appendectomy in those≤ 20 years included 21,574 MS cases and 205,480 controls. Moderate heterogeneity (I2= 48%; p= 0.05) of the RE pooled results was demonstrated with no statistical rela-tionship between appendectomy in those≤20 and MS onset (OR = 1.16; 95% CI, 0.87-1.53;p= 0.31).We further conducted sensitivity analysis based on study quality. Al-though removing the five studies with a NOS score of < 6 provided a more homogenous sample (I2= 13%; p= 0.33) the difference was not significant as the magni-tude and precision of the effect did not change (OR = 1.21; 95% CI, 0.87-1.69; p= 0.27). Sensitivity analysis
based on removing two studies where the ORs were im-puted reduced the heterogeneity (I2= 0%; p= 0.54) and changed the significance of the result (OR = 1.16; 95% CI, 1.01-1.34;p= 0.04) thus, we used the reduced, statis-tically significant model in the final analysis.
The five studies examining appendectomy occurring in those patients > 20 years or“premorbid”included 21,360 MS cases and 205,021 controls. The RE model revealed a moderately homogeneous sample (I2= 46%; p= 0.11) with no statistical difference between groups (OR = 1.26; 95% CI, 0.92-1.72; p= 0.15). When studies with a NOS score of < 6 were excluded, the results did not change. All five studies reported exact OR data, consequently, sensitivity analysis based on the imputation of ORs was not required and all five studies were included in the final analysis.
Adenoidectomy
Three studies, involving 458 MS cases and 636 controls, reported on adenoidectomy in patient’s≤20 years. The RE model revealed a homogeneous sample (I2= 35%; p= 0.21) with no statistical difference between groups (OR = 1.06; 95% CI, 0.68-1.68;p= 0.79). All three studies were of high quality and all reported exact OR data, as a result, sensitivity analyses were not required.
Surgery
Eighteen discrete studies examined“other surgery”; four examined surgery occurring in those≤20 years and 15
Study or Subgroup
Anderson 1981 Bobowick 1978 Cendrowski 1969 Currier 1974 de Gennaro 2009 (1) Dokuchaeva 2006 Gronning 1993 Gusev 1996 Koch-Henriksen 1989 (2) Poskanzer 1965 (3) Zaadstra 2008 (4) Zilber 1996
Total (95% CI)
Total events
Heterogeneity: Tau² = 0.04; Chi² = 19.56, df = 11 (P = 0.05); I² = 44% Test for overall effect: Z = 2.76 (P = 0.006)
Events 8 6 26 18 39 59 45 12 28 133 1402 16 1792 Total 92 10 300 60 104 178 117 155 297 210 2821 70 4414 Events 32 3 34 16 29 42 43 14 31 106 1076 14 1440 Total 276 8 300 60 150 178 174 155 297 210 2550 64 4422 Weight 4.7% 1.0% 8.6% 4.9% 8.0% 10.3% 9.3% 4.8% 8.6% 12.4% 22.6% 4.7% 100.0%
IV, Random, 95% CI
0.73 [0.32, 1.64] 2.50 [0.37, 16.89] 0.74 [0.43, 1.27] 1.18 [0.53, 2.61] 2.50 [1.42, 4.41] 1.61 [1.01, 2.56] 1.90 [1.15, 3.16] 0.85 [0.38, 1.89] 0.89 [0.52, 1.53] 1.69 [1.15, 2.50] 1.35 [1.22, 1.51] 1.06 [0.47, 2.39]
1.32 [1.08, 1.61]
MS patients Controls Odds Ratio
(1) surgical procedure to the neck before age 15 (2) before age 15
(3) sibling control group during childhood (4) before age 25
Odds Ratio IV, Random, 95% CI
0.01 0.1 1 10 100
Figure 2Forest plot for tonsillectomy exposure occurring at≤20 years of age.Forest plot of 12 included studies reporting tonsillectomy in those≤20 years of age in cases with multiple sclerosis and controls.Horizontal lines, 95% CIs of each study;squares, odds ratios of each individual study (the size represents the weight that the study was given in the meta-analysis);diamond, the pooled summary estimate;solid vertical line, null value. OR > one favoured the control group.
Lunnyet al. BMC Neurology2013,13:41 Page 9 of 15
examined surgery in patients > 20, or “premorbid”. Pooled analyses displayed statistical heterogeneity thus the estimates were based on the RE model.
The four studies reporting on other surgery occurring in subject’s≤20 years included 485 MS cases and 1,202 controls. The RE model revealed a homogeneous sample (I2= 19%;p= 0.30) with no statistical difference between groups (OR = 0.95; 95% CI, 0.70-1.31;p= 0.77). Sensitiv-ity analysis, based on study qualSensitiv-ity, was not done as all but one of the four studies had a NOS score of < 6. Fur-ther sensitivity analysis, excluding those studies that did not report a specific OR, did not significantly change the results (OR = 1.01; 95% CI, 0.28-3.57;p= 0.99).
The 15 studies examining other surgery in pa-tients > 20, or“premorbid” included 1,099 MS cases and 1,371 controls. Significant heterogeneity (I2= 71%; p< 0.0001) of the RE pooled results was demonstrated; regardless, there were no statistical differences between groups (OR = 1.19; 95% CI, 0.83-1.70;p= 0.35). Sensitiv-ity analysis, based on study qualSensitiv-ity, was not done as all but two of the 15 included studies had a NOS score of < 6. Further sensitivity analysis, excluding those studies that did not report a specific OR, did not signifi-cantly change the results (OR = 1.32; 95% CI, 0.92-1.91; p= 0.14).
Examining bias
To visually assess for heterogeneity, we plotted the ORs of high quality versus low quality studies. The plot showed no distinct linear relationship between methodo-logical quality of studies (NOS score) and ORs, with no obvious clustering, indicating a low risk of bias.
For the tonsillectomy exposure (≤ 20 years), the test for publication bias was not statistically significant (p= 0.94), with a symmetrical funnel plot indicating a low risk for publication bias [96]. For the surgery pre-morbid exposure, the test for publication bias was also not statistically significant (p= 0.62); although, the plot was more asymmetrical indicating the potential for pub-lication bias. Given the small number of studies included in the other exposures (< 10 studies), the interpretation of funnel plots must be undertaken with caution and are therefore not included here.
Meta-regression
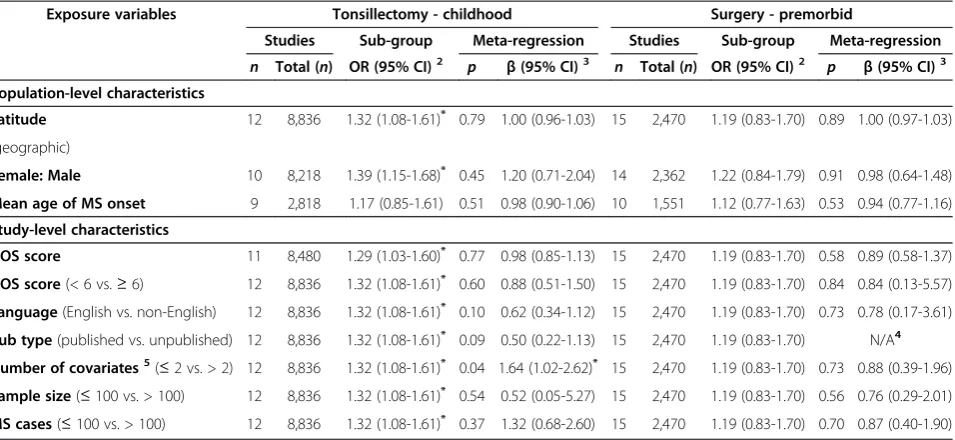
Results from the meta- regression are presented in Table 3. Meta-regression was performed on the sub-groups including at least 10 studies, namely tonsillec-tomy at age≤20 and premorbid “surgery”. None of the variables entered into the regression analysis, for the sur-gery premorbid exposure, reached statistical significance therefore not significantly influencing the effect sizes. For the tonsillectomy at age≤20, only one of the vari-ables, the number of covariates adjusted for (≤2 vs. > 2),
reached statistical significance (β= 1.64; 95% CI, 1.02-2.62). That is, the effect size or risk for MS diagnosis in-creased as the number of covariates that were adjusted for (in the individual included studies) increased. This further indicates limited residual heterogeneity after controlling for the influence of latitude, female to male sex ratio, mean age of MS onset, NOS score, language, publication status, and sample size. Although not a sta-tistically significant finding (p= 0.45), the tonsillectomy exposure, in those≤20 years, increased as the female to male ratio increased.
Discussion
Overall, the evidence presented in this review supports a relationship between tonsillectomy and appendectomy in childhood and the subsequent risk of MS. More spe-cifically, those with tonsillectomy or appendectomy at≤ 20 years of age were approximately 30% more likely to be diagnosed with MS in comparison to similar patients who did not have a tonsillectomy or appendectomy at≤ 20 years of age. The findings of this review do not sup-port an association between tonsillectomy or appendec-tomy occurring in those > 20 years, adenoidecappendec-tomy, and “other surgery”occurring at any age and the subsequent risk for the onset of MS. Although we did not find an association between these variables and risk for MS, it is important to note that due to the multi-factorial and heterogeneous nature of MS, surgery may indeed pose a slight risk for certain individuals.
Several theories linking tonsillectomy to MS risk have been postulated over the years. Meurman and Wising [39] proposed tonsillectecomy as a possible risk factor for MS in that an upper respiratory tract infection may trigger MS or that a locally deficient immune system may facilitate the invasion of an etiologically relevant, in-fectious agents. Tonsillectomy may leave sufficient lymphoid tissue adjacent to the central nervous system to instigate the exaggerated immune response seen in MS [39,69,87]. Poskanzer (1965) was particulary inter-ested in examining tonsillectomy and MS risk at it predisposes to the development of neurological compli-cations in poliomyelitis, another infection that is much more widespread than is suggested by its neurological manifestations [87,97-99].
Of particular interest is the association between recur-rent tonsillitis and EBV infection and reactivation [100]. A recent meta-analysis of case–control and cohort stud-ies found a statistically significant combined relative risk (RR) for MS in those with a past history of infectious mononucleosis (RR = 2.17; 95% CI, 1.97-2.39) [101]. Fur-thermore, others have found statistically significant ele-vated levels of antibody to some common infectious agents, other than EBV, in children and adults with MS compared to controls [92,102-104]. Krone and collegues
Lunnyet al. BMC Neurology2013,13:41 Page 10 of 15
[104] postulate that these findings reflect a dysregulation of immune function as a consequence of the develop-ment of the disease. They assert that immune dysregulation in MS is likely to be an early event preced-ing the onset of MS disease by many years or even de-cades [14,105,106]. It is likely that the elevated antibody concentrations do not directly cause MS but rather re-flect a shift in patterns of immune reactivity away from protection towards enhancement of the risk of disease. These authors suggest that studies on MS-associated in-fectious agents could lead to the identification of specific antigenic determinants involved in the generation and maintenance of immune dysregulation.
There seems to be similarities between MS and appen-dicitis, which often results in appendectomy. More re-cently, scientists have recognized the role of the appendix as part of the body’s immune system, as it con-tains white blood cells and acts as a reservoir for“good” bacteria for the gut [107]. The role of the appendix is to contain “good bacteria”; when bacteria in the intestines die or are purged from dysentery or cholera, the “good bacteria” are replaced from the stores in the ap-pendix. As a result, appendicitis (inflammation of the appendix) may indicate inadequate immunological func-tion [84,89,108]; thereby providing an associafunc-tion of both EBV and appendicitis (resulting in appendectomy) with MS [109-111]. Immunological reaction relevant to appendicitis may indicate MS risk as activation of
peripheral blood mononuclear cells, including those causing inflammatory destruction of myelin, which occurs in lymphoid tissue [89,108]. Appendicitis is a marker of immune characteristics influencing immune-mediated disease risk, as it has a direct role in the devel-opment of ulcerative colitis [89,112,113]. Further, CD8+ T-cell deficiency is a feature of both ulcerative colitis and MS [114].
There seems to be other possible similarities between MS and appendicitis. First, appendicitis and MS are autoimmune diseases. Both appendicitis and MS are dis-eases associated with industrialized countries but not de-veloping countries [115,116]. MS is a disease largely prevalent in Europe, North America, Australia, and New Zealand, but is rare among Asians and Africans [116]. Lastly, several epidemiological and experimental studies support the hygiene hypothesis in both appendicitis [115,117] and MS [109,118], which postulates that im-munopathology may be an unanticipated consequence of advances in sanitation and public health [109,118,119].
Quality of the evidence
One of the main challenges of the review related to the varying definitions of “surgery” in the included studies. Some studies included only tonsillectomy or appendec-tomy, and some included all surgeries. More import-antly, the number of surgeries in individual patients (prior to MS onset) would have been a significant Table 3 Sensitivity analyses and stratified meta-regression for assessing heterogeneity among case–control studies looking at the exposures tonsillectomy in childhood and“surgery”premorbid1
Exposure variables Tonsillectomy - childhood Surgery - premorbid
Studies Sub-group Meta-regression Studies Sub-group Meta-regression
n Total (n) OR (95% CI)2 p β(95% CI)3 n Total (n) OR (95% CI)2 p β(95% CI)3
Population-level characteristics
Latitude 12 8,836 1.32 (1.08-1.61)* 0.79 1.00 (0.96-1.03) 15 2,470 1.19 (0.83-1.70) 0.89 1.00 (0.97-1.03)
(geographic)
Female: Male 10 8,218 1.39 (1.15-1.68)* 0.45 1.20 (0.71-2.04) 14 2,362 1.22 (0.84-1.79) 0.91 0.98 (0.64-1.48)
Mean age of MS onset 9 2,818 1.17 (0.85-1.61) 0.51 0.98 (0.90-1.06) 10 1,551 1.12 (0.77-1.63) 0.53 0.94 (0.77-1.16) Study-level characteristics
NOS score 11 8,480 1.29 (1.03-1.60)* 0.77 0.98 (0.85-1.13) 15 2,470 1.19 (0.83-1.70) 0.58 0.89 (0.58-1.37)
NOS score(< 6 vs.≥6) 12 8,836 1.32 (1.08-1.61)* 0.60 0.88 (0.51-1.50) 15 2,470 1.19 (0.83-1.70) 0.84 0.84 (0.13-5.57)
Language(English vs. non-English) 12 8,836 1.32 (1.08-1.61)* 0.10 0.62 (0.34-1.12) 15 2,470 1.19 (0.83-1.70) 0.73 0.78 (0.17-3.61)
Pub type(published vs. unpublished) 12 8,836 1.32 (1.08-1.61)* 0.09 0.50 (0.22-1.13) 15 2,470 1.19 (0.83-1.70) N/A4
Number of covariates5(≤2 vs. > 2) 12 8,836 1.32 (1.08-1.61)* 0.04 1.64 (1.02-2.62)* 15 2,470 1.19 (0.83-1.70) 0.73 0.88 (0.39-1.96)
Sample size(≤100 vs. > 100) 12 8,836 1.32 (1.08-1.61)* 0.54 0.52 (0.05-5.27) 15 2,470 1.19 (0.83-1.70) 0.56 0.76 (0.29-2.01)
MS cases(≤100 vs. > 100) 12 8,836 1.32 (1.08-1.61)* 0.37 1.32 (0.68-2.60) 15 2,470 1.19 (0.83-1.70) 0.70 0.87 (0.40-1.90) 1
All analyses weighted by sample size. 2
OR (95%CI) were calculated using the random effects model in RevMan. 3
β(95%CI) were calculated using the study level log OR and the SE of the estimate (calculated in RevMan) by univariate random effects meta-regression in STATA 12 using the megareg command.
4
All studies were published–analysis not warranted. 5
Number of potentially confounding variables adjusted for in individual studies.
CI= confidence interval, MS= multiple sclerosis, NOS= Newcastle-Ottawa Scale,OR= odds ratio,Pub= Publication,SE= Standard error.
Lunnyet al. BMC Neurology2013,13:41 Page 11 of 15
variable to assess; however, none of the included studies reported this as a potential risk factor. Another potential limitation pertained to the fact that, with the exception of a single study [89], the majority of studies reporting on appendectomy did not indicate the reason for sur-gery; therefore, we had to assume that appendectomy was as a result of appendicitis (infection / inflammation). It must be emphasized that characterizing appendec-tomy, by underlying diagnosis, may be important when assessing true MS risk.
Ideally, in case–control studies, cases should be represen-tative of the entire population and be identified by inde-pendent MS diagnostic criteria. Controls should be randomly selected within the community of the residing representative MS cases. Only nine case–control studies ex-amined in this review selected controls from the community [64,65,67,79,80,82,88,90,93]. To further control for bias, con-trol subjects should have no prior history of disease, representing healthy individuals of the same socio-economic class.
Age at disease onset is very important in MS etiologic studies and ought to have been used as a matching variable to potentially control for bias. The age at disease diagnosis is used to allow researchers a timeframe to assess for potential exposure to associated agents. Ideally, case–control matching ought to be done for universal variables such as age, sex, and age at MS diagnosis. Other matching variables to be considered in MS studies include residence and place of birth. Interviewer blinding, another means of controlling for bias, was done by only one study [94].
Potential bias in the review process
The two review authors who assessed the methodo-logical quality were not blinded for authors, journal, or institution. The potential bias caused by the non-blinded quality assessment was expected to be low as neither review author had a conflict of interest. Spe-cifically, the review authors did not have any (finan-cial or other) interest in positive or negative results. Furthermore, we searched the grey literature exten-sively for eligible studies, presented the search strat-egy and the inclusion criteria list, and all of the final results of the assessment, so that readers can make their own determinations of the results and our conclusions.
There is a possibility of publication bias or study selec-tion bias in this meta-analysis. For example, by missing unpublished negative studies we may be over-estimating the association between prior surgery and the risk for developing MS. However, a comprehensive search of the published literature for potentially relevant studies was conducted, using a systematic strategy to avoid bias. This was followed by attempts to contact corresponding
and first authors, as we recognize that unpublished or negative studies may exist.
Conclusion
This result of this meta-analysis suggests a statistically significant and clinically important increased risk for de-veloping MS in those with tonsillectomy and appendec-tomy at≤20 years of age. Despite this significant finding, this in no way suggests or demonstrates causality, in that epidemiological studies can only provide etiological clues at best. More rigorous prospective studies, with high statistical power, are needed to prove an effect. Future prospective studies, that take into consideration the long latency period between the age of putative biological on-set and clinical onon-set of MS, are needed in order to definitively rule out any links between tonsillectomy (or other surgeries) and MS.
Competing interests
The authors have no financial, personal, or any other kind of competing interests with this paper.
Authors’contributions
Study concept and design: CL, JAK-S, and SF; acquisition and preparation of data: CL; analysis and interpretation of the data: CL, JAK-S, and SF; risk of bias assessment: CL and JAK-S; first draft of the manuscript: CL. All authors critically reviewed the manuscript and approved the final version of the manuscript to be published.
Authors’note
We would be grateful if readers would send us reprints of any published or unpublished studies on multiple sclerosis and surgeries that have not been included in this paper, as well as any additional data missed from the included studies.
Funding
This study was supported by the Academic Research Fund of Athabasca University.
Received: 24 October 2012 Accepted: 22 April 2013 Published: 6 May 2013
References
1. Compston A, Coles A:Multiple sclerosis.Lancet2002,359(9313):1221–1231. 2. Whetten-Goldstein K, Sloan FA, Goldstein LB, Kulas ED:A comprehensive
assessment of the cost of multiple sclerosis in the United States. Mult Scler1998,4(5):419–425.
3. Poser CM, Paty DW, Scheinberg L, McDonald WI, Davis FA, Ebers GC, Johnson KP, Sibley WA, Silberberg DH, Tourtellotte WW:New diagnostic criteria for multiple sclerosis: guidelines for research protocols.Ann Neurol1983,13(3):227–231.
4. McDonald WI, Compston A, Edan G, Goodkin D, Hartung HP, Lublin FD, McFarland HF, Paty DW, Polman CH, Reingold SC, Sandberg-Wollheim M, Sibley W, Thompson A, van den Noort S, Weinshenker BY, Wolinsky JS:
Recommended diagnostic criteria for multiple sclerosis: guidelines from the International Panel on the diagnosis of multiple sclerosis.Ann Neurol
2001,50(1):121–127.
5. Banwell B, Bar-Or A, Arnold DL, Sadovnick D, Narayanan S, McGowan M, O'Mahony J, Magalhaes S, Hanwell H, Vieth R, Tellier R, Vincent T, Disanto G, Ebers G, Wambera K, Connolly MB, Yager J, Mah JK, Booth F, Sebire G, Callen D, Meaney B, Dilenge M-E, Lortie A, Pohl D, Doja A, Venketaswaran S, Levin S, MacDonald EA, Meek D,et al:Clinical, environmental, and genetic determinants of multiple sclerosis in children with acute demyelination: a prospective national cohort study.Lancet Neurol2011,10(5):436–445.
Lunnyet al. BMC Neurology2013,13:41 Page 12 of 15
6. Handel AE, Handunnetthi L, Giovannoni G, Ebers GC, Ramagopalan SV:
Genetic and environmental factors and the distribution of multiple sclerosis in Europe.Eur J Neurol2010,17(9):1210–1214.
7. Tselis A:Epstein–Barr virus cause of multiple sclerosis.Curr Opin Rheumatol
2012,24(4):424–428. 410.1097/BOR.1090b1013e3283542cf3283548. 8. Disanto G, Morahan J, Ramagopalan S:Multiple sclerosis: risk factors and
their interactions.CNS Neurol Disord Drug Targets2012,11(5):545–555. 9. Simpson S Jr, Blizzard L, Otahal P, Van der Mei I, Taylor B:Latitude is
significantly associated with the prevalence of multiple sclerosis: a meta-analysis.J Neurol Neurosurg Psychiatry2011,82(10):1132–1141. 10. Ascherio A, Munger KL:Environmental risk factors for multiple sclerosis.
Part I: the role of infection.Ann Neurol2007,61(4):288–299. 11. Higgins J, Green S (Eds):Cochrane Handbook for Systematic Reviews of
Interventions Version 5.0.2 [updated September 2009]; 2009.
12. Stroup DF, Berlin JA, Morton SC, Olkin I, Williamson GD, Rennie D, Moher D, Becker BJ, Sipe TA, Thacker SB:Meta-analysis of observational studies in epidemiology: a proposal for reporting. Meta-analysis Of Observational Studies in Epidemiology (MOOSE) group.JAMA2000,283(15):2008–2012.
13. The Newcastle-Ottawa Scale (NOS) for assessing the quality of nonrandomized studies in meta-analyses.[http://www.ohri.ca/programs/clinical_epidemiology/ oxford.htm].
14. Thacker EL, Mirzaei F, Ascherio A:Infectious mononucleosis and risk for multiple sclerosis: a meta-analysis.Ann Neurol2006,59(3):499–503. 15. Deeks JJ, Higgins JPT, Altman DG:Chapter 9: Analysing data and
undertaking meta-analysis. InCochrane Handbook for Systematic Reviews of Interventions Version 510 (updated March 2011).Edited by Higgins J, Green S, The Cochrane Collaboration; 2011.
16. Ernst E, Pittler MH:Re-analysis of previous meta-analysis of clinical trials of homeopathy.J Clin Epidemiol2000,53(11):1188.
17. Peters JL, Sutton AJ, Jones DR, Abrams KR, Rushton L:Comparison of two methods to detect publication bias in meta-analysis.JAMA2006,
295(6):676–680.
18. Review Manager (RevMan) [Computer program]: 51st editionCopenhagen: The Nordic Cochrane Centre, The Cochrane Collaboration; 2011. 19. Schünemann HJ, Oxman AD, Vist GE, Higgins JPT, Deeks JJ, Glasziou P,
Guyatt GH:Chapter 12: Interpreting results and drawing conclusions. In
Cochrane Handbook for Systematic Reviews of Interventions Version 501.
Edited by Higgins J, Green S, The Cochrane Collaboration; 2008. 20. Becker H, Chochon F, de Toffol B, Defebvre L, Leger JM, Pierrot-Deseilligny
C, Sellal F:[Report of the 55th meeting of the American Academy of Neurology. Honolulu, March 29-April 6, 2003].Rev Neurol (Paris)2003,
159(4):470–486.
21. De Portugal AJ, Fereres JS:[Considerations on the relationship of injury and multiple sclerosis].Med Clin (Barc)1965,44(4):252–255.
22. Goncharova ZA, Baliazin VA:[Risk factors of multiple sclerosis
development in the population of the Rostov region].Zh Nevrol Psikhiatr Im S S Korsakova2009,109(7 Suppl 2):10–15.
23. Kurtzke JF, Hyllested K:Multiple sclerosis in the Faroe Islands and the lack of protection by exposure in infancy.Neuroepidemiology1992,11(2):90–99. 24. Levine NS, Atkins A, McKeel DW Jr, Peck SD, Pruitt BA Jr:Spinal cord
injury following electrical accidents: case reports.J Trauma1975,
15(5):459–463.
25. Popescu D, Popescu VG:[Risk factors in multiple sclerosis: epidemiological studies in the Arges region].Rev Med Interna Neurol Psihiatr Neurochir Dermatovenerol Neurol Psihiatr Neurochir1981,26(1):23–31. 26. Beziehungen W:Zwischen erkrankkungen ins Kindesalter und
multiple-sklerose-erkrankung.Schweiz Arch Neurol Neurchir Psychiatr
1970,106(2):311–317.
27. Delilović-VranićJ, Tiric-Campara M, Subasic N:Newly discovered MS cases. 12th Congress of the European Federation of Neurological Societies. 2008 Annual Meeting; 2008. August 23–26.
28. Beltran I, Molto-Jorda JM, Diaz-Marin C, Martin R, Matias-Guiu J:[Analytical epidemiological study of multiple sclerosis in Alcoi].Rev Neurol1998,
26(149):67–69.
29. Benedikz J, Magnusson H, Guthmundsson G:Multiple sclerosis in Iceland, with observations on the alleged epidemic in the Faroe Islands.Ann Neurol1994,36(Suppl 2):S175–179.
30. Boiko A, Deomina T, Favorova O, Gusev E, Sudomoina M, Turetskaya R:Epidemiology of multiple sclerosis in Russia and other countries of the former Soviet Union: investigations of
environmental and genetic factors.Acta Neurol Scand Suppl1995,
161:71–76.
31. Di Legge S, Piattella MC, Pozzilli C, Pantano P, Caramia F, Pestalozza IF, Paolillo A, Lenzi GL:Longitudinal evaluation of depression and anxiety in patients with clinically isolated syndrome at high risk of developing early multiple sclerosis.Mult Scler2003,9(3):302–306.
32. Frutos Alegria MT, Beltran-Blasco I, Quilez-Iborra C, Molto-Jorda J, Diaz-Marin C, Matias-Guiu J:[The epidemiology of multiples sclerosis in Alcoi. Analytical data].Rev Neurol2002,34(9):813–816.
33. Gusev EI, Boiko AN, Demina TL, Sudomoina MA, Alekseev AP, Boldyreva MN, Trofimov D, Favorova OO:[The risk factors for the development of multiple sclerosis in the Moscow population. II. The combination of exogenous and hereditary factors].Zh Nevrol Psikhiatr Im S S Korsakova
1999,99(6):47–52.
34. Gusev EI, Boiko AN, Smirnova NF, Demina TL:[Risk factors of multiple sclerosis in Moscow population. I. Exogenous risk factors].Zh Nevrol Psikhiatr Im S S Korsakova1999,99(5):32–40.
35. Gusev EI, Zavalishin IA, Boiko AN, Khoroshilova NL, Iakovlev AP:
[Epidemiological characteristics of multiple sclerosis in Russia].Zh Nevrol Psikhiatr Im S S Korsakova2002,Suppl:3–6.
36. Kahana E, Zilber N, Abramson JH, Biton V, Leibowitz Y, Abramsky O:
Multiple sclerosis: genetic versus environmental aetiology: epidemiology in Israel updated.J Neurol1994,241(5):341–346.
37. Karnaukh VN:[Epidemiology of multiple sclerosis in Amur region].Zh Nevrol Psikhiatr Im S S Korsakova2009,109(8):59–62.
38. Li J, Johansen C, Bronnum-Hansen H, Stenager E, Koch-Henriksen N, Olsen J:
The risk of multiple sclerosis in bereaved parents: a nationwide cohort study in Denmark.Neurology2004,62(5):726–729.
39. Meurman L, Wising P:[Multiple sclerosis, tonsillectomy, and herpes zoster varicellosus].Lakartidningen1966,63(14):1318–1319.
40. Poser CM:The multiple sclerosis trait and the development of multiple sclerosis: genetic vulnerability and environmental effect.Clin Neurol Neurosurg2006,108(3):227–233.
41. Souberbielle BE, Martin-Mondiere C, O'Brien ME, Carydakis C, Cesaro P, Degos JD:A case–control epidemiological study of MS in the Paris area with particular reference to past disease history and profession.Acta Neurol Scand1990,82(5):303–310.
42. Spitzer C, Bouchain M, Winkler LY, Wingenfeld K, Gold SM, Grabe HJ, Barnow S, Otte C, Heesen C:Childhood trauma in multiple sclerosis: a case–control study.Psychosom Med2012,74(3):312–318.
43. Warren S, Cockerill R, Warren KG:Risk factors by onset age in multiple sclerosis.Neuroepidemiology1991,10(1):9–17.
44. Weilbach FX, Hartung HP:[Physical trauma and multiple sclerosis]. Nervenarzt1997,68(12):940–944.
45. Bangsi D, Ghadirian P, Ducic S, Morisset R, Ciccocioppo S, McMullen E, Krewski D:Dental amalgam and multiple sclerosis:
a case–control study in Montreal, Canada.Int J Epidemiol1998,
27(4):667–671.
46. Adams DK, Sutherland JM, Fletcher WB:Early clinical manifestations of disseminated sclerosis.BMJ1950,2(4676):431–436.
47. Hollander E:Trauma, multiple sclerosis, delayed sleep phase disorder, subjective experiences, and duration of illness in GAD.CNS Spectr2008,
13(5):361–362.
48. Horton AM Jr, Siegel E:Comparison of multiple sclerosis and head trauma patients: a neuropsychological pilot study.Int J Neurosci1990,
53(2–4):213–215.
49. Mutlu N:Multiple sclerosis in Turkey; etiologic and symptomatologic study of four hundred ten cases.AMA Arch Neurol Psychiatry1954,
71(4):511–516.
50. Selcen D, Anlar B, Renda Y:Multiple sclerosis in childhood: report of 16 cases.Eur Neurol1996,36(2):79–84.
51. Stazio A, Paddison RM, Kurland LT:Multiple sclerosis in New Orleans, Louisiana, and Winnipeg, Manitoba, Canada: follow-up of a previous survey in New Orleans, and comparison between the patient populations in the two communities.J Chronic Dis1967,
20(5):311–332.
52. Kranz JM, Kurland LT, Schuman LM, Layton D:Multiple sclerosis in Olmsted and Mower counties, Minnesota.Neuroepidemiology1983,2(3–4):106–118. 53. Lauer K:Environmental associations with the risk of multiple sclerosis:
the contribution of ecological studies.Acta Neurol Scand Suppl1995,
161:77–88.
Lunnyet al. BMC Neurology2013,13:41 Page 13 of 15
54. Lauer K, Firnhaber W:Prognostic criteria in an epidemiological group of patients with multiple sclerosis: an exploratory study.J Neurol1992,
239(2):93–97.
55. Mellor A:Case–control study to collect medical and epidemiological data and blood samples for research into the causes of multiple sclerosis and selected demyelinating diseases. Waltham, MA: Accelerated Cure Project for MS; 2006:1–18.
56. Visscher BR, Clark VA, Detels R, Malmgren RM, Valdiviezo NL, Dudley JP:Two populations with multiple sclerosis. Clinical and demographic characteristics.J Neurol1981,225(4):237–249. 57. Alonso A, Hernan MA, Ascherio A:Allergy, family history of autoimmune diseases, and the risk of multiple sclerosis. Acta Neurol Scand2008,117(1):15–20.
58. Antonovsky A, Leibowitz U, Medalie JM, Smith HA, Halpern L, Alter M:Reappraisal of possible etiologic factors in multiple sclerosis. Am J Public Health Nations Health1968,58(5):836–848.
59. Brain R, Wilkinson M:The association of cervical spondylosis and disseminated sclerosis.Brain1957,80(4):456–478.
60. Conradi S, Malzahn U, Schroter F, Paul F, Quill S, Spruth E, Harms L, Then Bergh F, Ditzenbach A, Georgi T, Heuschmann P, Rosche B:
Environmental factors in early childhood are associated with multiple sclerosis: a case–control study.BMC Neurol2011,11:123. 61. The Coordinating Center and the Neurological Centers of the
Cooperative Group:Cooperative Italian study on multiple sclerosis and risk factors: a case–control study.Ital J Neurol Sci1987,
Suppl 6:17–20.
62. Alonso A, Cook SD, Maghzi AH, Divani AA:A case–control study of risk factors for multiple sclerosis in Iran.Mult Scler2011,17(5):550–555. 63. Alter M, Speer J:Clinical evaluation of possible etiologic factors in
multiple sclerosis.Neurology1968,18(2):109–116.
64. Andersen E, Isager H, Hyllested K:Risk factors in multiple sclerosis: tuberculin reactivity, age at measles infection, tonsillectomy and appendectomy.Acta Neurol Scand1981,63(2):131–135.
65. Antonovsky A, Leibowitz U, Smith HA, Medalie JM, Balogh M, Kats R, Halpern L, Alter M:Epidemiologic study of multiple sclerosis in Israel. An overall review of methods and findings.Arch Neurol1965,13:183–193. 66. Bansil S, Singhal BS, Ahuja GK, Riise T, Ladiwala U, Behari M, Cook SD:
Multiple sclerosis in India: a case–control study of environmental exposures.Acta Neurol Scand1997,95(2):90–95.
67. Berr C, Puel J, Clanet M, Ruidavets JB, Mas JL, Alperovitch A:Risk factors in multiple sclerosis: a population-based case–control study in
Hautes-Pyrenees, France.Acta Neurol Scand1989,80(1):46–50. 68. Bobowick AR, Kurtzke JF, Brody JA, Hrubec Z, Gillespie M:Twin study of
multiple sclerosis: an epidemiologic inquiry.Neurology1978,
28(10):978–987.
69. Broadley SA, Deans J, Chataway SJ, Sawcer SJ, Compston DA:
Multiple sclerosis and tonsillectomy: no evidence for an influence on the development of disease or clinical phenotype.
Mult Scler2000,6(2):121–123.
70. Casetta I, Granieri E, Malagu S, Tola MR, Paolino E, Caniatti LM, Govoni V, Monetti VC, Fainardi E:Environmental risk factors and multiple sclerosis: a community-based, case–control study in the province of Ferrara, Italy.Neuroepidemiology1994,13(3):120–128. 71. Cendrowski W, Wender M, Dominik W, Flejsierowicz Z, Owsianowski
M, Popiel M:Epidemiological study of multiple sclerosis in western Poland.Eur Neurol1969,2(2):90–108.
72. Currier RD, Eldridge R:Possible risk factors in multiple sclerosis as found in a national twin study.Arch Neurol1982,39(3):140–144.
73. Currier RD, Martin EA, Woosley PC:Prior events in multiple sclerosis.Neurology1974,24(8):748–754.
74. da Silva KR, Alvarenga RM, Fernandez YFO, Alvarenga H, Thuler LC:
Potential risk factors for multiple sclerosis in Rio de Janeiro: a case–control study.Arq Neuropsiquiatr2009,67(2A):229–234. 75. De Gennaro RE, Ragazzi M, Caniatti E, Cesnik P, Fazio V, Simioni V,
Govoni I, Casetta E, Granieri E:Environmental risk factors in multiple sclerosis. Different exposure in 3 genetically distinct populations with analytical approach.Padova, Palazzo della Fiera: XL Congresso Società Italiana di Neurologia; 2009.
76. Dokuchaeva NN, Boiko AN:[Clinical and epidemiological study of multiple sclerosis in Volgograd city].Zh Nevrol Psikhiatr Im S S Korsakova2006,
Spec No 3:4–10.
77. Dolan R:Epidemiological Review of the Cluster of Multiple Sclerosis within East Boston and Winthrop, MA: Possible Roles of Childhood Nutrition and Xenobiotics Exposure as Causative Factors for the Disease.http://www.areco.org/ms.pdf; 2003.
78. Gronning M, Riise T, Kvale G, Albrektsen G, Midgard R, Nyland H:
Infections in childhood and adolescence in multiple sclerosis. A case–control study.Neuroepidemiology1993,12(2):61–69. 79. Gusev E, Boiko A, Lauer K, Riise T, Deomina T:Environmental risk
factors in MS: a case–control study in Moscow.Acta Neurol Scand
1996,94(6):386–394.
80. Hopkins RS, Indian RW, Pinnow E, Conomy J:Multiple sclerosis in Galion, Ohio: prevalence and results of a case–control study. Neuroepidemiology1991,10(4):192–199.
81. Koch MJ, Reed D, Stern R, Brody JA:Multiple sclerosis. A cluster in a small Northwestern United States community.JAMA1974,228(12):1555–1557. 82. Koch-Henriksen N:An epidemiological study of multiple sclerosis. Familial aggregation social determinants, and exogenic factors. Acta Neurol Scand Suppl1989,124:1–123.
83. Kurtzke JF, Hyllested K, Arbuckle JD, Bronnum-Hansen H, Wallin MT, Heltberg A, Jacobsen H, Olsen A, Eriksen LS:Multiple sclerosis in the Faroe Islands. Results of a case control questionnaire with multiple controls.Acta Neurol Scand1997,96(3):149–157. 84. Lamoureux G, Giard N, Jolicoeur R, Toughlian V, Desrosiers M:
Immunological features in multiple sclerosis.BMJ1976,1(6003): 183–186.
85. Lauer K, Firnhaber W:Descriptive and analytical epidemiological data on multiple sclerosis from a long-term study in southern Hesse, Germany. In
Multiple Sclerosis in Europe: An Epidemiological Update. edn.Edited by Firnhaber W, Lauer K. Darmstadt: LTV Press; 1994:147–158. 86. Martinez Sobrepera HJ, Cabrera Gomez JA, Tuero Iglesias A:
[Exogenous factors in the aetiology of multiple sclerosis in Cuba. A study of cases and controls].Rev Neurol2001,33(10):931–937. 87. Poskanzer DC:Tonsillectomy and multiple sclerosis.Lancet1965,
2(7425):1264–1266.
88. Poskanzer DC, Sheridan JL, Prenney LB, Walker AM:Multiple sclerosis in the Orkney and Shetland Islands. II: the search for an exogenous aetiology. J Epidemiol Comm Health1980,34(4):240–252.
89. Roshanisefat H, Bahmanyar S, Hillert J, Olsson T, Montgomery SM:
Appendicectomy and multiple sclerosis risk.Eur J Neurol2011,
18(4):667–669.
90. Westlund KB, Kurland LT:Studies on multiple sclerosis in Winnepeg, Manitoba, and New Orleans, Louisiana. I. Prevalence; comparison between the patient groups in Winnipeg and New Orleans.Am J Hyg1953,57(3):380–396.
91. YosefiPour G, Rasekhi A:Multiple sclerosis: a risk factor analysis in Iran.Arch Iran Med2002,5(3):191–193.
92. Zaadstra BM, Chorus AM, van Buuren S, Kalsbeek H, van Noort JM:
Selective association of multiple sclerosis with infectious mononucleosis.Mult Scler2008,14(3):307–313.
93. Zilber N, Kahana E:Risk factors for multiple sclerosis: a case– control study in Israel.Acta Neurol Scand1996,94(6):395–403. 94. Zorzon M, Zivadinov R, Nasuelli D, Dolfini P, Bosco A, Bratina A, Tommasi
MA, Locatelli L, Cazzato G:Risk factors of multiple sclerosis: a case–control study.Neurological Sciences2003,24(4):242–247.
95. Siva A, Radhakrishnan K, Kurland LT, O'Brien PC, Swanson JW, Rodriguez M:
Trauma and multiple sclerosis: a population-based cohort study from Olmsted County, Minnesota.Neurology1993,43(10):1878–1882. 96. Sterne JAC, Egger M, Moher D:Chapter 10: Addressing reporting
biases. InCochrane Handbook for Systematic Reviews of Interventions Version 510 (updated March 2011).Edited by Higgins JPT, Green S. The Cochrane Collaboration; 2011.
97. Paffenbarger RS Jr:The effect of prior tonsillectomy on incidence and clinical type of acute poliomyelitis.Am J Hyg1957,66(2):131–150. 98. Paffenbarger RS Jr, Wilson VO:Previous tonsillectomy and current
pregnancy as they affect risk of poliomyelitis attack.Ann N Y Acad Sci1955,61(4):856–868.
99. Siegel M, Greenberg M, Magee MC:Tonsillectomy and poliomyelitis. II. Frequency of bulbar paralysis, 1944–1949. J Pediatr1951,38(5):548–558.
100. Yamanaka N, Kataura A:Viral infections associated with recurrent tonsillitis.Acta Otolaryngol Suppl1984,416:30–37.
Lunnyet al. BMC Neurology2013,13:41 Page 14 of 15
101. Lucas RM, Hughes AM, Lay M-LJ, Ponsonby A-L, Dwyer DE, Taylor BV, Pender MP:Epstein–Barr virus and multiple sclerosis.J Neurol Neurosurg Psychiatry2011,82(10):1142–1148.
102. Bagos PG, Nikolopoulos G, Ioannidis A:Chlamydia pneumoniae infection and the risk of multiple sclerosis: a meta-analysis.Mult Scler2006,
12(4):397–411.
103. Cook SD, Rohowsky-Kochan C, Bansil S, Dowling PC:Evidence for multiple sclerosis as an infectious disease.Acta Neurol Scand Suppl1995,
161:34–42.
104. Krone B, Oeffner F, Grange JM:Is the risk of multiple sclerosis related to the 'biography' of the immune system?J Neurol2009,256(7):1052–1060. 105. Jilek S, Schluep M, Meylan P, Vingerhoets F, Guignard L, Monney A,
Kleeberg J, Le Goff G, Pantaleo G, Du Pasquier RA:Strong EBV-specific CD8+ T-cell response in patients with early multiple sclerosis.Brain2008,
131(Pt 7):1712–1721.
106. Levin LI, Munger KL, Rubertone MV, Peck CA, Lennette ET, Spiegelman D, Ascherio A:Temporal relationship between elevation of epstein-barr virus antibody titers and initial onset of neurological symptoms in multiple sclerosis.JAMA2005,293(20):2496–2500.
107. Randal Bollinger R, Barbas AS, Bush EL, Lin SS, Parker W:Biofilms in the large bowel suggest an apparent function of the human vermiform appendix.J Theor Biol2007,249(4):826–831.
108. Franciotta D, Salvetti M, Lolli F, Serafini B, Aloisi F:B cells and multiple sclerosis.Lancet Neurol2008,7(9):852–858.
109. Correale J, Farez MF:The impact of environmental infections (parasites) on MS activity.Mult Scler2011,17(10):1162–1169.
110. Norgaard M, Nielsen RB, Jacobsen JB, Gradus JL, Stenager E, Koch-Henriksen N, Lash TL, Sorensen HT:Use of penicillin and other antibiotics and risk of multiple sclerosis: a population-based case–control study.Am J Epidemiol
2011,174(8):945–948.
111. Alder AC, Fomby TB, Woodward WA, Haley RW, Sarosi G, Livingston EH:
Association of viral infection and appendicitis.Arch Surg2010,
145(1):63–71.
112. Bernstein CN, Wajda A, Blanchard JF:The clustering of other chronic inflammatory diseases in inflammatory bowel disease:
a population-based study.Gastroenterol2005,129(3):827–836. 113. Matsushita M, Takakuwa H, Matsubayashi Y, Nishio A, Ikehara S, Okazaki K:
Appendix is a priming site in the development of ulcerative colitis. World J Gastroenterol2005,11(31):4869–4874.
114. Pender MP:CD8+ T-cell deficiency, Epstein-Barr virus infection, vitamin D deficiency, and steps to autoimmunity: a unifying hypothesis. Autoimmune Dis2012,2012:189096.
115. Laurin M, Everett ML, Parker W:The cecal appendix: one more immune component with a function disturbed by post-industrial culture. Anat Rec (Hoboken)2011,294(4):567–579.
116. Rosati G:The prevalence of multiple sclerosis in the world: an update. Neurol Sci2001,22(2):117–139.
117. Livingston EH, Fomby TB, Woodward WA, Haley RW:Epidemiological similarities between appendicitis and diverticulitis suggesting a common underlying pathogenesis.Arch Surg2011,146(3):308–314.
118. Fleming JO, Carrithers MD:Diagnosis and management of multiple sclerosis: a handful of patience.Neurol2010,74(11):876–877. 119. Krone B, Pohl D, Rostasy K, Kahler E, Brunner E, Oeffner F, Grange JM,
Gartner J, Hanefeld F:Common infectious agents in multiple sclerosis: a case–control study in children.Mult Scler2008,14(1):136–139.
doi:10.1186/1471-2377-13-41
Cite this article as:Lunnyet al.:Surgery and risk for multiple sclerosis: a systematic review and meta-analysis of case–control studies.BMC Neurology201313:41.
Submit your next manuscript to BioMed Central and take full advantage of:
• Convenient online submission
• Thorough peer review
• No space constraints or color figure charges
• Immediate publication on acceptance
• Inclusion in PubMed, CAS, Scopus and Google Scholar
• Research which is freely available for redistribution Submit your manuscript at
www.biomedcentral.com/submit
Lunnyet al. BMC Neurology2013,13:41 Page 15 of 15