DEMOGRAPHIC RESEARCH
A peer-reviewed, open-access journal of population sciences
DEMOGRAPHIC RESEARCH
VOLUME 34, ARTICLE 28, PAGES 797–826
PUBLISHED 10 MAY 2016
http://www.demographic-research.org/Volumes/Vol34/28/ DOI: 10.4054/DemRes.2016.34.28
Research Article
The impact of the sent-down movement on
Chinese women’s age at first marriage
Shige Song
Lu Zheng
c
2016 Shige Song & Lu Zheng.
1 Introduction 798
2 Historical context 799
3 Data and variables 801
4 Models and methods 804
4.1 Estimating the causal effect of send-down 804
4.2 Assessing the population impact using counterfactual simulation 807
5 Results 808
5.1 Descriptive analysis 808
5.2 Does send-down increase women’s age at first marriage? 809
5.3 Does send-down duration matter? 811
5.4 How much did the send-down contribute to the total changes in women’s age at first marriage
between 1970 and 1979? 813
6 Discussion 815
7 Acknowledgements 816
References 817
The impact of the sent-down movement on Chinese women’s age at
first marriage
Shige Song1
Lu Zheng2
Abstract
BACKGROUND
Chinese women’s age at first marriage increased for more than three years on average during the short period between 1970 and 1979. Demographers attributed it to the“later, longer, fewer”family planning policy of the 1970s whereas some sociologists suggested that the “send-down” movement in 1968–1978, which mobilized over 17 million urban youths and sent them to the countryside, may also have played a role.
METHODS
Using newly available high-quality national representative sample survey data, we esti-mated the effect of being sent-down on women’s age at first marriage. We then conducted counterfactual simulations to decompose the total increase in women’s age of marriage between 1970 and 1979 into a component attributed to the send-down and a residual component attributed to other factors.
RESULTS
Our results suggest that being sent-down delayed Chinese women’s age at first marriage by 1.2 years. For urban women, this accounts for 13.3 percent of the total increase in their age at first marriage between 1970 and 1979. For urban and rural women together, the overall contribution of send-down to the increase in their age of marriage is less than one percent.
CONCLUSIONS
On one hand, the send-down policy did not play an important role in the demographic transition process in China. On the other hand, for the 17 million sent-down youths, being forced to leave home and settle in a harsh and unfamiliar rural environment at very
1Queens College and CUNY Institute for Demographic Research, CUNY, U.S.A. E-Mail: [email protected].
young ages marked a hard transition to adulthood and inevitably disrupted their normal life course. Delayed marriage, as revealed by this study, may be just tip of the iceberg.
1. Introduction
The demographic transition in China took place at an extraordinarily rapid pace (Coale 1984; Hussain 2002). It has often been attributed to the Chinese government’s effective family planning policy (Greenhalgh and Winckler 2005; Scharping 2003). To many peo-ple’s surprise, when the family planning policy in China reached its current and the most stringent form, known as theone-childpolicy, in 1979, the demographic transition in this country had more or less been completed. The total fertility rate (TFR) only declined by 19 percent between 1979 and 1990 (from 2.77 to 2.24) under theone-child policy; by contrast, in the decade preceding theone-childpolicy, the Chinese TFR declined by 52 percent, from 5.75 in 1970 to 2.77 in 1979 (Scharping 2003). It was estimated that over 40 percent of this fertility decline in the 1970s was due to the increase in women’s age at marriage during the same period of time (Coale 1984; Feeney et al. 1989), from 20.2 in the 1970 to 23.1 in 1979 (Scharping 2003)3. To put this in perspective, before 1970, it took 22 years for Chinese women’s age at first marriage to gradually increase from 18.6 in 1949 to 20.2 in 1970; after 1979, Chinese women’s age at first marriage fell, fluctu-ated, and took 18 years to climb back to the 1979 level. What happened between 1970 and 1979 that caused Chinese women to suddenly delay their marriages?
Demographers often attributed the rapid increase in women’s marriage age in the 1970s to the government’s “Later (marriage), Longer (birth intervals), Fewer (births)” (LLF) family planning policy (Bongaarts and Greenhalgh 1985; Lavely, Lee, and Wang 1990; Scharping 2003). Launched in 1971, the LLF policy introduced three specific re-productive goals including late marriage (i.e., 28 and 25 for urban men and women, and 25 and 23 for rural men and women), long birth intervals (four years in the cities and three years in the countryside) between the first and subsequent childbirths, and small family size (i.e., two children for urban couples and three for rural ones). Unlike earlier family planning efforts in the 1950s and 1960s, both of which were small, local, and short-lived (the first one was interrupted by the Great Leap Forward and the second by the Cultural Revolution), the LLF was national in scale, comprehensive, and well-implemented. The effectiveness of the LLF policy has been widely acknowledged to the extent that its sud-den termination in 1979 (i.e., it was superseded by theone-childpolicy) was considered by demographers a mistake (Bongaarts and Greenhalgh 1985; Greenhalgh and Bongaarts 1987).
Sociologists suggested an alternative explanation. Between 1968 and 1978,
imately 17 million urban Chinese high school graduates were “sent-down” to rural and frontier regions. It was estimated that the average age of marriage of these who were sent-down for over six years is nearly two years higher than that of those who were not (Zhou and Hou 1999). It was further suggested that the difference in age at marriage between those who were sent-down and those who were not would have been even more salient had the LLF family planning policy failed to increase the marriage age of all ur-ban youths in the 1970s (Zhou and Hou 1999). Insightful as they are, such findings raise further questions. First, how much of the reported difference in marriage age between who were sent-down and those who were not iscausalin nature, as opposed to being a statistical artifact caused by inadequate control, or selection bias? Second, how much did it contribute to the total increase in women’s age at first marriage in the 1970s at the population-level?
We aim to address these two questions here. Using newly available large, nationally representative sample survey data, we first conducted regression and matching analyses to estimate the effect of the send-down on Chinese women’s age at first marriage. Using the estimated coefficients, we then conducted counterfactual simulation to decompose the to-tal increase in women’s marriage age between 1970 and 1979 into a component attributed directly to the send-down movement and a residual component attributed to other factors. Because the effect of the LLF policy is part of the residual component, comparing the size of these two components can provide important new insights on the relative importance of these two policies in shaping the demographic landscape of contemporary China.
2. Historical context
In 1968, two years after the beginning of the Cultural Revolution, the Chinese govern-ment was facing a number of difficult problems, most of which had something to do with the “Red Guard Rebellion” of the preceding years. For example, in many places, the red guards – radical paramilitaries made up of high school students of “good” class backgrounds – paralyzed governmental agencies and educational institutions and severely disrupted the economy, especially the urban sector (Walder 2009; Zhou and Hou 1999). The disrupted urban economy led to reduced labor force demand: it was difficult enough to assign jobs to all the high school students graduating in 1968, it became impossible to also assign jobs to those who were supposed to graduate in 1966 or 1967 but who did not until 1968 because schools were shut down by their “revolutionary” actions (Unger 1982).
restoring the urban social order and “solving” the urban unemployment problem. How-ever, the send-down policy was more than a pragmatic policy response to temporary social and economic problems because it continued for 10 years, long after the trouble-making former red guards were sent away and even when the urban economy was facing a labor shortage in the early 1970s. There was a deeper political and ideological consideration: the send-down policy was seen by Mao and his colleagues as an important way to culti-vate the next generation of revolutionary leaders and successors by re-educating the urban youths, including their own children, with revolutionary ideals and experiences (Bernstein 1977; Bonnin 2009). This dual nature of the send-down policy, both as a pragmatic policy measure and a long-term political and ideological campaign, complicated people’s atti-tude toward the policy and altered the dynamics of the send-down selection process. On one hand, send-down was associated with harsh rural life and hard agricultural work that urban people would try to avoid. On the other hand, send-down was perceived by many as revolutionary and unavoidable, and any efforts to game it would be doomed to fail or even backfire. Some urban families adopted a different strategy and chose to embrace and actively engage in the send-down movement. For those with a “bad” class background, the heroic action of volunteering to go to the most remote and backward regions pro-vided an opportunity to wash off the stigma they were born with. For those who were politically ambitious, embracing Chairman Mao’s call loftily and swiftly demonstrated uncompromising political loyalty, a quality highly regarded and actively sought after dur-ing the Cultural Revolution and could potentially give one’s political career a jump-start (Walder, Li, and Treiman 2000).
Unlike some other Maoist political movements which targeted specific social groups, the send-down policy influenced virtually all urban families and even some rural families. Although, in theory, all high school graduates between 1968 and 1978 were eligible, only one third of them were actually sent-down to the countryside. The question of who got sent-down and who got to stay is a crucial one, and the answer to the question has important implication on the design of this study.
In summary, between 1968 and 1978, over 17 million, approximately one third of all Chinese high school graduates, were sent to rural and frontier regions; many lived there for over 10 years. The send-down policy and its implementation changed significantly over time and from place to place, creating drastic temporal and regional variations. In comparison, the effect of individual characteristics or family background was much less important. Because of its dual-nature, both as a pragmatic policy and an ideological campaign, the send-down policy did not exclude any particular social groups. In other words, we can find children of the political elites in both the send-down and non-send-down groups, in the same way we can find children of ordinary factory workers or school teachers in both groups.
3. Data and variables
Two data sources, the 2010 wave of the China Family Panel Studies (CFPS) and the 1982 one-per-thousand fertility survey, were used in this study.
The 2010 CFPS, which was carried out by the Institute of Social Science Survey at Peking University, was based on a nationally representative sample of 57,115 individuals living in 14,960 households in China. The key causal explanatory variable, whether a re-spondent was ever sent-down or not, was constructed based on two pieces of information recorded in the survey, including: (1) were you ever sent “up to the mountains and down to the countryside”, and (2) did you ever join the production and construction corps? Both questions ask about the send-down experience. The former refers to being sent-down to the rural areas in interior regions whereas the latter refers to being sent-sent-down to frontier regions like Xinjiang, Inner Mongolia, and Yunnan (Bonnin 2009). Although the full-fledged official send-down policy took place between 1968 and 1978, small-scale local send-down experiments began in various parts of the country as early as in the late 1950s. We excluded such cases because these early experiments involved self-selected volunteers who were smarter, more experienced, and more ambitious than the rest, which makes it difficult to tackle the selection bias.
the fact that these earlier cohorts are of small size suggests that the reported send-down cases among women born before the late 1940s are likely due to misreporting or misun-derstanding. More importantly, these older women should be excluded from an analysis of the effect of send-down on marriage age anyway because the majority of them were already married when the send-down policy began in 1968. Similarly, the small number of women of the 1962–1964 birth cohorts who reported being sent-down were also likely to be due to misreporting or misunderstanding because they were still at school when the send-down policy ended in 1978. We further excluded 562 cases that are not suitable for the analysis: 498 of them could not remember when they were first married, 49 of them reported an age at first marriage that was out of the normal range, and 15 of them were never married.4 After excluding these cases, our final analytic sample consists of 3,740
Chinese women who were born between 1947 and 1960.
Figure 1: Cohort trend in the proportion of sent-down youths, obtained from the 2010 CFPS
0.00 0.03 0.06 0.09
1910 1920 1930 1940 1950 1960 1970 1980 1990
Birth Cohort
Propor
tion Being Sent−Do
wn
Cohort Size
100 200 300 400
A number of additional variables were included in the analysis to control for possible confounding effects. These include (1) urban status at age 12, (2) ethnicity, (3) level of education at the time, (4) birth cohort, (5) province of residence at age 12, and (6) family class status during the Cultural Revolution. They are exogenous in the sense that they capture information that is either time-invariant (e.g., ethnicity, birth cohort) orpriorto the sent-down (e.g., urban status at age 12, level of education, province of residence at age 12, and family class status during the Cultural Revolution). Endogenous variables should be avoided because they can contaminate the estimated send-down effect on women’s age at first marriage.
Urban status at age 12 measures whether a respondent had urban household reg-istration (i.e.,“hukou”) status when they were 12 years old. Although send-down was primarily an urban movement, some high school graduates with rural origins were also involved. Instead of dropping all rural cases, we decided to keep them in the analysis and include a dichotomous indicator to control for its effect. Ethnicity was also coded as a dichotomous variable measuring whether the respondent is of Han ethnic majority or not. Level of education has four different categories representing “not much schooling”, “elementary school graduate”, “junior high school graduate”, and “senior high school graduate and above”. Birth cohort measures the respondent’s year of birth. It approxi-mates the respondent’s year of high school completion, which is an important determinant of the send-down probability. This analysis focuses on the 14 cohorts born between 1947 and 1960. Province of residence at age 12 approximates the province of residence at high school completion, which is another important determinant of the send-down probabil-ity. Family class element is a categorical variable with 26 categories including different types of landlords, peasants, industrial workers, and professionals. This is an elaborated version of the Marxist doctrine of class opposition and class struggle adopted by the Chi-nese Communist Party under Mao. Children of “bad” class background often face severe discrimination in education, occupation, and the marriage market.
A second data source, the 1982 one-per-thousand fertility survey, was used in coun-terfactual simulation analysis to decompose the changes observed in women’s age at first marriage between 1970 and 1979 into a component attributable to the send-down and a residual component attributable other factors. Conducted by the Chinese State Family Planning Commission in 1982, the one-per-thousand fertility survey collected complete marriage and fertility histories of a nationally representative sample of 310,101 Chinese women aged 15–67 in 1982. This was the first national fertility conducted in China since 1949 with high data quality and excellent population coverage (Coale 1984; Lavely, Lee, and Wang 1990). The timing of the survey makes it the perfect choice for the current study.
85.5 percent were of rural origin. Figure 2 plots the temporal trend in age at first marriage for these women.
Figure 2: Changes in urban and rural Chinese women’s age at first marriage between 1970 and 1979, obtained from the 1982 one-per-thousand fertility survey
19 20 21 22 23 24 25
1970 1979
Year
A
v
er
age marr
iage age Hukou
Rural Urban
4. Models and methods
4.1 Estimating the causal effect of send-down
cogni-tive ability, non-cognicogni-tive ability, career ambition, physical attraccogni-tiveness, health status, etc., – mattered little in the send-down selection process (Bonnin 2009). Second, fam-ily background – parental occupation, parental education, famfam-ily income, famfam-ily class background, etc., – did not seem to have an important effect either (Bonnin 2009; Zhou and Hou 1999). What mattered most are macro social processes, such as changes in the urban labor market conditions, shifts in the state policy (e.g., emphasizing class struggle vs. emphasizing economic development), and the attitude of local officials (e.g., radical vs. pragmatic) (Bonnin 2009; Zhou and Hou 1999), which changed from year to year and varied between provinces. Since individuals or individual families have little control over these macro processes, there is not much they can do to influence the send-down selection process.5 These unusual characteristics together make the send-down policy a
viable natural experiment in which the treatment (i.e, send-down) assignment is as good as random (Dunning 2012; Murnane and Willett 2010).
Natural experimental design bridges the gap between the experimental and non-experimental designs. Carefully designed randomized experiment makes it easy to es-timate causal effect because randomization automatically eliminates all confounding ef-fects and also balances the treatment and control groups. Without randomization, as in non-experimental studies, the burden of identifying and “controlling for”allpossible con-founders and also balancing the treatment and control groups falls upon the researchers. This is what makes it so difficult to draw causal inference from observational data. With natural experimental design, it is often the case that the confounding effect is much less of a problem because the treatment assignment is determined by exogenous forces (e.g., natural disaster, abrupt policy change, idiosyncrasy of geography or birth date) that makes self-selection difficult. However, exogenous treatment assignment does not automatically balance the treatment and control groups. For example, based on the CFPS data, due to changes in urban labor market condition and policy shift, the proportion of the sent-down is much higher in the 1956 birth cohort than in the 1955 birth cohort; at the same time, it also happens that the average level of education is higher in the 1956 than in the 1955 cohort. As a result, the send-down and non-send-down groups are not balanced with re-spect to educational composition, which can contaminate the estimated send-down effect on women’s age at first marriage.
Regression and matching are both commonly used to tackle this problem. An im-portant advantage of matching is that it explicitly balances the covariate distribution be-tween the treatment and control groups by pruning cases that do not have meaningful counterfactuals whereas regression automatically resorts to functional form and distri-butional assumptions to extrapolate the non-existing information (Morgan and Winship 2015; Stuart 2010). In this analysis, we conducted both regression and matching analyses
and compared their results. This leads to more robust results and better understanding of the relationship between send-down and women’s age at first marriage in China.
For regression analysis, we chose ordinary least square (OLS) linear regression over the more sophisticated nonlinear alternatives such as parametric or semi-parametric sur-vival analysis models because OLS regression results are robust, easy to interpret, and speak to the quantities of direct causal importance (Angrist and Pischke 2009).6
For matching analysis, we chose coarsened exact matching (CEM) to balance the sent-down and non-sent-down groups (Iacus, King, and Porro 2011). CEM is essentially exact matching plus coarsening, a preprocessing procedure to temporarily collapse con-tinuous and discrete variables into a smaller number of groups to avoid excessive amount of unmatched cases. Unlike propensity score and other approximate matching meth-ods, CEM bounds the maximum degree of imbalance between the treatment and control groups by user’sex antechoice, which can be data-driven, theory-driven, or guided by substantive knowledge. Also, the coarsening choice for any individual variable has no effect on the imbalance bound for other variables in the matching model (Iacus, King, and Porro 2011). Among the six matching variables used in this study, three of them, education, ethnicity, and household registration status at age 12, were directly included for matching (i.e., without coarsening) whereas the other three, birth cohort, province of residence at age 12, and family class status, were coarsened before included for matching. Details of the procedure can be found in the Appendix. The CEM analysis was carried out using “cem” (Iacus, King, and Porro 2009), which is a user contributed package for
R, the free software for statistical computing (R Core Team 2014).
The CEM procedures described above produce a hierarchical data structure in which individuals were nested within strata – nonempty combinations of the included matching covariates. Many of these strata will be discarded because they include only treatment cases or only control cases. This hierarchical data structure introduces further complex-ities into the post-matching estimation process. There are three different ways to obtain effect estimates from such hierarchical data structure, including the “no pooling”, “com-plete pooling”, and “semi-pooling” (Gelman and Hill 2006). The no pooling model treats each stratum as a unique and independent unit and estimates stratum-specific treatment effect separately, whereas the complete pooling model treats all strata as identical units and estimate one treatment effect for the entire sample. The semi-pooling model takes a middle ground by treating strata as “exchangeable” in the sense that they are similar but not identical. In the current case, exchangeability means that, after controlling for covari-ates, all the stratum-specific treatment effect estimates can be regarded as a sequence of random draws from the same underlying distribution. The semi-pooling model strikes a
good balance between variance and bias because the exchangeability assumption makes it possible to estimate the stratum-specific treatment effect without running into the small sample problem by “borrowing strength” from other strata in the sample.
4.2 Assessing the population impact using counterfactual simulation
Our next step is to conduct counterfactual simulation analysis to assess the relative con-tribution of the send-down policy to the total increase in women’s age at first marriage between 1970 and 1979 in China. The procedures described below drew inspiration from Carsey and Harden (2013) and King, Tomz, and Wittenberg (2000).
The counterfactual simulation includes the following essential steps:
1. CalculateD0, the difference in women’s age at marriage between 1970 and 1979
obtained from the one-per-thousand survey data. This is the observed change (i.e., with the send-down effect).
2. Randomly sampleppercent of women born between 1947 and 1960 from the one-per-thousand fertility survey, subtract β years from their age at first marriage as well as the year at first marriage.
3. Put these women back into the sample and overwrite their original values of age and year at first marriage.
4. CalculateD1, the difference in women’s age at marriage between 1970 and 1979 in
the simulated data. This is the expected change under the counterfactual condition without the send-down.
5. The proportion of changes in women’s age at marriage induced by the send-down policy can be calculated as:S= D1−D0
D0
6. Repeat these steps forN = 1, 000times to get the distribution ofS, from which the mean, median, and 95 percent confidence intervals can be calculated.
Bothβ (the effect of send-down) andp(the proportion of the sent-down) were ob-tained from the CFPS,D0was obtained from the 1982 fertility survey, whereasD1
uti-lized information from both data sources. We can use different values for p, D0, and
D1 to reflect the situations for urban women, rural women, and urban and rural women
combined.
5. Results
5.1 Descriptive analysis
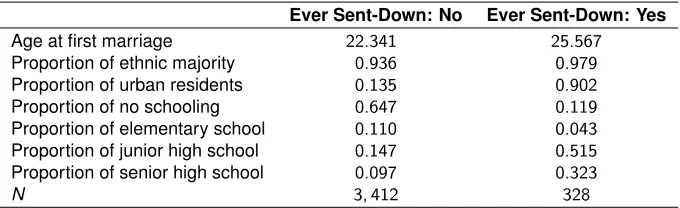
Table 1 compares the unweighted mean age at first marriage, the proportion of Han ethnic majority, the proportion of urban residents, and the proportion of different educational categories between send-down and non-send-down women using the CFPS data. Without controlling for anything, the average age at first marriage is 3.23 years higher among the send-down group than that among the non-send-down group. A more careful look, however, shows that the send-down and non-send-down groups also differ in a number of other ways. First, 90 percent of send-down group have urban household registration status at age 12, whereas for the non-send-down group the number is 13 percent. Second, 65 percent of the non-send-down group have little or no education, whereas only 12 of the sent-down group have little or no education; at the same time, less than 25 percent of the non-send-down group have junior high school education or more, whereas over 83 percent of the send-down group have junior high school education or more. Since both education and urban residence tend to delay marriage (Wang and Yang 1996), it is important to control for these differences between the send-down and non-send-down groups in order to better understand the relationship between send-down and women’s age at first marriage.
Table 1: Descriptive statistics of selected variables in the 2010 CFPS sample (unweighted)
Ever Sent-Down: No Ever Sent-Down: Yes
Age at first marriage 22.341 25.567
Proportion of ethnic majority 0.936 0.979
Proportion of urban residents 0.135 0.902
Proportion of no schooling 0.647 0.119
Proportion of elementary school 0.110 0.043
Proportion of junior high school 0.147 0.515
Proportion of senior high school 0.097 0.323
N 3, 412 328
5.2 Does send-down increase women’s age at first marriage?
Table 2 reports results from five linear regression models on the effect of send-down on women’s age at first marriage. Model 1, which did not include control variables, shows that the average age at first marriage is 3.118 years higher among women who were sent-down than those who were not. This is consistent with the descriptive results reported in Table 1. Model 2 shows that after controlling for urban status, ethnicity, and education, the effect of send-down was reduced to 1.086 years. This is not surprising because, as explained above, the send-down group is much more urban and much better educated on average than the non-send-down group and, as Model 2 shows, both urban status and more education cause a delay in marriage.
Models 3, 4, and 5 further controlled for province of residence at age 12, birth cohort, and family class element during the Cultural Revolution (coefficients for these control variables were not reported). Adding these covariates improved model fit, according to Akaike information criteria (Akaike 1974), and caused some slight changes to the estimated send-down coefficient. Based on Model 5, the best-fit model, the average age at first marriage of women who were sent-down is 1.032 years higher than those who were not.7
Table 2: Linear regression results of the send-down effect on the age at first marriage of Chinese women born in 1947–1960
Age at first marriage
Model 1 Model 2 Model 3 Model 4 Model 5
Send-down 3.118∗∗∗ 1.086∗∗∗ 1.053∗∗∗ 1.058∗∗∗ 1.032∗∗∗
(0.253) (0.287) (0.284) (0.283) (0.290) Urban status 1.022∗∗∗ 0.967∗∗∗ 0.942∗∗∗ 0.819∗∗ (0.223) (0.233) (0.231) (0.260)
Ethnicity 0.110 −0.195 −0.148 −0.165
(0.260) (0.314) (0.310) (0.313) Education: elementary 0.371 0.266 0.379 0.363
(0.231) (0.225) (0.223) (0.225) Education: junior high 1.771∗∗∗ 1.525∗∗∗ 1.465∗∗∗ 1.361∗∗∗
(0.214) (0.213) (0.213) (0.216) Education: senior high 2.371∗∗∗ 2.200∗∗∗ 2.011∗∗∗ 1.895∗∗∗
(0.241) (0.237) (0.241) (0.245) Constant 22.187∗∗∗ 21.412∗∗∗ 24.136∗∗∗ 22.654∗∗∗ 23.411∗∗∗
(0.076) (0.250) (0.733) (0.779) (0.951)
Province dummies No No Yes Yes Yes
Birth cohort dummies No No No Yes Yes
Class elements dummies No No No No Yes
N 2,411 2,399 2,397 2,397 2,369
Log Likelihood −6,624.176 −6,480.136 −6,376.758 −6,335.850 −6,247.575 AIC 13,252.350 12,974.270 12,817.520 12,761.700 12,621.150
Note:∗p<.05;∗∗p<.01;∗∗∗p<.001
To further reduce model dependency and increase the robustness of the findings, the next step is to conduct nonparametric matching to balance the send-down and non-send-down groups. As shown in Table 1 in the Appendix, exact matching is not an option because it discarded over 94 percent of the control cases and 62 percent of the treatment cases. Coarsening three covariates, including birth cohort, province of residence at age 12, and family class element during the Cultural Revolution, reduced the percentage of unmatched control cases from 94 percent to 76 percent; more importantly, it reduced the percentage of the unmatched treatment cases from 62 percent to less than 19 percent (Table 4 in the Appendix).
distributional structure to avoid small sample problem. In this case, the semi-pooling model suggests that send-down increases Chinese women’s age at first marriage by 1.200 years, which is slightly higher than the complete-pooling estimate of 1.007 years.
Table 3: Coarsened exact matching results of the send-down effect on Chinese women’s age at first marriage
Estimate Std. Error
Linear effect (complete pooling) 1.007 0.229
Random effect (semi-pooling) 1.200 0.045
5.3 Does send-down duration matter?
We further tested the hypothesis that the effect of send-down on women’s age at first marriage depends on the send-down duration (Zhou and Hou 1999). To do this, we used the trichotomous treatment variable that indicates whether a respondent was (1) never sent-down, (2) sent-down, for less than six years, or (3) sent-down, for six years or more. Table 4, which is similar to Table 2, reports linear regression results. The only dif-ference between Tables 2 and 4 is that the single treatment group (“send-down”) in Table 2 was split into two groups (“send-down: <6 years” and “send-down: ≥6 years”) in Table 4. Without controlling for any covariates, Model 1 shows that both short- and long-term send-down had significant effect increasing women’s age at first marriage. Models 2-5 suggest that adding control variables to the model reduced the estimated send-down effects. According to the best-fit model, which includes all six control variables, both the short- and long-term send-down significantly increased women’s age at first mar-riage. More specifically, short-term send-down increases women’s age at first marriage by 0.743 years whereas long-term send-down increases women’s age at first marriage by 1.462 years.
Table 4: Linear regression results of the send-down duration effect on the age at first marriage of Chinese women born in 1947–1960
Age at first marriage
Model 1 Model 2 Model 3 Model 4 Model 5
Send-down:<6 years 2.583∗∗∗ 0.462 0.704∗ 0.709∗ 0.743∗ (0.280) (0.307) (0.306) (0.303) (0.311) Send-down:>6 years 3.828∗∗∗ 1.910∗∗∗ 1.194∗ 1.489∗∗ 1.462∗∗
(0.498) (0.503) (0.501) (0.500) (0.532) Urban status 1.069∗∗∗ 1.014∗∗∗ 0.964∗∗∗ 0.844∗∗ (0.224) (0.235) (0.232) (0.261)
Ethnicity 0.116 −0.178 −0.128 −0.150
(0.260) (0.314) (0.311) (0.313) Education: elementary 0.362 0.259 0.372 0.356
(0.231) (0.226) (0.223) (0.225) Education: junior high 1.796∗∗∗ 1.532∗∗∗ 1.466∗∗∗ 1.365∗∗∗
(0.214) (0.214) (0.213) (0.216) Education: senior high 2.460∗∗∗ 2.251∗∗∗ 2.059∗∗∗ 1.938∗∗∗
(0.241) (0.238) (0.242) (0.246) Constant 22.196∗∗∗ 21.405∗∗∗ 24.119∗∗∗ 22.567∗∗∗ 23.319∗∗∗
(0.076) (0.250) (0.736) (0.783) (0.956)
Province dummies No No Yes Yes Yes
Birth cohort dummies No No No Yes Yes
Class elements dummies No No No No Yes
N 2,411 2,399 2,397 2,397 2,369
Log Likelihood −6,630.283 −6,479.767 −6,378.927 −6,336.671 −6,248.144 AIC 13,266.570 12,975.530 12,823.850 12,765.340 12,624.290
Note:∗p<.05;∗∗p<.01;∗∗∗p<.001
Table 5: Coarsened exact matching results of the send-down duration effect on Chinese women’s age at first marriage
Estimate Std. Error
Less than 6 years: linear effect 0.360 0.238
Less than 6 years: random effect 0.489 0.048
More than 6 years: linear effect 1.245 0.460
More than 6 years: random effect 1.440 0.138
regression results reported in Table 4. These results do not support the argument by Zhou and Hou (1999) that long-term send-down delayed people’s marriage age but short-term send-down did not. All the results show that, although long-term send-down increased women’s marriage age more than short-term send-down did, both short- and long-term send down significantly increased women’s age at first marriage.
5.4 How much did the send-down contribute to the total changes in women’s age at first marriage between 1970 and 1979?
The results obtained from the previous section provide the crucial piece of information that can be used to evaluate the overall contribution of the send-down policy to the total increase in women’s age at first marriage at the population-level. Next we conducted counterfactual simulations based on the results (semi-pooling) reported in Tables 3 and 5 and the two sets of results are highly consistent. For the sake of parsimony, our subse-quent discussions focus on the results based on Table 3. Other crucial parameters for the simulation-based decomposition include: (1) 39.31 percent of urban women in the CFPS experienced down; (2) 1.08 percent of rural women in the CFPS experienced send-down; (3) 85.5 percent of women in the selected cohort in the 1982 one-per-thousand data were rural.
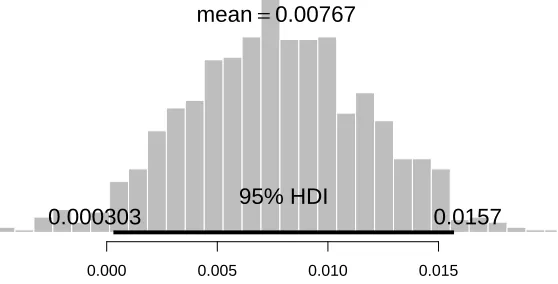
Figures 3 and 4 report the counterfactual simulation results. Figure 3 plots the dis-tribution of proportions of the increase in marriage age in the 1970s that can be directly attributed to the send-down policy for urban women, whereas Figure 4 plots the same in-formation for urban and rural women combined. In both figures, the central tendency of the distribution is given by the mean value, whereas the dispersion is given by 95 percent highest density interval (HDI).8
Figure 3: Proportion of the total increase in Chinese women’s age at first marriage between 1970 and 1979 due to the send-down policy, urban sample only
0.10 0.12 0.14 0.16
95% HDI
0.103
0.164
mean
=
0.133
Figure 4: Proportion of the total increase in Chinese women’s age at first marriage between 1970 and 1979 due to the send-down policy, urban and rural samples combined
0.000 0.005 0.010 0.015
95% HDI
0.000303
0.0157
mean
=
0.00767
between 1970 and 1979. In other words, the overall influence of the send-down policy on the population-level trend in women’s marriage age is negligible.
6. Discussion
Borrowing strength from newly available high-quality survey data and natural experimen-tal design, this study shows that the send-down policy in 1967–1978caused a delay of 1.2 years in Chinese women’s age at first marriage. In addition, our results show that, although the duration of send-down influenced the strength of the send-down effect on women’s age at first marriage and long-term send-down had a stronger effect, the effect of the short-term send-down (for less than six years) is also significant and non-trivial. Our counterfactual simulation analysis suggests that the individual-level send-down ef-fect translates to, on average, 13.3 percent of the total increase in urban women’s age at first marriage between 1970 and 1979. Because of the very low prevalence of send-down in the rural population, however, when we consider both urban and rural women together, the overall impact of the send-down policy on the population-level increase in women’s age at first marriage in the 1970s is negligible.
To the best of our knowledge, this is the first study that focuses explicitly on the demographic consequences of the send-down policy.9 At the individual-level, an increase
of 1.2 years in women’s age at first marriage is not trivial. More importantly, unlike the LLF policy, which delayed people’s marriage by raising the minimum acceptable marriage age and punishing anybody who did not comply, the send-down youths delay their marriage “voluntarily” because of the hardship of rural life, physically strenuous agricultural work, and the fear that getting married in the countryside would jeopardize any chance of returning home someday (Bonnin 2009). In fact, to encourage the send-down youths to settle send-down and take root in the rural community, they were subject to the rural marriage age requirement, which was much lower than the urban requirement. We agree with Zhou and Hou (1999) that if the LLF family planning policy had not raised the age at first marriage of the urban population, the difference in age at first marriage between the send-down and non-send-down groups would have been even higher because the very high marriage age of the send-down youths was not related to the LLF policy.
For the remaining two thirds of the urban youths and virtually all of the rural youths who did not experience the send-down, the LLF policy has been the single most important factor that shaped their marriage age. In that sense, our results provide new evidence supporting the notion that, despite the influence of other social, political, and economic processes, the demographic transition in China during the 1970s was mainly driven by the government’s family planning campaign. However, it is worth emphasizing that the
success of the LLF policy depends on the charisma of Mao and the coercive Maoist political system that combines, among other things, People’s Communes in the rural areas and work units in the urban areas. After all, if a government can send millions of urban youths to the countryside and keep them there for years, how hard can it be to make people delay marriage, postpone childbirth, or have fewer babies? With Mao gone and many of the Maoist institutions abolished, however, it is no longer the case. This may explain why the post-Mao Chinese leaders decided to terminate the LLF policy and replace it with the one-child policy. Although it is not easy to “persuade” a woman to undergo sterilization or intrauterine device (IUD) insertion, it is a onetime, irreversible process: once it is done, it is safe to move on to the next target.10 By contrast, the LLF policy would require
nonstop monitoring, persuasion, and intimidation ofallwomen of childbearing age. In fact, the send-down policy may also have contributed to this policy change: the end of the send-down policy in 1978 brought millions of sent-down youths, most of whom were unmarried, unemployed, and unprepared for urban life, back to the cities. In the next few years, public security deteriorated and crime, especially sex crime, surged. Under this circumstance, the LLF policy, especially the late marriage part, has become too expensive to continue.
The send-down policy in 1967–1978 disrupted the life course of over 17 million young Chinese men and women, approximately a third of the whole generation of urban youths. The short- and long-term consequences of such life course disruption has re-mained largely unknown until recently. Largely because of work of Zhou and Hou (1999) and Xie, Jiang, and Greenman (2008), we now have some knowledge of the impact of the send-down experience on people’s long-term socioeconomic outcomes. Our results show that the send-down policy also has important demographic consequence. Since marriage is the beginning of a series of life course events, one cannot help wondering whether an abrupt delay of 1.2 years in marriage timing would inevitably influence subsequent events such as childbearing, childrearing, marital stability, living arrangement, and old-age sup-port provision. Answers to these questions may provide new insights to better understand the patterns and trends of urban Chinese life in the post-Mao era.
7. Acknowledgements
Shige Song’s research is supported by Queens College, CUNY. Lu Zheng’s research is supported by the “221 Basic Research Plan for Young Faculties” from Tsinghua Univer-sity. The data used in this paper are from the China Family Panel Studies, funded by the 985 Program of Peking University and carried out by the Institute for Social Science Survey of Peking University.
References
Angrist, J.D. and Pischke, J.S. (2009). Mostly Harmless Econometrics: An Empiricist’s Companion. Princeton: Princeton University Press.
Bernstein, T.P. (1977). Up to the Mountains and down to the Villages: The Transfer of Youth from Urban to Rural China. New Heaven: Yale University Press.
Bongaarts, J. and Greenhalgh, S. (1985). An Alternative to the One-Child Policy in China.Population and Development Review11(4): 585–617.doi:10.2307/1973456.
Bonnin, M. (2009). The Lost Generation: The Sent-down Movement in China, 1968– 1980 (in Chinese). Hong Kong: Chinese University of Hong Kong Press.
Carsey, T.M. and Harden, J.J. (2013).Monte Carlo Simulation and Resampling Methods for Social Science. Thousand Oaks, CA: Sage.
Coale, A.J. (1984). Rapid Population Change in China, 1952–1982. Washington, D.C.: National Academies Press.
Deng, Z. and Treiman, D.J. (1997). The Impact of the Cultural Revolution on Trends in Educational Attainment in the People’s Republic of China 1. American Journal of Sociology103(2): 391–428.doi:10.1086/231212.
Dunning, T. (2012). Natural Experiments in the Social Sciences: A Design-Based Ap-proach. Cambridge, UK: Cambridge University Press. doi:10.1017/CBO9781139084444.
Feeney, G., Wang, F., Zhou, M., and Xiao, B. (1989). Recent Fertility Dynamics in China: Results from the 1987 One Percent Population Survey.Population and Development Review15(2): 297–322.doi:10.2307/1973706.
Gelman, A. and Hill, J. (2006). Data Analysis Using Regression and Multilevel/ hierarchical Models. New York, NY: Cambridge University Press. doi:10.1017/CBO9780511790942.
Greenhalgh, S. and Bongaarts, J. (1987). Fertility Policy in China: Future Options.
Science235(4793): 1167–1172.doi:10.1126/science.3823877.
Greenhalgh, S. and Winckler, E.A. (2005).Governing China’s Population: From Leninist to Neoliberal Biopolitics. Stanford: Stanford University Press.
Hussain, A. (2002). Demographic Transition in China and Its Implications. World development30(10): 1823–1834.doi:10.1016/S0305-750X(02)00070-0.
Hyndman, R.J. (1996). Computing and Graphing Highest Density Regions.The American Statistician50(2): 120–126.doi:10.2307/2684423.
Iacus, S., King, G., and Porro, G. (2009). Cem: Software for Coarsened Exact Matching.
Journal of Statistical Software30(9): 1–27.doi:10.18637/jss.v030.i09.
Iacus, S., King, G., and Porro, G. (2011). Causal Inference Without Balance Checking: Coarsened Exact Matching.Political analysis20(1): 1–24.doi:10.1093/pan/mpr013.
Iacus, S., King, G., and Porro, G. (2011). Multivariate Matching Methods That Are Monotonic Imbalance Bounding. Journal of the American Statistical Association
106(493): 345–361.doi:10.1198/jasa.2011.tm09599.
King, G., Tomz, M., and Wittenberg, J. (2000). Making the Most of Statistical Analyses: Improving Interpretation and Presentation. American Journal of Political Science
44: 347–361.doi:10.2307/2669316.
Lavely, W., Lee, J., and Wang, F. (1990). Chinese Demography: The State of the Field.
The Journal of Asian Studies49(04): 807–834.doi:10.2307/2058237.
Morgan, S.L. and Winship, C. (2015). Counterfactuals and Causal Inference: Methods and Principles for Social Research. Cambridge: Cambridge University Press.
Murnane, R.J. and Willett, J.B. (2010). Methods Matter: Improving Causal Inference in Educational and Social Science Research. New York: Oxford University Press.
R Core Team (2014).R: A Language and Environment for Statistical Computing. Vienna, Austria: R Foundation for Statistical Computing.
Scharping, T. (2003).Birth Control in China, 1949–2000: Population Policy and Demo-graphic Development. London, New York: Routledge.
Stuart, E.A. (2010). Matching Methods for Causal Inference: A Review and a Look Forward. Statistical science: a review journal of the Institute of Mathematical Statistics25(1): 1–21.
Unger, J. (1982). Education Under Mao: Class and Competition in Canton Schools, 1960–1980. New York: Columbia University Press.
Walder, A.G. (2009).Fractured Rebellion. Cambridge, MA: Harvard University Press.
Walder, A.G., Li, B., and Treiman, D.J. (2000). Politics and Life Chances in a State Socialist Regime: Dual Career Paths into the Urban Chinese Elite, 1949 to 1996.
Wang, F. and Yang, Q. (1996). Age at Marriage and the First Birth Interval: The Emerging Change in Sexual Behavior Among Young Couples in China. Population and De-velopment Review22(2): 299–320.doi:10.2307/2137436.
Xie, Y., Jiang, Y., and Greenman, E. (2008). Did Send-down Experience Benefit Youth? A Reevaluation of the Social Consequences of Forced Urban-Rural Migration During China’s Cultural Revolution. Social Science Research 37(2): 686–700. doi:10.1016/j.ssresearch.2007.08.002.
Appendix
The regression models are self-explanatory.11 The coarsened exact matching (CEM)
pro-cedures and results, however, need further explanations and clarifications.
Two sets of CEM analysis were conducted. The first set of analysis included a dichotomous treatment indicator showing whether a respondent was ever sent-down or not. The second set of analysis included a trichotomous treatment indicator showing whether a respondent was ever sent-down and, if so, whether the respondent stayed in the sent-down place for over six years or not. Both sets of analysis began withexact matching
on all six covariates.
Exact matching
Exact matching was conducted using theMatchIt package (Ho et al. 2011). Table 1 reports key descriptive information about the exact matching operation using education, ethnicity, household registration status at age 12, province of residence at age 12, birth cohort, and family class element during the Cultural Revolution. More than 94% of the non-send-down group (G0) and more than 62% of the send-down group (G1) were not matched, and thus were excluded from the subsequent analysis. Dropping cases from the G0group increases variance, which is not a big problem, but dropping so many cases from theG1group increases bias, which is a big problem.
Table 1: Number of total, matched, and unmatched cases of exact matching
G0 G1
All 3, 342 318
Matched 188 120
Unmatched 3, 154 198
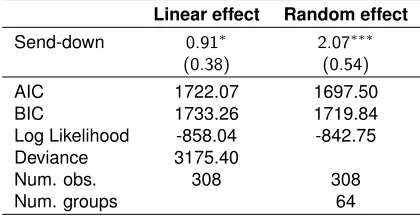
Table 2 reports two estimates of the send-down effect on women’s age at first mar-riage using the exactly matched sample described in Table 1. As described in the main text, the linear effect estimate comes from the complete pooling model, whereas the ran-dom effect estimate comes from the semi-pooling model (Gelman and Hill 2006). In the current case, the two estimates are significantly different from each other (the random
effect estimate is more than twice the size of the linear effect estimate) because they han-dle the hierarchical data structure produced by the matching operation differently. The complete pooling model ignores between-stratum heterogeneity, which reduces variance but increases bias. The semi-pooling model, by contrast, balances variance and bias by imposing a parametric distribution (e.g., normal) on the between-stratum heterogeneity.
Table 2: Linear and random effect estimates of the send-down effect, obtained from exact matching
Linear effect Random effect
Send-down 0.91∗ 2.07∗∗∗
(0.38) (0.54)
AIC 1722.07 1697.50 BIC 1733.26 1719.84 Log Likelihood -858.04 -842.75 Deviance 3175.40
Num. obs. 308 308 Num. groups 64
Note:∗∗∗p<0.001,∗∗p<0.01,∗p<0.05
The next step is to test whether send-down duration influences women’s age at first marriage, and, if so, to what extent. Table 3 reports linear effect estimates of short-term (i.e., for less than six years) and long-term (i.e., for six years and more) send-down. Based on this exactly matched subsample, send-down has a significant effect on women’s age at first marriage only when the duration is over six years. It will be interesting to see the corresponding random effect estimates but, unfortunately, after splitting the sample, random effect models begin to have numerical problems and cannot be estimated.
Table 3: Linear effect estimates of the effect of different send-down duration, obtained from exact matching
Sent-down duration
Less than six years Over six years
Send-down 0.174 1.542∗ (0.409) (0.610)
N 234 129
In summary, in the current case, exact matching produced results with high variance and high bias because it discarded more than 94% of the control group cases and more than 62% of the treatment group cases.
Coarsened exact matching
Coarsened exact matching (CEM) aims to address the problem. CEM is a natural and straightforward extension of exact matching: for matching variables with a small number of categories, we can apply exact matching directly; for those with a large number of cat-egorizes, we can first coarsen them (to reduce the number of categories), then we apply exact matching on the coarsened version of these variables. Among the six matching vari-ables used in this study, level of education (four categories), ethnicity (two categories), and household registration status at age 12 (two categories) do not need coarsening and will be matched exactly. Birth cohort (14 categories), province of residence at age 12 (27 categories), and family class element during the Cultural Revolution (20 categories) will be coarsened and matched.
Following Iacus, King, and Porro (2009), the CEM algorithm involves the following steps:
1. Temporarily coarsen the control variables of choice according to user-defined cut-points.
2. Create one stratum per unique combination of the coarsened control variables, and place each observation in a stratum.
3. Prune from the data set observations in any stratum that do not include at least one treatment and one control unit.
Letf andgbe the relative empirical frequency distributions for the treatment and control groups. Letfl1...lkbe the relative frequency for observations belonging to the cell with
coordinatesl1...lk of the multivariate cross-tabulation of the treatment units andgl1...lk
for the control units. Balance between the treatment and control group is given by theL1
statistics (Iacus, King, and Porro 2011):
L1(f,g) =
1 2
X
l1...lk
|fl1...lk−gl1...lk| (1)
L1ranges between 0 and 1 with larger values indicating larger imbalance between
the treatment and control groups. However, theL1is not valuable on its own. It should
The effect of being sent-down
When implementing CEM, one needs to strike a balance between too much coarsen-ing and not enough coarsencoarsen-ing. Not enough coarsencoarsen-ing means a lot of cases cannot be matched and will be discarded; too much coarsening means some of the matched cases are less comparable than others, which can contaminate the results and weaken the causal in-ference. In this analysis, birth cohort was coarsened into four 3-year groups (1947–1949, 1950–1952, 1953–1955, and 1956–1958) and one 2-year group (1959–1960). Province of residence at age 12 was coarsened into seven groups, including: (1) Municipali-ties directly under the Central Government (Beijing, Tianjin, and Shanghai), (2) North China (Hebei, Shanxi, and Neimenggu), (3) North East (Liaoning, Jilin, Helongjiang), (4) East China (Jiangsu, Zhejiang, Anhui, Fujian, Jiangxi, Shandong), (5) South Cen-tral (Henan, Hubei, Hunan, Guangdong, Guangxi), (6) South West (Sichuan, Yunnan, Guizhou, Xizang), and (7) North West (Shaanxi, Gansu, Ningxia, Xinjiang, Qinghai). The 20-category family class element was coarsened into three groups representing the “bad” (exploiting) class (e.g., landlord, rich peasant, capitalist, etc.), the “good” (ex-ploited) class (e.g., poor peasant, farm labor, industrial worker, etc.), and everybody in between (e.g., middle peasant, street peddler, small handicraftsman, etc.).
Table 4 reports information of the abovementioned CEM. On one hand, the coarsen-ing improves the exact matchcoarsen-ing reported in Table 1 significantly by reduccoarsen-ing the number of unmatched cases from the treatment group from 198, which is more than 60% of the treatment group, to 60, which is less than 20% of the treatment group. On the other hand, CEM drastically reduces the global imbalance between the treatment and control groups from 0.910 to 0.575. More importantly, these gains were achieved by sacrificing some subtleties (e.g., the difference in the send-down probability between “rich peasant” and “landlord” classes) without compromising the fundamentals (e.g., the difference in the send-down probability between the “good” and “bad” classes).
Table 4: Descriptive information of coarsened exact matching
G0 G1
All 3, 342 318
Matched 796 258
Unmatched 2, 546 60 L1= 0.575
Table 5: Effect of send-down (dichotomous) on women’s age at first marriage using coarsened exact matching
Estimate Std. Error
Linear effect 1.007 0.229
Random effect 1.200 0.045
The effect of send-down duration
The next step of the analysis is to investigate whether short-term send-down (i.e., for less than six years) and long-term send-down (i.e., for more than six years) have different impacts on women’s age at first marriage. This is a straightforward extension of the models reported in Tables 4 and 5: Instead of a dichotomous treatment variable (0 = non-sent-down,1 =sent-down), here we have a trichotomous one (0 =non-sent-down, 1 =sent-down for less than six years,2 =sent-down for over six years) and we need to match the two sent-down groups against the non-sent-down group separately.
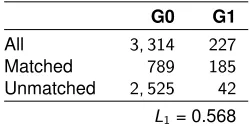
Tables 6 and 7 report the number of total, matched, and unmatched cases from these two CEMs as well as the level of imbalance. In the first CEM, between women who were never sent-down and those who were sent-down for less than six years, 18% of the treatment group were not matched. In the second CEM, between women who were never sent-down and those who were sent-down for more than six years, 20% of the treatment group were not matched. The sum of the unmatched treatment group cases equals the number of unmatched treatment group cases in Table 4.
Table 6: Descriptive information of coarsened exact matching (send-down for less than six years)
G0 G1
All 3, 314 227
Matched 789 185
Unmatched 2, 525 42 L1= 0.568
Table 7: Descriptive information of coarsened exact matching (send-down for more than six years)
G0 G1
All 3, 314 119
Matched 301 93
Unmatched 3, 013 26 L1= 0.649
Table 8: Effect of short-term send-down (less than six years) on women’s age at first marriage using CEM
Estimate Std. Error
Linear effect 0.360 0.238
Random effect 0.489 0.048
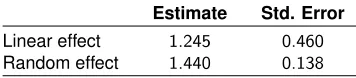
Table 9: Effect of long-term send-down (more than six years) on women’s age at first marriage using CEM
Estimate Std. Error
Linear effect 1.245 0.460