IN JAVA AND BALI
BY
JULIANTI KADARUSMAN
A thesis submitted in partial fulfilment of the requirements for the degree of
Master of Arts in Demography at the Australian National University
Canberra
Except where otherwise indicated, this thesis is my own work.
ACKNOWLEDGEMENTS
I would like to express my gratitude to Dr. Terence T. Hull, my supervisor and Dr. Peter F. McDonald, my advisor. This thesis would not have been completed without their encouragement, guidance and constructive suggestions.
I am grateful to Dr. Helen Ware and Dr. P. H. Reddy for their comments and constructive suggestions on the final draft of this thesis.
I am grateful to Mrs. J. Widdowson for her assistance in setting the computer subset and program for the calculations. I wish to thank Dr. D. W. Lucas and Dr. S. K. Jain for their useful lectures, also to Mr. Peter Waddell-Wood for his assistance and encouragement during the course work and thesis years, and thanks to Mrs. Chris McMurray for her assistance in correcting the text of the thesis. As well, I am grateful to Mrs. Pat Quiggin and all the staff of the Menzies Library for their assistance with references.
I would also like to thank the Australian Goverment for providing me the scholarship and the Australian National University for giving me the opportunity to participate in the M.A. program in Demography.
ABSTRACT
D a t a b a s e d on v i t a l r e g i s t r a t i o n i n I n d o n e s i a a r e i n c o m p l e t e and i n a c c u r a t e . B e c a u s e o f t h i s m o r t a l i t y e s t i m a t e s f o r t h e l a s t t wo d e c a d e s h a v e b e e n d e r i v e d i n d i r e c t l y f r o m c e n s u s a n d s u r v e y d a t a . The e s t i m a t i o n p r e c e d u r e s u s e d w e r e m o s t l y t h e B r a s s - t y p e t e c h n i q u e s . The v a l i d i t y o f t h e e s t i m a t e s h a s b e e n d i f f i c u l t t o v e r i f y b e c a u s e o f a l a c k o f c o m p a r a b l e d a t a . I n t h i s t h e s i s a n a l t e r n a t i v e a p p r o a c h o f e s t i m a t i o n i s u s e d t o p r e s e n t s ome d a t a f o r c o m p a r i s o n .
The s t u d y h a s e x a m i n e d t h e l e v e l s , t r e n d s a n d d i f f e r e n t i a l s o f i n f a n t a n d c h i l d m o r t a l i t y i n J a v a an d B a l i . The m a i n a n a l y s i s i s b a s e d on t h e 1976 I n d o n e s i a F e r t i l i t y S u r v e y d a t a on p r e g n a n c y h i s t o r i e s a n d a p p l y i n g t h e B i r t h C o h o r t S u r v i v a l M e t h o d .
I n g e n e r a l , t h e r e s u l t s o f t h i s s t u d y c o n f o r m w i t h t h e p r e v i o u s e s t i m a t e s o f h i g h i n f a n t a n d c h i l d m o r t a l i t y a n d a t r e n d t o w a r d s l o w e r m o r t a l i t y l e v e l s o v e r t h e r e c e n t p a s t . The r e s u l t s a l s o r e v e a l m o r t a l i t y d i f f e r e n c e s a c c o r d i n g t o p r o v i n c e , u r b a n - r u r a l r e s i d e n c e , m o t h e r ' s c h i l d h o o d r e s i d e n c e , s o c i o e c o n o m i c s t a t u s , b i r t h o r d e r , a g e
o f m o t h e r an d t h e s e x o f t h e c h i l d .
CONTENTS
Page
ACKNOWLEDGEMENTS i
ABSRACT i i
LIST OF TABLES v i
LIST OF FIGURES i x
LIST OF APPENDICES x
CHAPTER I : INTRODUCTION 1
1.1 The O b j e c t i v e o f t h e S t u d y 1
1 . 2 D a t a f o r t h e S t u d y 2
1 . 3 I n d i r e c t M et ho d s o f C h i l d M o r t a l i t y E s t i m a t i o n 4
1 . 3*1 B r a s s - t y p e M et hods o f M o r t a l i t y E s t i m a t i o n 5
1 . 3 * 2 P r e s t o n - P a l l o n i Method o f M o r t a l i t y
E s t i m a t i o n 7
1 . 3 * 3 B i r t h C o h o r t S u r v i v a l Method 8
1 . 3 * 4 M et ho d s Used i n T h i s S t u d y 9
1 . 3 * 5 I n d i c a t o r s o f C h i l d M o r t a l i t y 10
1 . 4 F a c t o r s A f f e c t i n g M o r t a l i t y : A Re vi ew 11
CHAPTER I I : THE STUDY AREA AND THE GENERAL MORTALITY SITUATION 14
2.1 The S t u d y Ar ea 14
2 . 1 . 1 G e o g r a p h i c a l P i c t u r e 14
2 . 1 . 2 The P o p u l a t i o n I n G e n e r a l 16
2 . 1 . 3 S o c i a l and Economic C h a r a c t e r i s t i c s 16
2 . 2 The G e n e r a l M o r t a l i t y S i t u a t i o n 22
2 . 2 . 1 The V i t a l R e g i s t r a t i o n S y s t e m i n
I n d o n e s i a 22
2 . 2 . 2 The L e v e l s and T r e n d s o f I n f a n t and
2.2.3 Causes of Death 32
CHAPTER III : PLACE OF RESIDENCE AND CHILD MORTALITY 37 3.1 Provincial Differences in Childhood Mortality 37 3-2 Urban and Rural Child Mortality Differentials 44 3«3 Childhood Residence of Mother and Child
Mortality 49
CHAPTER IV : MORTALITY DIFFERENTIALS BY SOCIOBIOLOGICAL FACTORS 53
4
.1 Sex Differentials in Childhood Mortality 534.2 Mortality Differentials Associated with
Mother's Age and Birth Order 60
4.2.1 Mortality Differentials by Age of Mother 62 4.2.2 Mortality Differentials by Birth Order 67 4.2.3 Mortality Differentials by Maternal Age
and Birth Order 70
4.3 Breast-feeding and Infant and Early Childhood
Mortality 73
CHAPTER V : SOCIO-ECONOMIC FACTORS AND CHILD MORTALITY 81 5.1 The Impact of Parents' Education on Infant
and Child Mortality 83
5.1.1 Mother's Education 83
5.1.2 Mother's Literacy 88
5.1.3 Father's Education and Literacy 91 5.1.4 Parents' Education and Literacy 93 5.2 Parents' Occupation and Childhood Mortality 96
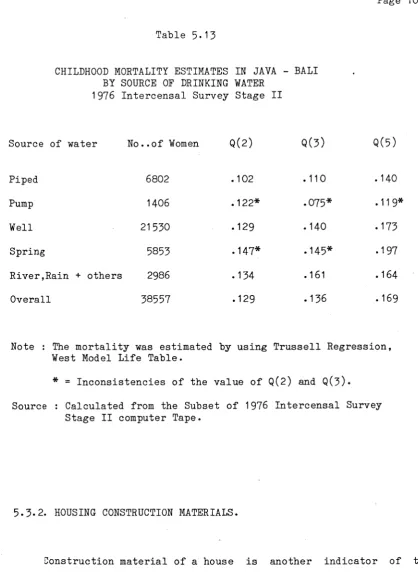
5.3 Housing Condition 102
5.3.1 Drinking Water Supply 103
CHAPTER VI : SUMMARY AND CONCLUSION 110 6.1 Levels and Trends of Infant and Child
Mortality 110
6.2 Variations in Mortality Among the Provinces
and Urban-Rural Residence 11 1
6.3 Socioeconomic Factors and Child Mortality 112 6.4 Mortality Differentials by Sex, Age of Mother
and Birth Order 114
6.5 Concluding Remarks 114
REFERENCES 1 1 7
LIST OF TABLES
Number Heading Page
2.1 Population Distribution and Density in Java and Bali,
by Province in 1976. 17
2.2 Childhood Mortality Estimates Derived from the 1961 Census Data on Child Survivorship in Three Provinces
Using Brass Multipliers. 27
2.3 Proportion of Children Dead Before Age 1, 2 and 5
in Java and Bali, 1976 Indonesia Fertility Survey. 29 2.4 Some Estimates of Infant Mortality in Java Around 1970 32 2.5 Estimation of Causes of Death in Java, 1972 by Broad
Age Groups (percentages). 34
3.1 Infant and Child Mortality Estimates by Province,
1976 Indonesia Fertility Survey. . 39
3.2 Index of Provincial Child Mortality Compared to the Lowest Mortality up to Age Two and Five,
1976 Indonesia Fertility Survey. 40
3*3 Usual Age at Weaning by Province (in percentage). 42 3.4 Proportion of Children Dead by Place of Residence
(Urban-Rural), 1976 Indonesia Fertility Survey 47 3.5 Proportion of Children Daed Under Age Five by Province
and Urban-Rural Residence, 1976 Indonesia
Fertility Survey. 48
3.6 Percentage of Ever Married Women According to Level of Education by Childhood Place of Residence,
1976 Indonesia Fertility Survey. 50
3.7 Proportion of Children Dead According to Childhood Place of Residence of Mother,
1976 Indonesia Fertility Survey. 51
4.1
Mortality Estimates by Sex of Children in Javaand Bali, 1976 Indonesia Fertility Survey. 57 4.2 Ratio of Male to Female Child Mortality. 58 4.3 Ratio of Male to Female Infant and Child Mortality
4*4 Proportion of Children Dead up to Age One and Between Age One and Exact Age Five by Sex in Java and Bali,
1976 Indonesia Fertility Survey. 60
4*5 Percentage Distribution of Live Births in Java and Bali Between 1961 and 1973 by Birth Order and Age of Mother,
1976 Indonesia Fertility Survey. 64
4.6 Proportion of Children Dead Under Age One and Two from Birth Cohort 1961-73 by Age of Mother,
1976 Indonesia Fertility Survey. 65
4.7 Proportion of Children Dead Under Age one and Two from Birth Cohort 1961-73 by Birth Order,
1976 Indonesia Fertility Survey. 68
4.8 Proportion of Infant Dead of Birth Cohort 1961-73 According to Birth Order and by Age of Mother at
Birth of Child, 1976 Indonesia Fertility survey. 71 4.9 Mean Length of Breast-feeding in the Last Closed
Interval by Selected Background Variables,
1976 Indonesia Fertility Survey. 76
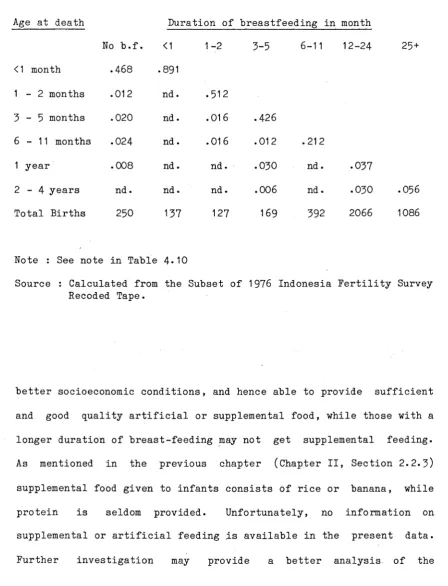
4.10 Proportion of Infant and Child Dead by Duration of Breast-feeding in Closed Interval,
1976 Indonesia Fertility Survey. 78
4.11 Proportion of Infant and Child Dead by Duration of Breast-feeding in Open Interval,
1976 Indonesia Fertility Survey. 79
5.1 Level of Education of Mothers and Urban-Rural Residence
1976 Indonesia Fertility Survey. 85
5.2 Infant and Child Mortality Estimates by Education of Mother and Urban-Rural Residence,
1976 Indonesia Fertility Survey. 87
5*3 Infant and Child Mortality Estimates by Literacy of Mother and Urban-Rural Residence,
1976 Indonesia Fertility Survey. 89
5.4 Percentage of Ever Married Women (aged less than 50) by Education and Literacy, 1976 Indonesia Fertility
Survey. 90
5.5 Infant and Childhood Mortality Estimates in Java and Bali by Father's Education and Literacy,
1976 Indonesia Fertility Survey. 92
5.6 Probability of Dying Before Age 1, 2 and 5 in Java and Bali by Education of Mother and Father,
5.7 Index of Child Mortality Compared to the Highest Mortality before Age 1, 2 and 5 by Education of
Mother and Father, 1976 Indonesia Fertility Survey. 95
5.8 Proportion of Infant and Child Dead of Birth Cohort
1961-73 by Literacy of Father and Mother,
1976 Indonesia Fertility Survey. 96
5.9 Probability of Infant and Child Mortality in Java
and Bali by Occupation of Father, 1976 Indonesia
Fertility Survey. 99
5.10 Probability of Infant and Child Mortality in Java and Bali by Occupation of Mother,
1976 Indonesia Fertility Survey. 100
5-11 Probability of Infant and Child Mortality in Java-Bali
According to Pattern of Work of the Mother,
1976 Indonesia Fertility Survey. 101
5. 12 Percentage of Households in Java According to Source
of Drinking Water in 1976, Intercensal Survey Stage II. 104
5. 13 Childhood Mortality Estimates in Java-Bali
of Drinking Water, 1976 Intercensal Survey
by Source
Stage II. 106
5.14 Childhood Mortality Estimates in Java-Bali
Housing Construction Material (Floor).
by
107
5.15 Childhood Mortality Estimates in Java and Bali by
Figure 1 : Infant and Child (up to age 2) Mortality by Age of Mother at Confinement.
Figure 2 : Infant and Child (up to age 2) Mortality by Birth Order.
[image:11.550.35.525.161.774.2]LIST OF APPENDICES
Appendix I
Appendix II
Appendix III
Appendix IV Appendix V
Appendix VI
Supplementary Regression Equations for Estimating Child Mortality, Preston-Palloni Method.
Regression for Estimating T (Time Reference Prior to the Survey), Preston-Palloni Method.
Trussell Estimates of Q(2) and Q(3) Based on the 1971 Census and the 1976 Intercensal Survey Stage II.
Number of Women in the 1976 Indonesia Fertility Survey. The Probability of Error in the Analysis of Child Mortality According to Father's Characteristics.
I N T R O D U C T I O N
1.1 THE OBJECTIVE OF THE STUDY
Since the Second World War mortality has been declining in many developing countries. In Indonesia however, the trend of mortality decline was not as rapid as observed in some neighbouring countries, such as Malaysia, Singapore, Hong Kong and Philippines. Some factors have been claimed to have contributed to these relatively slow declines, among other things are delay in community health and sanitation programs, instability in food supply which had hampered some communicable-disease eradication programs, relatively high cost of medicines compared to income and imbalance between increases in the prices of food and income per capita (Heligman, 1976:1).
The crude death rate of Indonesia on average through the 1960s was estimated at about 20 per 1000 (Cho et a l , 1980:11) and 16 per 1000 in 1975 (Quick, 1979:7, Table 3)* About 50 per cent of the total deaths were attributed to infant and child deaths under age five. The infant mortality rate was estimated at about 130 to 144 per 1000 live births during the late sixties, and one fifth of the babies born in
Java never celebrated their fifth birthday (Rohde et a l , 1978:65).
country. In view of the high rates of infant and child mortality which are believed to have hitherto prevailed in Indonesia, the study of trends, levels and differentials is particularly important.
The purpose of this study is to investigate the impacts of the various demographic characteristics of the population in Java and Bali on their infant and child survivorship. The study will analyse the levels and trends of infant and child mortality in Chapter II, impacts of place of residence in Chapter III, socio-biological factors in Chapter IV and socioeconomic factors in Chapter V.
1.2. DATA FOR THE STUDY.
The present study will mainly use the 1976 Indonesia Fertility Survey and for some household conditions (in chapter V) will be based on the 1976 Intercensal Survey Phase II (SUPAS II). These two surveys are parts of the three integrated phases of the Intercensal Population Survey carried out in 1976 by the Indonesian Central Bureau of Statistics.
Phase I aimed at estimating the summary statistics at the level of domains (1). It involved a large household listing collecting a selected amount of information on name, family relationship, sex, age, marital status and own mother status of all members of the households selected as the samples.
Phase II (SUPAS II) collected more detailed information from a sub-sample of respondents selected in Phase I, and covered both the household and individual characteristics. Informations collected are marital history, own children, contraceptive knowledge and practice, religion, education/literacy, household composition, household conditions, population movement and fertility.
Phase III or the 1976 Indonesia Fertility Survey was carried out in line with the series conducted in other countries as part of the World Fertility Survey. The survey covered the islands of Java and Bali and was conducted over a multi-stage probability sample of around 10,500 households. The sample domains were the six provinces in Java and Bali.
Each sample household was interviewed using a household schedule, in which certain basic characteristics of the population were listed. On the basis of these data ever married woman under 50 years of age were selected for a more detailed individual interview. The questionnaire is based on the standard version prepared by the World
Fertlity Survey and used in many developing countries which have participated in that programme. The household schedule is of the type widely used in censuses and household surveys. The individual questionnaire includes sections on detailed maternity and marriage histories, knowledge and use of contraception, fertility regulation and preference and socioeconomic background of ever married women and their husbands. In addition, questions on abortion and on availability and use of family planning services were also included because of their specific interest in Indonesia.
The present analysis will make use of the information of pregnancy histories, the number of children ever born and the number of children who had died by the time of survey, and the background variables of the parents.
1.3. INDIRECT METHODS OF CHILD MORTALITY ESTIMATION.
1.3.1 BRASS-TYPE METHODS OF CHILD MORTALITY ESTIMATION.
One of the most widely used techniques was formulated by Brass (Brass and Coale 1968; Brass, 1975)* This method is based on the assumption that the proportion of dead children by age of mother can be approximated as the level of infant and child mortality. The fit of approximation was found to depend on the starting age of fertility schedule, for which the ratio of the mean number of children born to a woman (denoted as Pi) in the successive age groups, Pi/Pi+1, and mean age at childbearing have been taken as the parameters for approximation. A set of multipliers has been derived for converting Di (proportion of dead children by age of mother) into Q(X) values, the probability of dying from birth to various childhood ages X.
This method has been modified by Sullivan (1972), based on a number of observed fertility distributions combined with the Coale-Demeny Regional Model Life Tables (1966). He developed a linear equation for calculating Q(X)/Di using regression coeffients and the ratio of P2/P3 as a parameter. Later Trussell (1975) introduced a more complicated linear equation based on P1 /P2 and P2/P3 as parameters, also using Coale-Demeny Model Life Tables . Hence the results will depend on the choice of the particular family life table, North, East, South or West, that is considered most appropriate for the population under investigation. However, in the absence of knowledge of the underlying mortality pattern, the West regression is mostly used.
the developing countries with intensive family planning programs and public health measures.
If fertility has been declining at all ages, the reporting women aged 20-24 would have had higher cumulative fertility when they were aged 15-19 than those women currently aged 15-19* Use of the fertility of the latter group to infer the fertility of the older women when they were younger will produce an incorrect index of fertility of the cohort (Preston & Palloni, 1978:73)* However, it is considered that error due to fertility decline would be small, as the Brass method is said to be robust against departures from the assumptions about fertility and mortality patterns (Kraly & Norris, 1978:549; Feeney, 1980:119)*
In the situation of declining mortality, the indirect techniques of mortality estimate can also cause bias, because the estimation derived refers to mortality prevailing at different periods in the past rather than the mortality of a particular period. To overcome this problem, a procedure has been developed. This permits the estimation of the time period for the various mortality estimates that correspond to different age groups of women (Coale & Trussell, 1978; National Academy of Science, 1978). This procedure requires the assumption that mortality has been declining at a constant rate occuring in a linear trend - prior to the survey or census.
collected.
1.3.2. PRESTON-PALLONI METHOD OF MORTALITY ESTIMATION.
Preston and Palloni (1978) have suggested an alternative approach for mortality estimation from child survivorship, in which they use the age distribution of surviving children instead of the time distribution of children born. The age distribution of surviving children can be obtained from the data on births, survivors and the ages of the surviving children in a survey or census. This distribution will provide a picture of the fertility history of the women (Preston & Palloni, 1978:72). If these data are available, then there is no need for fertility indices or model fertility schedules (McDonald, 1980b:11).
Two indices can be obtained from the age distribution of children, one is As, the mean age of surviving children, which provides an approximation to the mean duration of exposure to mortality risk. The other, C(2), the cumulative proportion of surviving children below two years of age, distinguishing between children in their early years when cumulative mortality risks rise rapidly and children who have passed through this stage (Preston & Palloni, 1978:78; Palloni, 1980:138). The regression equation of the relation of Q(X) and D/B (proportion of children dead) is presented in Appendix I.
which the estimated mortality pertained (Appendix II). Preston and Palloni (1978) also contend that the method provides child mortality estimates which are least sensitive to the choice of model family life table and to the assumption of consistency of mortality pattern with the model.
McDonald (1980b:11) suggests that in circumstances where the information on the age distribution of surviving children is available, the Preston-Palloni approach is likely to be a more suitable way of measuring mortality differences than both the conventional age models and duration models.
However, this approach also has some disadvantages compared with the conventional techniques. It requires special data processing and tabulation operation and the calculated age distribution of surviving children is subject to errors resulting from mis-reporting of the ages of the children.
1.3.3. BIRTH COHORT SURVIVAL METHOD.
Since the mis-statement of age at death is likely to be reported at higher ages, especially age under one which is often reported as age one or two, it becomes less important for cohort mortality cumulated to age five. It seems preferable in this method to use Q(5) as an indicator of differential mortality (McDonald, 1976:64). This would imply that births in the immediate five years before the survey could not be included in the analysis, because of the possibility of truncation error (some births would not have reached age five by the time of the survey). The mortality levels observed therefore are restricted to births occuring five or more years prior to the survey. Such an estimation would be somewhat out of date (McDonald, 1980b:7).
1.3.4. METHODS USED IN THIS STUDY.
1.3.5. INDICATORS OF CHILD MORTALITY.
The information on the number of children a woman ever had and the number of those children who had died by the time of the survey is based on retrospective birth history. Some problems may arise from
this retrospective data :
1. Probability of recall lapse on the date of the event, particularly in relation to births and infant deaths occuring a long time ago. 2. There is a possibility of omission of births and infant deaths,
which is difficult to predict.
3. Deaths under age one were reported as occuring at one year of age, this will downward bias the infant mortality rate.
4* The lack of complete information on dates in the birth history. Ideally, these consist of the calendar year and month, but from the reported births, only sixty per cent of the ages in calendar year and months was obtained. In the other remaining cases, only the duration in years since birth was available, with only a small proportion reporting the ages in month (Central Bureau of Statistics & WFS, 1978, Vol.I:64).
5* For the analysis, detailed breakdown of the samples into smaller categories of variables is needed. As this will give a very small sample size for certain categories, the result would be less representative for the subgroup of the population.
age one, two and five (as recorded in the survey) of a certain birth cohort. The analysis will be on three birth cohorts, these are births occuring 15 or more years before the survey (prior to 1961), 10-14 years before the survey (1961-66) and 5-9 years before the survey (1966 — 1971)- It should be kept in mind however, that the results of the estimate might not be the exact level, but at least can be considered as an approximation of the prevailing situation.
1.4. FACTORS AFFECTING MORTALITY : A REVIEW
The declines in mortality have been observed in all parts of the world. Some factors which have been claimed to have contributed to the chances of survival of the human being, are the discovery of medicines, advances in medical knowledge and actions undertaken to improve health and reduce mortality on one hand and general socioeconomic development on another (United Nations, 1963:15).
that disease (McKeown & Brown, 1 9 5 5
;
McKeown & Record, 1 9 6 2;
McKeown et al, 1 9 7 2
;
McKeown, 1 9 7 8).
It is only in recent decades, when the grosser forms of poverty have been eliminated in the developed countries, that "the real effect of freely accessible health care of a high standard can be observed" (Benjamin, 1965:52).In contrast, from the evidence of widespread declines in mortality among the populations in countries at very different levels of socioeconomic growth, Stolnitz (1955, 1956) argues that the socioeconomic changes are of minor significance in explaining the mortality declines. He suggests that credit should be given to the role of international health agencies, the application of medical knowledge and technology in the prevention and control of diseases, and the implementation and expansion of public health and medical services. The roles of these factors have also contributed to the rapid declines in mortality rates in developing countries after the Second World War (United Nations, 1975:107; Arriaga & Davis, 1969:255; Johnson, 1965:527; Stolnitz , 1965).
In Indonesia, the declines in mortality that occured before the extension of the community health-centre program got underway indicates that they were probably the result of factors other than modern medicine. Nitisastro (1970:124) claims that improved food supply and special measures in the eradication of malaria were largely responsible for the rapid decline in the mortality levels before the seventies.
Differentials in mortality levels and trends are affected by a variety of such factors as medical, biological, socioeconomic and cultural conditions that are complexly interrelated. The health condition of an individual or a family is influenced not only by good quality of housing, environment and medical services, but it also depends on various socioeconomic, political and cultural factors such as education, income, personal habits and social customs, which will influence the level of living, nutrition of the family and access to medical services. Besides, human genetic composition and biological factors such as race, sex and age, also have effects on the susceptibility of certain group of people to certain diseases and ailments (United Nations, 1973:108).
In the analysis of the factors affecting mortality differentials, various classifications have been used by various writers, but generally the classification permits a broad distinction between socioeconomic factors on one hand and medical, health and biological factors on the other. (United Nations, 1973:108).
CHAPTER II
THE STUDY AREA AND THE GENERAL CHILDHOOD MORTALITY SITUATION
2.1. THE STUDY AREA
It is not the purpose of this study to analyse or to record in detail the geographical picture of the area being studied. Nevertheless it seems worthwhile presenting the general view of the area and its population and their main characteristics to enhance the meaning and value of the mortality estimates.
2.1.1. GEOGRAPHICAL PICTURE
Indonesia is the biggest archipelagic country in the world. It consists of more than 12,000 islands and islets, of which about 6,000 are inhabited. The archipelago extends from 9 5 0 to 141° East longitude and from 6 ° North latitude to 11° South latitude. The territory covers an area of about 1,888 kilometers from north to south and 5,110 kilometers from east to west, or over some 8 million square kilometers, an area as large as Australia or The United States of America less Alaska (Central Bureau of Statistics, 19T9d).
country. The geographical picture of Java has been discussed in detail elsewhere (1). In brief, the island stretches in an east-west direction almost parallel with the equator, to a distance of 1,000 kilometers. It consists of fertile alluvial lowlands in the northern part, which in the east contains the Rembang plateaux formed of limestone. To the south of this zone are the highlands of hills and low mountain ridges which are also found in Madura island. Further to the south are uplands formed by numerous volcanoes and intermontane basins. At the most southern part lie two plateaux of moderate height (mostly under 400 meters) consisting of limestone and poor soil and forming steep, high cliffs facing the Indian Ocean. The two plateaux are separated by low plains which form the southern part of Central Java. Bali is divided by the central mountains into two regions of lowlands in the northern and southern parts of the island.
The climate and weather are characterized by rainy monsoons. The wet season generally prevails from November to April, and the dry season from May to October. Being within the equatorial region, the country has a high degree of humidity, with an average minimum of 60 per cent. The average temperature in Java and Bali is about 2 5 ° to
28° C.
2.1.2. THE POPULATION IN GENERAL
There are marked regional variations in population density. Java is the most densely populated island in the country. The average population density in 1976 was 621 persons per sq.km. However the density varies from one province to another and also there are great local variations within each province, depending on the economic activities. Where the economic activities are intense, such as in cities, municipalities, capitals of regencies and the adjacent areas around them, there are also concentrations of people (2). The Special Province of Jakarta is the most densely populated.
The annual population growth rate between 1971 and 1980 was 2.0 per cent per annum for Java and 1.7 per cent for Bali. The special province of Jakarta recorded the highest population growth, mainly due to high urbanization. A general view of the population distribution in Java and Bali by province is presented in Table 2.1.
2.1.3. SOCIAL AND ECONOMIC CHARACTERISTICS.
The population in Java and Bali consists of several ethnic groups. The Javanese represent the largest ethnic group. They mostly reside in Central Java and East Java. Next most numerous are the
No.29-Table 2.1.
POPULATION DISTRIBUTION AND DENSITY IN JAVA AND BALI, BY PROVINCE IN 1976.
Province Area (1 ) sq.km.
Total (2) Population
Density per sq.km.
Population(3) Growth
1971-1980
DKI Jakarta 590 5,365,951 9,067 3.94
West Java 46,300 23,453,354 507 2.64
Central Java 34,206 23,556,328 689 1.63
D.I.Yogyakarta 3,169 2,624,138 828 1.08
East Java 47,922 27,102,983 566 1.48
Total Java 132,187 82,102,754 621 2.01
Bali 5,561 2,340,704 421 1.68
All Indonesia 1,904,569 126,093,181 66 2.34
Sources :(1) Central Bureau of Statistics, 1979, Statistical Yearbook of Indonesia 1977, p.4*
(2) Central Bureau of Statistics, 1979, Summary of Indonesian Population by Province and Island 1976.
(3) Hull, T.H. 1981, "Indonesian Population Growth 1971-1980" in Bulletin of Indonesian Economic Studies, Vol.17(l) March, Table 2.
groups, there are also some small ethnic groups such as the Tenggerese who live in the isolated highlands of Tengger in East Java and the Badui who live in the Southern Banten area of West Java. The latter two groups have preserved religious beliefs and practices which contain an element of both Hinduism and indigenious animism. As the most developed island, Java has also attracted poeple from elsewhere in the archipelago and some foreign minorities of Chinese, Arabs, Eurasians, Indians and Europeans. Unlike the people of Java, the Balinese who form the majority of Bali's population preserve the Hindu religion and cultural tradition (Henderson, 1970:93-112).
The majority of the people in Java and Bali are engaged in the agricultural sector, particularly in the growing of rice and some dryland crops. Rice is the main staple food of the people. Smaller numbers of people pursue a variety of other activities and earnings, such as trade and manufacture, or have jobs as civil servants or in the private sector.
Level of Education
respectively. The percentage of illiteracy in rural areas was almost double that which prevails in urban areas, being 22.2 percent in urban areas and 43*6 per cent in rural areas (Central Bureau of Statistics,
1979a:34-36,table 04).
Water Supply and Sewage Disposal
The availability of a clean and safe water supply and an adequate sewage disposal system have an important effect on the environment and the incidence of infectious diseases, especially gastro-intestinal infection such as diarrhea, which is one of the main causes of death among young children.
Except in some parts of the limestone highlands, water is plentiful on the island of Java, but most of the water supply for the households comes from unprotected surface sources. In Java less than ten per cent of the households enjoy piped water. An increasing number of pumps and wells are found to provide water for drinking and cooking purposes, but most of the people still use water from ponds, streams or river, which are also used for watering stock, washing, bathing and the disposal of garbage and human excreta. This condition is observed not only in rural areas, but also in big cities such as the capital Jakarta. The situation is due to ignorance of the people which is aggravated by poor socioeconomic conditions and complicated by poor sewage facilities.
the ditches, the nearby pond, stream, river or ground.
Investigations carried out in metropolitan Jakarta by Gracey et al (1976,1979) indicate that water from the Ciliwung River and adjoining canals was highly contaminated with Enterobacteriaceae. They claim that the high degree of fecal contamination of the environment is a major cause of an immense problem of gastrointestinal infections in Jakarta and probably in many other cities in developing countries in the tropics.
Health and Medical Services
It is a general situation in developing countries that health facilities are not evenly distributed among the regions. Most of the hospitals, clinics, maternity and child health centres, medical professionals and other medical services are concentrated in big cities and towns. As an illustration, in 1968 in Indonesia, there was on average one physician for 23,000 population, but in rural areas there was only one physician for 100 to 200 thousand people. In cities on the other hand, one doctor was available for 5 to 6 thousand citizens (Department of Information, 1969)*
Public health measures were begun in the nineteenth century during the Dutch colonization, but the effort was very limited. In the thirties, despite the Depression, which had a major effect on the Indonesian economy, some improvements and expansion of public health services were introduced in many regions. Nitisastro (1970:92) stated :
After independence the government continued and expanded public health activity, but due to the economic situation in the fifties and sixties, progress deteriorated. With the implementation of the First and Second Five-year Development Plans (Repelita I 1969-74 and Repelita II 1974-79), almost every sub-district has been provided with at least one community health centre. At the end of the second Repelita, 87 per cent of the health centres had a physician
(Departemen Kesehatan, 1978).
Although the community health centres have been extended, the coverage is still very low. It is estimated that only 10 per cent of sick persons are covered by public health services (Departemen Kesehatan, 1978:7)* Many factors contribute to the low utility of the services. Among others are lack of personnel, shortage of medicines, the location of the centres which is affected by transportation facilities in the area, and socioeconomic factors, for instance low income, low levels of education, strong traditional customs and beliefs as well as the availability of other services, particularly of traditional healers in rural areas.
2 . 2 . THE GENERAL MORTALITY SITUATION
2 . 2 . 1 . THE VITAL REGISTRATION SYSTEM IN INDONESIA
Al ong w i t h t h e p o p u l a t i o n c o u n t c o n d u c t e d d u r i n g t h e B r i t i s h
o c c u p a t i o n p e r i o d ( 1 8 1 1 - 1 8 1 6 ) i n J a v a u n d e r L i e u t e n a n t G o v e r n o r S i r
Thomas S t a m f o r d R a f f l e s , b i r t h and d e a t h r e g i s t r a t i o n was a l s o
i n t r o d u c e d i n 1 8 1 5* V i l l a g e h e a d s w i t h t h e h e l p o f v i l l a g e p r i e s t s
we r e d i r e c t e d t o form a r e g i s t e r o f b i r t h s , m a r r i a g e s and d e a t h s whi ch
o c c u r e d w i t h i n t h e i r j u r i s d i c t i o n . The s y s t e m was l a t e r a d o p t e d by
t h e Du tc h c o l o n i a l g o v e r n m e n t when t h e y r e t u r n e d t o J a v a ( N i t i s a s t r o ,
1 9 7 0 : 2 4 - 2 5 ) . A c c o r d i n g t o t h i s a u t h o r :
" R a f f l e s ' d i r e c t i v e s p r o b a b l y c a n n o t be c o n s i d e r e d a s t h e f i r s t i n t r o d u c t i o n o f p o p u l a t i o n r e g i s t e r s i n t o t h e v i l l a g e s s i n c e , a s h a s b e e n p o i n t e d o u t , t h e I n d o n e s i a n k i n g s and p r i n c e s had b a s e d t h e e a r l i e r a d m i n i s t r a t i v e d i v i s i o n o f t h e i r t e r r i t o r y on t h e number o f i n h a b i t a n t s r e p o r t e d by t h e l o c a l and v i l l a g e h e a d s . M o r e o v e r , Du t ch a d m i n i s t r a t o r s , s u c h a s D a e n d e l s , had a l s o a s k e d t h e l o c a l h e a d s t o s u p p l y d a t a on p o p u l a t i o n . N e v e r t h e l e s s , R a f f l e s ' d i r e c t i v e s were n o t o n l y t h e mo st s p e c i f i c , b u t , more i m p o r t a n t l y , w er e t h e model f o r f u t u r e d i r e c t i v e s on t h i s s u b j e c t . A l t h o u g h h i s d i r e c t i v e s c o n c e r n i n g t h e r e g i s t e r s on v i l l a g e i n h a b i t a n t s a r e i n d i c a t i v e o f a p o l i c e s t a t e e a g e r t o k e e p f u l l c o n t r o l o f i t s p o p u l a t i o n , t h e y became t h e main s o u r c e o f p o p u l a t i o n d a t a f o r y e a r s t o c ome . "
I t was n o t u n t i l t h e m i d d l e o f t h e t h i r t i e s t h a t a s e r i o u s e f f o r t
was made t o i m p r o v e t h e s y s t e m . I n 1933, an i m p r ov e d b i r t h
r e g i s t r a t i o n s y s t e m was i n t r o d u c e d by t h e P u b l i c H e a l t h S e r v i c e i n t h e
r e g e n c y o f P u r w o k e r t o i n C e n t r a l J a v a . I n 1934 t h e s y s t e m c o n c e r n i n g
d e a t h was i n t r o d u c e d and i n 1938 t h a t f o r s t i l l b i r t h s . I n t h i s
village head, and resulted in some improvement in the registration system. The system was soon introduced into most parts of the province of Central Java and also into Jakarta (Soedarjono, 1957:6-7;
Iskandar, 1970:11-12).
This system was disrupted by the Second World War and the revolution against Dutch colonization. The system was resumed in 1951 in Central Java and was extended to other parts of the country after
1955 (Iskandar, 1970:12).
Although the Minister of Health still currently administers a registration system of births, deaths and still births, it is on a completely non-statutory basis (there are no legal requirements for registration) and is restricted to Java and Madura and a few selected regencies (Gardiner, 1975:96).
The most comprehensive system is the system of village population registration coordinated and administered by the Ministry of the Interior, which is designed to record changes in village population. Registration is carried out by village headmen and the reports are refered to the Central Bureau of Statistics (Central Bureau of Statistics, 1974).
Java, if a baby dies soon after birth or several days after it, is a customary to bury it in the family's own yard; this death most probably escapes registration.
The effectiveness of the registration system is further aggravated by the lack of awareness of the people as well as of the registrar concerning the importance of registration, the lack of trained officers and lack of law enforcement for neglect of registration. Problems of communication and transportation are another matter and births and deaths are often recorded after a considerable delay or not recorded at all.
A study by Kozo Ueda (cited in Iskandar, 1970:22), comparing the estimated births and deaths based on the 1964 Second Round Demographic Survey and recorded births and deaths in the registration statistics, concluded that the extent of incompleteness of registration of births was 60 per cent and 71 per cent for deaths. Although at present vital registration has been improving, the results are still far from complete and accurate. According to Gardiner (1975) less than 50 per cent of the vital events, as in most developing countries, are registered (3)*
2.2.2 THE LEVELS AND TRENDS OF INFANT AND CHILD MORTALITY.
Little is known about levels, patterns and trends of mortality in
Indonesia before 1961. As mentioned before, deaths reported in the
vital registration system are greatly under-registered. Most
estimates of childhood mortality prior to the 1961 Census were
conjectural and were difficult to verify. They were based on some
form of registration and mostly apllied to urban areas.
Some estimates made by Nitisastro and other studies indicate a great variation of infant mortality rates, ranging from about 150 to
300 per thousand live births for the period during the 1930s.
Nitisastro's suggestion of infant mortality rates for that decade ranging from 225 to 250 per 1000 live births seems to be plausible
(Nitisastro, 1970:104-113).
During the 1940s, due to the Japanese occupation and the
revolution for independence, living conditions deteriorated. A
shortage of food had resulted in an increase in mortality,
particularly among infants and toddlers, and a decrease in fertility.
The extent of these vital changes is not known. However, their
existence can be seen in the age composition reported in the 1961
Census and other post war data. These data show that the number of
survivors of birth cohorts of the forties was exceptionally small when compared with the number of survivors of the preceeding and succeeding
periods, indicating lower fertility, higher mortality or both
(Nitisastro, 1970:119-120). This statement is supported by the
findings of the Indonesia Fertility-Mortality Survey 1973
for the cohorts born in 1945-49, in both urban and rural areas.
During the 1950s, there were improvements in the food situation and other essentials, and also vigorous health campaigns. Based on the reports of the vital registration system, infant mortality rates for 1958 ranged from 21.3 to 178.4 per 1000 live births (Nitisastro, 1970:141). Such a wide range implies inaccuracies in the data collection system. Using the available data on vital registration, de Haas inferred the most probable rates of 100 to 200 per 1000 live births for that period (Quoted in Nitisastro, 1970:143)* Wander (cited in Demographic Institute F.E.U.I. 1974:98) computed an infant mortality rate of 150 per 1000 live births for the period 1954-1958.
Due to economic and political problems during the sixties, the 1961 Census data processing was disrupted. Only data for East Java, Jakarta and Yogyakarta were tabulated. Based on the information on the number of children still surviving from the number of children ever born by age of mother, and applying the Brass multipliers, Iskandar (1970:123-124) and McNicoll and Mamas (1973:43) derived the childhood mortality estimates for those provinces (See Table 2.2). There are some discrepancies between these two studies, but the reason is not clear (McDonald et a l , 1976:55)* The mortality estimates shown in Table 2.2 indicate quite high mortality during the fifties. About a quarter of the children born in the mid-fifties died before the age of five.
whole or its provinces separately and other provinces in Indonesia have been derived by some studies by applying different methods of estimation. McNicoll and Mamas (1973:13) by using the Brass Multipliers, derived estimates of Q(2), Q(3) and Q(5) for Java of
.156, .183 and .208 respectively. By applying Trussell Regression Coefficients and the West Model, Hull and Sunaryo (1978:30) derived an estimate for Q (2) of .176 and Q(3) of .191 which applied for the latter half of the 1960s.
Table 2.2.
CHILDHOOD MORTALITY ESTIMATES DERIVED FROM THE 1961 CENSUS DATA ON CHILD SURVIVORSHIP IN THREE
PROVINCES USING BRASS MULTIPLIERS.
Province Mortality estimate by
Iskandar *) McNicoll&Mamas **)
Q(2) Q(5) Q(2) Q(5)
Jakarta .247 «267 .237 .263
East Java .225 «251 .218 .245
Yogyakarta n.a. n.a. .139 .207
Note : Q(x) denotes the probability of death before exact age x for all children.
n.a. = not available.
Sources : *) Iskandar, N. 1970, Some Monographic Studies on the Population in Indonesia, pp. 123, 125 (Table 7 & 9)* **) McNicoll & Mamas, 1973, The Demographic Situation
By assuming that the pattern of child mortality was fitted to the Coale-Demeny West Model Life Table, based on the Q values they have derived, McNicoll and Mamas also inferred an infant mortality rate of 133 per 1000 live births in Java and life expectancy at birth of 48 years. Using the same data Cho et al (1976,1980) derived an estimated infant mortality rate of 144/1000 for Java. The discrepancy probably was due to the rejection in their calculation of some regencies and municipalities with very low infant mortality which was considered to be due to under enumeration of children (Cho et a l , 1976:ii). However, this later figure conforms to the findings of McDonald et al
(1976:67-8) from the Indonesia Fertility-Mortality Survey 1973, that during the latter half of the 1960s the infant mortality rate was around 140 per 1000 live births, and almost 210 per 1000 children died before their fifth birthday.
A comparison of childhood mortality rates based on the 1961 and 1971 Censuses results for Jakarta, Yogyakarta and East Java indicated declines of around 25 to 30 per cent in the proportions of children dying before age five during that decade (McNicoll & Mamas, 1973:14). McDonald et al (1976:69-70) also show substantial continuous declines in mortality in all regions of Indonesia since 1945* The mortality rates for children born in the years 1965-67 are only 50 per cent of those applying for children born in the years 1945-49*
mortality rate of 114/1000 derived by Hull and Sunaryo (1978:37,Table 14), using data on the survival of the last birth from the same survey. These latter estimates indicate a decline in infant mortality rates of about 20 per cent during the period from the late sixties to early seventies. The estimated childhood mortality rate also shows the same trend. A comparison of the estimates based on the 1971 Census and the 1976 Intercensal Survey Stage II (SUPAS II) is presented in Appendix III.
Table
2.3-PROPORTION OF CHILDREN DEAD BEFORE AGE 1, 2 AND 5 IN JAVA AND BALI
1976 Indonesia Fertility Survey. (Birth Cohort Survival Method).
Year of birth of child
Q(x) Before 1961 1961-65 1966-70 1971-73
Q (1) .146 .122 .098 .092
Q(2) .189 .162 .124 .117
Q(5) .244 .207 .158 n . a
N 9975 6497 7521 4823
Note : n.a. = not applicable, some of the children had not reached age 5 at the time of the survey.
N = Number of children ever born.
Using pregnancy histories of the women aged 15-49 years collected in the 1976 Indonesia Fertility Survey and the survival of the children ever born, it is possible to infer the proportions of children dead under age five from those born to certain birth cohorts. The Q(1) values based on direct estimation as shown in Table 2.3 are lower than the estimates derived from other methods (Table 2.4). This phenomenon was also found in the analysis of the 1973 FM Survey data, which showed that the reported infant mortality understated the actual level. McDonald et al (1976:64) claim that low measured infant mortality is not an unusual result in surveys of this type. For example, in the analysis of pregnancy histories, Bogue and Bogue (cited in Me.Donald et a l , 1976:64) made a simple adjustment of 25 per cent to the measured infant mortality in Mexico city. According to the Central Bureau of Statistics and WFS (1978, Vol.I:63) the downward bias of these figures is due to the possibility of omission of infant deaths, or another reason is that the probable tendency among respondents to heap deaths at ages such as "one year", which may result in the exclusion of some deaths which actually occured within the first year of life. However, the data do not permit the investigation of the extent to which heaping at one year biases the infant mortality rate downwards.
The figures in Table 2.3 also indicate that the chances of surviving were less for those born in the early cohort than those in the later. The probability of dying for children born in the period 1966 to 1970 was about 35 per cent less than those born before 1961* It is also shown that from all deaths under age five, almost 80 per cent died before reaching age two.
In summary, it is obvious that infant and childhood mortality has been declining since the 1950s, although the exact rates are not known. Based on the results of some estimates as shown in Table 2.4, it seems that an infant mortality rate of 110 to 115 for the period of the early 1970s would be plausible. The declines might be attributed to great changes in the socioeconomic condition of Java's population or to the expansion of the rural health services.
2.2.3. CAUSES OF DEATH
It is assumed that the determination of the cause of death is more accurate when it is made by a qualified person, in most cases a physician. But even so, from the medical point of view, a declaration of cause of death can also raise some problems. Frequently, death is a result of a series of diseases. Difficulties can arise in selecting the cause of death from such a series.
"If a choice is left to the physician, the result may vary widely in accordance with his intellectual and personal
training." (United Nations, 1963:70).
Another problem can also occur. For simplicity of registration and analysis, a single cause of death is required, in this situation, which should be noted, the immediate cause or the long term cause ?
Table 2.4.
SOME ESTIMATES OF INFANT MORTALITY IN JAVA AROUND 1970
NO. Data Source Reference Estimated Method
Period Q(1)
1 1971 Census 1960-70 133 Brass, West Model
2 1971 Census late 1960s 144 Brass, West Model
3 1971 Census 1968 143 Trussell, West Model
4 1973 F.M.Survey late 1960s 140 Sullivan, West Model 5 1976 Intercensal II 1973.4 112 Trussell, West Model 6 1976 Intercensal II 1975.5 114 Survivors last birth 7 1976 Ind.Fe r t .Survey early 1970s 110 Brass, West Model 8 1976 Ind.Fert.Survey early 1970s 116 Brass Logit System
9 1976 Ind.Fert.Survey early 1970s 91 Direct Method
Source : See Bibliography
1. McNicoll & Mamas, 1973:13, Table 3
2. Cho et al, 1976:68, Table 8.1; 1980:20, Table 3 3,5,6. Hull & Sunaryo, 1978:37, Table 14
4
. Me.Donald et al, 1976:68, Table 5*77. Central Bureau of Statistics, 1979b:55, Table 22