DEMOGRAPHIC RESEARCH
VOLUME 34, ARTICLE 13, PAGES 373
−
406
PUBLISHED 1 MARCH 2016
http://www.demographic-research.org/Volumes/Vol34/13/ DOI: 10.4054/DemRes.2016.34.13
Research Article
Distal determinants of fertility decline:
Evidence from 640 Indian districts
Sanjay K. Mohanty
Günther Fink
Rajesh K. Chauhan
David Canning
©2016 Mohanty, Fink, Chauhan & Canning.
This open-access work is published under the terms of the Creative Commons Attribution NonCommercial License 2.0 Germany, which permits use, reproduction & distribution in any medium for non-commercial purposes, provided the original author(s) and source are given credit.
1 Introduction 374
2 Theoretical background 375
3 Rationale and objective 376
4 Data and methods 377
4.1 4.1.1 4.1.2 4.2
Data Outcome
Independent variables Methods
377 377 378 378
5 Results 380
6 Bivariate analysis 389
7 Multivariate results 392
8 Effect sizes and interpretation 394
9
10
Discussion and conclusion
Acknowledgements
396
397
References 398
Distal determinants of fertility decline:
Evidence from 640 Indian districts
Sanjay K. Mohanty1
Günther Fink2
Rajesh K. Chauhan3
David Canning4
Abstract
BACKGROUND
Districts in India exhibit enormous variation in the level of socioeconomic development and are at different stages of fertility transition. Though a large and growing body of literature has examined the proximate determinant of fertility at the state and individual levels, there are limited studies on distal determinants of fertility change in the districts (micro-regions) of India. This is the first ever study to examine the association of fertility change with three key distal determinants, namely female literacy, under-five mortality, and poverty, over the last two decades in districts of India.
OBJECTIVE
To examine the association of female education, under-five mortality, and poverty in fertility reduction in the districts of India.
METHODS
Data from the census of India and large-scale population-based surveys are used. Difference-in-difference panel models are used to account for both initial conditions and contemporaneous changes in fertility reduction.
1 Professor, Department of Fertility Studies, International Institute for Population Sciences , Govandi Station
Road, Deonar, Mumbai- 400088, India. E-Mail: [email protected].
2
Associate Professor of International Health Economics, Department of Global Health and Population, Harvard T. H Chan School of Public Health, Boston, U.S.A. E-Mail: [email protected].
3 Joint Director, Population Research Centre, Department of Economics, University of Lucknow,Lucknow
-226007, India. E-Mail: [email protected].
4 Richard Saltonstall Professor of Population Sciences, and Professor of Economics and International Health,
RESULTS
While one-third of the districts have reached below replacement level of fertility, under-five mortality and poverty level have reduced by half from the initial level and the female literacy level has almost doubled, suggesting a remarkable degree of convergence across all distal determinants but only limited evidence of convergence for fertility. The single largest predictor of fertility reductions in the districts of India was initial TFR (−0.83), followed by increase in female literacy (−0.76), the initial female literacy level (–0.43) and reduction in under-five mortality (–0.20). The effect of initial level of poverty on fertility reduction was 0.13, while that of reduction in poverty was −0.05. Given that the confidence intervals around both estimates are large, this suggests a rather limited role of poverty in fertility transition.
CONCLUSIONS
Reduction in under-five mortality and female education explain the majority of the large fertility declines observed over the study period, while the contribution of poverty to fertility declines is limited.
1. Introduction
The relationship between fertility and its distal as well as proximate determinants has been the subject of a long-standing and continued inquiry among demographers, economists, sociologists, and researchers in other fields. Although a relatively clearly defined set of social, economic, and demographic factors has been identified as the key driver of fertility change in theoretical literature, empirical evidence suggests that key drivers are highly context-specific, with diverging patterns across countries and time (Bongaarts and Watkins, 1996; Potter, Schmettermann, and Cavenaghi 2002; Brown and Guinnane 2002; Mason 1997; Harttgen and Vollmer 2014; Myrskylä, Kohler, and Billari 2009).
population living below the poverty line at US$1.25 per day per person at 2005 PPP declined from 43% in 1990 to 17% by 2011 (IBRD 2015).
Cross country analyses have shown a positive and significant association of change in fertility and socioeconomic development (Bongaarts and Watkins 1996). The mean predicted change in TFR due to change in female education in the micro-regions of Brazil (rural) was −0.14 in 1960–1970, −0.64 in 1970–1980, and −0.67 in 1980– 1991, and that of under-five mortality was between -0.07 and -0.10 during the same period (Potter, Schmertmann, and Cavenaghi 2002). Female literacy and child mortality accounted for half of the overall TFR reduction; i.e., TFR reduced by 0.7 between 1981 and 1991 in 326 districts of India (Dreze and Murthi 2001). Empirical evidence on the links between poverty and fertility appears more mixed and has fuelled the population and poverty debate (Merrick 2002). The cross-sectional analyses found a negative association of fertility rates with economic growth and income distribution (Eastwood and Lipton 1999). Studies found a strong and positive association between demographic change and poverty reduction in Brazil, with demographic change accounting for nearly 15% of economic growth (Barro and Lee 2011; Barros et al. 2001). Studies from 40 developing countries found a positive association of fertility with infant mortality and a negative association of fertility with female education, but did not find a significant association between fertility and poverty (Jain and Ross 2012). On the other hand, the root cause of fertility reduction in Bangladesh and Addis Ababa has been attributed to poverty (Gurmu and Mace 2008; Kabeer 2001). The association of population growth and poverty was weak in the states of India (Vande 1985). Recent studies also suggest that poverty has limited power in explaining fertility reduction in the Indian states (Mcnay, Arokiasamy, and Cassen 2003; Mohanty and Ram 2011).
2. Theoretical background
extended to linguistic and cultural boundaries in the 1980s (Cleland and Wilson 1987). The role of secularization and individualism in fertility transition was highlighted (Lesthaeghe and Surkyn 1988). At the same time, the intermediate variable framework and proximate determinant highlighted the mechanisms of fertility change (Bongaarts 1982; Davis and Blake 1956). In economic literature, fertility change was mostly viewed as a result of changing benefits and costs associated with childbearing (Becker 1960; Leibenstein 1974).
Most recently, Casterline (Casterline 2001) outlined four determinants of global fertility change, namely the pace of social and economic change, the pace of change in economic aspirations and expectations, the pace of provision of birth control services, and the pace of the reduction of the moral and social costs of birth control. Caldwell (Caldwell 2001) stressed the need to integrate socioeconomic change with the ideologies, attitude, and mechanism of fertility control in fertility theories. While these theories, frame-works, and the evidence have strengthened our understanding of fertility change, the overall understanding of the factors that truly drive fertility empirically remains limited (Brown and Guinnane 2002; Mason 1997). 5
3. Rationale and objective
Given that both distal and proximate determinants tend to be strongly correlated with a large number of societal norms and indicators, ruling out confounding concerns is generally difficult at the country level. Moreover, recent fertility decline in the states of India in the absence of an increase in contraceptive use (IIPS 2016) necessitates understanding the distal determinants of fertility change. Indian districts offer a perfect laboratory to study the association of fertility change and developmental indicators due to their size, diversity, socioeconomic disparity, and large differences in the progression of demographic transition. The average population of an Indian district is over 2 million and the variation in socioeconomic development are large. While some of the districts are still at an early stage of demographic transition with a TFR larger than five, many districts have reached a below replacement level of fertility. There is also considerable intra-district variation in all the key indicators of human development. In 2004–2005, estimated poverty was 81% in Nawarangpur district (Odisha) and less than 10% in many other Indian districts (Chaudhuri and Gupta 2009).
Although some district-level information is available for planners and policy makers, obtaining systematic district-level data is a daunting task for researchers, with even the most basic fertility measures becoming available only in recent years
(Guilmoto and Rajan 2001, 2013; Kumar and Sathyanaraynana 2012). The aim of this paper is to examine the association of fertility change with female literacy, under-five mortality, and poverty in the districts of India.
4. Data and methods
4.1 Data
We combine data from multiple public sources: 1) the 1991 and 2011 Censuses of India; 2) the consumption expenditure surveys conducted as part of the National Sample Surveys in 1993–1994, 2004–2005, and 2009–2010; and 3) the 2011 Annual Health Survey (ORGI 2011). In addition to these data we use estimates of under-five mortality recently published by Ram et al. (Ram et al. 2013) and background information from published reports of the National Family Health Surveys (IIPS and Macro International 1995, 2007).
As of 2011, India has been divided administratively into 29 states, 6 union territories, 84 agro-climatic regions, and 640 districts. The number of districts increased from 466 in 1991, to 593 in 2001, and to 640 in 2011. In this paper we focus on districts as the unit of analysis, using the 2011 district definition. In cases where districts were split between censuses we apply the larger district estimates for all sub-district areas. The census of India was not conducted in the state of Jammu and Kashmir in 1991: districts in this state were excluded from our analysis.
4.1.1 Outcome
4.1.2 Independent variables
The three distal determinants of fertility analyzed in this paper are female literacy, under-five mortality, and poverty. Female literacy is defined as the percentage of the population aged seven years and above who can read and write with understanding in any of the specified languages. District-level estimates for literacy are directly available from the three rounds of the census through the Primary Census Abstracts. The under-five mortality rate (U5MR) is defined as the probability of not surviving by the fifth birthday and expressed as deaths per 1000 live births. The estimates of U5MR for 1991 have been taken from the Census of India publications (ORGI 1997). For 2011 the U5MR estimates for 274 districts were available in the Annual Health Survey 2011 (ORGI 2011). For the remaining districts we have used U5MR from recent estimates published by Ram et al. (2013).
For poverty, we used the consumption expenditure data from the National Sample Survey (NSS) for the years 2004–2005 and 2009–2010 to compute the percentage of households in each district living below the state-specific poverty lines (Planning Commission 2012)6. In cases where the district samples were small (< 400 persons) we used regional rather than district poverty estimates. For 1993–1994 we derived the estimates of poverty for the districts of India on the assumption that the decline in poverty in districts during 2004–2005 and 1993–1994 was similar to that of the regions to which the districts belong. For this purpose we used NSS regions: these regions comprise a group of districts with similar agro-climatic and economic conditions, and have been frequently used as spatial proxies for districts (Dreze and Murthi 2002; Bhat 1996). NSS region estimates were used for 36 districts in 2001 and for 61 districts in 2011. It is worth highlighting that the NSS data does not exactly map onto the census data time-wise. Thus, the computed rates may not reflect the true levels for 1991 and 2011 exactly, but instead reflect the data points closest to each of three time periods.
4.2 Methods
Our empirical approach is divided into three parts. In order to provide a first impression of the spatial and temporal variation in our variables of interest we start our analysis with basic descriptive statistics and figures showing levels and changes in all four variables. To test the strength of the associations between TFR and the independent variables of interest, we plot the absolute and relative change of TFR as a function of the base values of our independent variables. The main question we want to address
6 With 22% of the poor in India (as per Tendulkar Committee) and a margin of error of 5%, the required
with these figures is whether or not districts with initially higher levels of the variable experience faster changes in the subsequent period. In the literature both absolute and relative changes have been discussed and analyzed extensively. We have presented both absolute and relative changes in each of the four variables with respect to initial levels. The absolute values are the simple differences between 2011 and 1991 values, while the relative differences are annualized changes and shown in percentages.
The relative changes in TFR (annualized rate of change) are computed as
ln (TFR2011/TFR1991)/20 (1)
A similar equation is used for estimating relative change in under-five mortality, female literacy, and poverty.
In order to identify adjusted associations in a multi-variable setting, we start out by a standard difference-in-differences panel model, which is given by
1 5 2 3
i i i i i
TFR α β U MR β LIT β POV ε
∆ = + ∆ + ∆ + ∆ + (2)
where ∆TFR, ∆U MR5 , ∆LIT, and ∆POV are the changes in fertility, under-five mortality, female literacy, and poverty, respectively. β is the regression coefficient, α is the intercept, and ε is the error term. We only analyze the sample period 1991–2011. Given that we use the changes in all variables, this specification is identical to a panel specification with two periods and district level fixed effects.
In order to address contemporaneity concerns, we estimate alternative models where we test for the associations between initial levels of education, mortality, poverty, and initial fertility with subsequent changes in fertility:
∆𝑇𝐹𝑅𝑖= 𝛼 + 𝛽𝑖 𝑈5𝑀𝑅𝑖,𝑡0 + 𝛽2𝐿𝐼𝑇𝑖,𝑡0+ 𝛽3𝑃𝑂𝑉𝑖,𝑡0+ 𝛽4𝑇𝐹𝑅𝑖,𝑡0+ 𝜖𝑖 (3)
where
0
5 t
U MR
0 t
LIT and
0 t
POV are the initial levels of under-five mortality, literacy, and poverty respectively. Last, we estimate a hybrid model where we include both initial conditions and contemporaneous changes:
1 5 ,to 2 ,to 3 ,to 4 5 5 6 7 .o
i i i i i i i i t i
TFR α βU MR βLIT βPOV β U MR β LIT β POV βTFR ε
∆ = + + + + ∆ + ∆ + ∆ + + (4)
Technically, this is the most flexible specification possible with the available data. A more ‘basic’ hybrid model, not controlling for initial fertility, can be obtained from this model by imposing a (beta) coefficient of 0 on the more flexible model.
5. Results
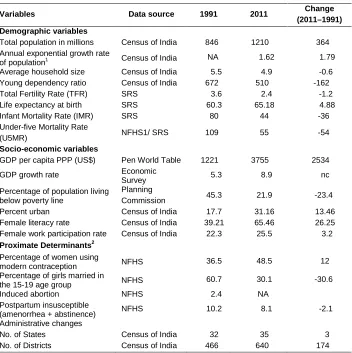
Table 1 provides an overview of the demographic and socioeconomic changes experienced in India in 1991 and 2011. In India the TFR declined by more than one birth per woman and life expectancy has increased by five years during the last two decades. Overall, the population grew at an annual rate of 1.8% over the period 1991– 2011. Both infant mortality and the under-five mortality rates were halved, suggesting significant improvement in child survival. There has been remarkable progress in female literacy and educational attainment. With the sustained annual GDP growth rate of over 5% and slowing down of birth rate, the per capita income (PPPUS$) was almost doubled. With respect to proximate determinants, about half of the married women are using modern methods of contraception and the age at marriage is on the rise. During 1991–2011 three new states, namely Chhattisgarh, Jharkhand, and Uttarakhand, were created from the states of Madhya Pradesh, Bihar, and Uttar Pradesh respectively, and 174 new districts were created. While the national average is encouraging, it conceals large disparities between the districts of India.
Table 1: Demographic and socioeconomic change in India, 1991–2011
Variables Data source 1991 2011 Change
(2011–1991) Demographic variables
Total population in millions Census of India 846 1210 364
Annual exponential growth rate
of population1 Census of India NA 1.62 1.79
Average household size Census of India 5.5 4.9 -0.6
Young dependency ratio Census of India 672 510 -162
Total Fertility Rate (TFR) SRS 3.6 2.4 -1.2
Life expectancy at birth SRS 60.3 65.18 4.88
Infant Mortality Rate (IMR) SRS 80 44 -36
Under-five Mortality Rate
(U5MR) NFHS1/ SRS 109 55 -54
Socio-economic variables
GDP per capita PPP (US$) Pen World Table 1221 3755 2534
GDP growth rate Economic
Survey 5.3 8.9 nc
Percentage of population living below poverty line
Planning
Commission 45.3 21.9 -23.4
Percent urban Census of India 17.7 31.16 13.46
Female literacy rate Census of India 39.21 65.46 26.25
Female work participation rate Census of India 22.3 25.5 3.2
Proximate Determinants2 Percentage of women using
modern contraception NFHS 36.5 48.5 12
Percentage of girls married in
the 15-19 age group NFHS 60.7 30.1 -30.6
Induced abortion NFHS 2.4 NA
Postpartum insusceptible
(amenorrhea + abstinence) NFHS 10.2 8.1 -2.1
Administrative changes
No. of States Census of India 32 35 3
No. of Districts Census of India 466 640 174
1
Computed for the period 1991-2011 . 2
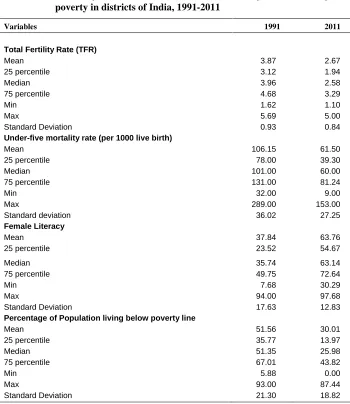
Table 2: Summary statistics of TFR, under-five mortality, female literacy and poverty in districts of India, 1991-2011
Variables 1991 2011
Total Fertility Rate (TFR)
Mean 3.87 2.67
25 percentile 3.12 1.94
Median 3.96 2.58
75 percentile 4.68 3.29
Min 1.62 1.10
Max 5.69 5.00
Standard Deviation 0.93 0.84
Under-five mortality rate (per 1000 live birth)
Mean 106.15 61.50
25 percentile 78.00 39.30
Median 101.00 60.00
75 percentile 131.00 81.24
Min 32.00 9.00
Max 289.00 153.00
Standard deviation 36.02 27.25
Female Literacy
Mean 37.84 63.76
25 percentile 23.52 54.67
Median 35.74 63.14
75 percentile 49.75 72.64
Min 7.68 30.29
Max 94.00 97.68
Standard Deviation 17.63 12.83
Percentage of Population living below poverty line
Mean 51.56 30.01
25 percentile 35.77 13.97
Median 51.35 25.98
75 percentile 67.01 43.82
Min 5.88 0.00
Max 93.00 87.44
Standard Deviation 21.30 18.82
fertility reductions were visible at all levels of initial fertility. During 1991–2011 the majority of the districts experienced a reduction of 1-2 point in TFR. This reduction has also been resulted in 1% – 3% annual decline in TFR in the last two decades (relative change). Second, there is a remarkable degree of heterogeneity in the changes observed, and this heterogeneity is particularly large among districts that had a TFR of 4 or more in 1991. While some of these districts experienced very little change in fertility, other districts in this group experienced a TFR decline of up to 2 births per woman. Interestingly, the lowest TFR in 1991 was in the Kolkata district of West Bengal (TFR of 1.6), which further declined by 0.5 births per woman during the period 1991-2011. The low fertility in Kolkata district has been highlighted in two recent studies (Guilmoto and Rajan 2014; Kumar and Sathyanarayana 2013). The highest TFR in 1991 (5.69) was observed in Palamu district of Jharkhand, with a subsequent reduction in TFR of more than two births. The largest decline in TFR was observed in the Dhemaj district of Assam (2.8). Most of the high fertility districts are in the states of Bihar, Jharkhand, Uttar Pradesh, and Meghalaya.
Figure 1(a): Absolute change in fertility during 1991 and 2011
Fig 1(b): Relative change in fertility (annualized change) during 1991 and 2011 ((lnTFR1991-lnTFR2011)/20)) and fertility in 1991 in districts of India
Figure 2(a) and Figure 2(b) show the same Lowess estimates for under-five mortality. Absolute convergence is much stronger for mortality than for fertility, with a nearly linear relationship between initial levels of mortality and subsequent changes 7. In the case of relative change, the majority of the districts experienced a reduction in the range of 1% – 4% annually from their initial level. In 1991 the U5MR was lowest in the Hyderabad district of Andhra Pradesh and highest in the district of East Kameng in Arunachal Pradesh. By 2011 the U5MR was highest in the district of Lower Subansiri (153 per 1000 live births) in Arunachal Pradesh, followed by Kandamal district in Odisha and the Shraswati district of Uttar Pradesh. Many of the poorer districts show a significant reduction in under-five mortality. By 2011 the under-five mortality was lowest in the Kannur district of Kerala (9). The convergence in U5MR was higher than that of the TFR. However, there are some districts where under-five mortality has not changed, or has even increased.
7
Figure 2(a): Absolute change in under-five mortality during 1991 and 2011 (U5MR2011–U5MR1991) and under-five mortality in 1991 in the districts of India
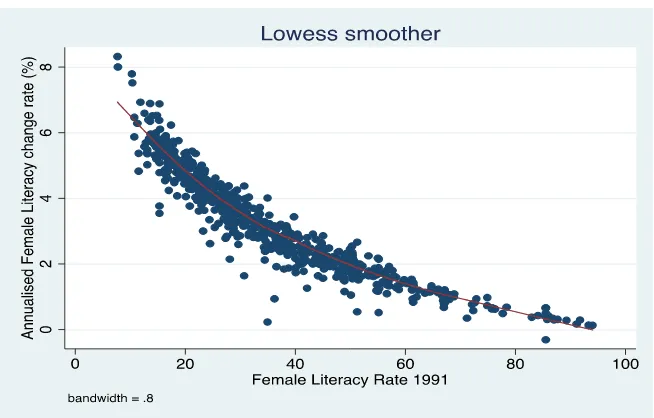
Figure 3(a) and Figure 3(b) show that the convergence patterns are even stronger for female literacy. In the case of relative change the shape of the curve is convex, suggesting that with a higher initial level of female literacy the annualized change was slower. The absolute change is heterogeneous but suggests that the majority of the districts with lower initial values have gained most during the last two decades. In 1991 the lowest female literacy rate was in the Barmer district of Rajasthan (less than 10%) and in 2011 it was in the Alirajpur district of Madhya Pradesh (30.3%). The largest increase in female literacy level was in the Gurgaon district of Haryana (from 35% in 1991 to 78% by 2011). Most of the districts in the state of Kerala only had a marginal increase because of the high level of female literacy in 1991, and there are some districts that did not do well despite their low base.
Figure 3(b): Relative change in female literacy (annualized change) during 1991 and 2011 (ln female literacy 2011 – ln female literacy 1991) and female literacy in 1991 in districts of India
Figure 4(a): Absolute change in poverty during 1991 and 2011 (poverty 2011– poverty 1991) and poverty level in 1991 in districts of India
Appendix 1 presents the correlation coefficient of the TFR, female literacy, under-five mortality, and poverty in districts of India for 1991 and 2011. Appendix 2 and Appendix 3 present the list of districts that experienced the lowest declines in fertility (reduction of TFR of less than 0.5) and highest declines in fertility (reduction of TFR by more than 2) in Indian districts, along with female literacy, under-five mortality, and poverty.
6. Bivariate analysis
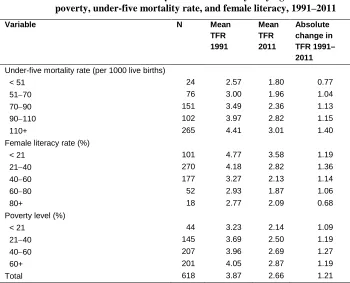
Table 3: Distribution of Districts by estimated TFR by varying levels of poverty, under-five mortality rate, and female literacy, 1991–2011
Variable N Mean
TFR 1991
Mean TFR 2011
Absolute change in TFR 1991– 2011
Under-five mortality rate (per 1000 live births)
< 51 24 2.57 1.80 0.77
51−70 76 3.00 1.96 1.04
70−90 151 3.49 2.36 1.13
90−110 102 3.97 2.82 1.15
110+ 265 4.41 3.01 1.40
Female literacy rate (%)
< 21 101 4.77 3.58 1.19
21−40 270 4.18 2.82 1.36
40−60 177 3.27 2.13 1.14
60−80 52 2.93 1.87 1.06
80+ 18 2.77 2.09 0.68
Poverty level (%)
< 21 44 3.23 2.14 1.09
21−40 145 3.69 2.50 1.19
40−60 207 3.96 2.69 1.27
60+ 201 4.05 2.87 1.19
Total 618 3.87 2.66 1.21
Figure 5(a): Change in TFR and change in under-five mortality rate during 1991 and 2011 in districts of India
Figure 5(b): Change in TFR and change in female literacy during 1991 and 2011
Figure 5(c): Change in TFR and change in poverty level during 1991 and 2011 in districts of India
7. Multivariate results
In this section we present our main multivariate regression results. In all three models in Table 4 the dependent variable is fertility change during 1991–2011 (TFR2011 – TFR1991). Model 1 (upper panel of the table) presents the result of difference-in-difference (equation (1)); Model 2 assesses the predictive power of initial distal determinant values (equation (2)), and Model 3 (lower panel of the table) shows hybrid model results (equation (3)). The second and third columns of Table 4 present our regression analyses results, while the fourth and fifth columns present the results of a similar regression model taking the state as fixed.
Table 4: Result of regression models under alternative model specification Dependent variable: Change in fertility (2011–1991)
Associations of reduction in poverty, fertility, under-five mortality, and female literacy
Variables and Models
Col 1
Regression model, Change in TFR (2011–1991) as dependent variable
Col2 Col3
Regression model, Change in TFR (2011–1991) as dependent variable and state as fixed Col4 Col5 Difference in difference (with change
values): Model 1
Coeff T Stat Coeff T Stat
Change in under-five Mortality 0.0043 6.46 0.0045 5.22
Change in female literacy −0.0208 −9.73 −0.0221 −7.87
Change in poverty −0.0007 −0.9 −0.0006 −1.00
Constant −0.5202 −9.32 −0.4768 −7.89
R2 (overall) 0.2646 0.2646
Difference and initial values (with base values): Model 2
TFR −0.1745 −6.33 −0.4837 −8.86
Under-five mortality rate −0.0029 −4.66 0.0007 0.65
Female literacy −0.0030 −1.91 −0.0105 −3.63
Poverty (Percentage of population living below poverty line)
0.0010 1.18 −0.0002 −0.26
Constant −0.1726 −1.07 0.9833 3.55
R2 (overall) 0.2208 0.1590
Hybrid model (change + base values): Model 3
Change in under-five mortality (2011–1991) 0.0044 4.35 0.0076 7.91
Change in female literacy (2011–1991) −0.0294 −8.37 −0.0303 −11.22
Change in poverty (2011–1991) 0.0023 2.35 −0.0010 −1.08
TFR, 1991 −0.2140 −7.85 −0.3965 −7.98
Under-five mortality rate, 1991 0.0003 0.29 0.0061 4.55
Female literacy, 1991 −0.0115 −6.6 −0.0149 −6.02
Poverty (Percentage of population living below poverty line), 1991
0.0026 2.55 −0.0011 −1.03
Constant 0.8751 4.64 1.3619 4.55
R2 (overall) 0.3993 0.3210
Similar overall patterns emerge when we focus on initial conditions in Model 2. Once again, relatively large and statistically significant effects were found for mortality and literacy, while initial poverty had very little predictive power. The estimated Model 2 coefficients are not directly comparable in magnitude to the coefficients in Model 1 given that baseline levels for mortality are higher than baseline levels for literacy, and the same also holds for the standard deviation of these variables. A one-standard-deviation increase in U5MR in 1991 (36 deaths per 1000 live births) was associated with a reduction in subsequent fertility declines of about 0.1 (36*−0.0029=-0.10); a one-standard-deviation increase in literacy (18 percentage points) increased the subsequent declines by about half as much (18*−0.003=-0.05).
When we controlled for both initial levels and contemporaneous changes in Model 3, 40% of total fertility changes over the period 1991–2011 were explained. For literacy, both initial levels and subsequent changes appear to be positively associated with fertility change; for mortality, changes appear to be significantly associated only with fertility change. As a robustness check we estimate alternative models where we include separate trends for each of the 29 states in our model. The size, direction, and the significance of the variables in each of the models were broadly similar (columns 4 and 5), with slightly larger and more precise estimate associations for under-five mortality.
8. Effect sizes and interpretation
To understand the magnitude of the observed associations, in Table 5 we show mean estimated effect sizes for all explanatory variables. The single largest predictor of the fertility reductions observed was initial TFR (−0.83), followed by increase in female literacy (−0.76) and the initial literacy level (0.43). The effect of initial level of poverty on fertility reduction was 0.13, while that of reduction in poverty was −0.05. Given that the confidence intervals around both estimates are large, a rather limited role of poverty in fertility transition is suggested. The pattern is similar when we multiply the observed coefficients with standard deviations of all variables rather than means.
Table 5: Mean sample value and sample standard deviation of fertility reduction during 1991–2011
9. Discussion and conclusion
India has been experiencing remarkably fast demographic and socioeconomic change over the past two decades. As this paper shows, these national trends conceal large disparities across states and districts of India. While there have been numerous studies depicting the state pattern of fertility transition and its determinants, there are only a few studies that have examined the level and change in fertility across the districts of India. Districts in India are the unit of program implementation, a bridge between state and household; they are culturally homogeneous and show enormous variations in socio-economic development. The primary objective of this paper is to understand the role of three key developmental factors, female literacy, reduction in child mortality, and poverty, in bringing fertility change during 1991 and 2011. Though the selection of indicators is constrained by availability of estimates at the district level, these three indicators reflect the key dimensions of human development. Our analysis yielded the following main results: first, the data shows a remarkable degree of convergence in all four indicators, fertility, under-five mortality, female literacy, and the poverty levels in the districts of India. While one-third of the districts have reached below replacement fertility level, under-five mortality and the poverty level have reduced by half from their initial levels and the female literacy level has almost doubled. The convergence patterns are strongest in female literacy, still relatively strong for under-five mortality, and much less pronounced for poverty. Second, a substantial amount of the observed fertility decline appears to be country-wide and cannot be attributed to either literacy, mortality, or poverty, but rather is captured by either constant or initial fertility terms. Third, strong and highly consistent associations were found between mortality, literacy, and fertility change. This suggests that increased educational attainment and improved child survival continue to be major drivers of fertility reduction. Fourth, rather surprisingly, we did not find any evidence of family income or poverty being associated with fertility change. This suggests that poverty is not a barrier to fertility reduction, at least in the Indian context. Fifth, in terms of magnitude, literacy effects seem to dominate mortality effects, particularly in models that take into account both the initial levels and contemporaneous changes of the variables. Continued investment in both areas seems desirable from the perspective of both fertility and broader societal welfare.
10. Acknowledgements
References
AksAn, A.M. (2014). Effects of Childhood Mortality and Morbidity on the Fertility Transition in sub-Saharan Africa. Population and Development Review 40(2): 311–329. doi:10.1111/j.1728-4457.2014.00675.x.
Amin, S., Casterline, J.B., and Spess, L. (2007). Poverty and Fertility: Evidences and Agenda. Working paper No 4. New York: Population Council.
Barro, R.J. and Lee, J.W. (2011). A New Data Set of Educational Attainment in the World, 1950–2010.www.barrolee.com.
Barros, R.P.D., Firpo, B., Guedes, R., and Leite, P.G.P. (2001). Demographic Changes and Poverty in Braziil. In: Birdsall, N., Kelley, A.C., and Sinding, S.W. (eds.).
Population Matters: Demographic Change, Economic Growth and Poverty in Developing World. Oxford: OUP: pp. 296–322. doi:10.1093/0199244073. 003.0011.
Basu, A.M. (2002). Why does Education Lead to Lower Fertility? A Critical Review of Some of the Possibilities. World Development 30(10): 1779–1790. doi:10.1016/ S0305-750X(02)00072-4.
Becker, G. (1960). Demographic and Economic Change in Developed Countries. New York: Columbia University Press.
Bhat, P.N.M. (1996). Contours of Fertility Decline in India. In: Srinivasan, K. (ed.). In Population Policy and Reproductive Health. New Delhi: Hindustan Publishing Corporation.
Bongaarts, J. (1982). The Fertility-Inhibiting Effects of the Intermediate Fertility Variables. Studies in family planning 43(67): 179–189. doi:10.2307/1965445. Bongaarts, J. and Watkins, S.C. (1996). Social Interaction and Contemporary fertility
Transition. Population and Development Review 22(4): 639–682. doi:10.2307/ 2137804.
Brown, J.C. and Guinnane, T.W. (2002). Fertility transition in a rural, Catholic population: Bavaria, 1880–1910, A Journal of Demography. Population Studies
56(1): 35–49. doi:10.1080/00324720213799.
Caldwell, J. and McDonald, P. (1982). Influence of maternal education on infant and child mortality: levels and causes. Health Policy Education 2(3): 251–267.
doi:10.1016/0165-2281(82)90012-1.
Caldwell, J.C. (2001). The Globalization of Fertility Behavior. Population and Development Review 27(Supplement :Global Fertility Transition): 93–115. Carlson, G. (1996). The Decline of Fertility: Innovation or Adjustment Process.
Population Studies 20(2): 149–174. doi:10.1080/00324728.1966.10406092. Casterline, J.B. (2001). The pace of fertility transition: National pattern in the second
half of the twentieth century. Population and Development Review 27 (Supplement: Global Fertility Transition): 17–52.
Chaudhuri, S. and Gupta, N. (2009). Levels of Living and Poverty Patterns: A District-Wise Analysis for India. Economic and Political Weekly 44(9): 94–110.
Cleland, J. (2001). The Effect of Improved Survival on fertility: A Reassessment.
Population and Development Review 27 (Supplement: Global Fertility Transition): 60–92.
Cleland, J. and Wilson, C. (1987). Demand Theories of the Fertility Transition: an Iconoclastic. Population Studies 41(1): 5–30. doi:10.1080/00324720310001 42516.
Davis, K. and Blake, J. (1956). The Decline of Fertility: Innovation or Adjustment.
Economic Development and Cultural Change 4: 211–235. doi:10.1086/449714. Dreze, J. and Murthi, M. (2001). Fertility, Education and Development: Evidence from
India. Population and Development Review 27(1): 33–63. doi:10.1111/j.1728-4457.2001.00033.x.
Eastwood, R. and Lipton, M. (1999). The Impact of Change in Human Fertility on Poverty. The Journal of Development Studies 36(1): 1–30. doi:10.1080/0022038 9908422609.
Guilmoto, C.Z. and Rajan, S.I. (2001). Spatial Patterns of Fertility Transition in Indian Districts. Population and Development Review 27(4): 713–738. doi:10.1111/j.17 28-4457.2001.00713.x.
Gurmu, E. and Mace, R. (2008). Fertility decline driven by poverty: the case of Addis Ababa, Ethiopia. Journal of Bio Social Science 40(3): 339–358. doi:10.1017/S0 02193200700260X.
Harttgen, K. and Vollmer, S. (2014). Reversal in the relationship of human development with fertility. Demography 51: 173–184. doi:10.1007/s13524-013-0252-y.
IBRD (2015). Global Monitoring Report 2014/2015, Ending Poverty and Sharing Responsibility. Washinton DC.
IIPS and MacroInternational (1995). National Family Health Survey (NFHS -1). India, Mumbai: IIPS.
IIPS and MacroInternational (2007). National Family Health Survey (NFHS -3), 2005– 06: India. Volume I. Mumbai: IIPS.
IIPS (2016). National Family and Health Survey 2015−15. State fact Sheet.
Jain, A.K. and Nag, M. (1986). The Importance of Female Primary Education for Fertility Reduction in India. Economic and Political Weekly 21 (36): 1602–1608. Jain A .K and Ross J.A (2012). Fertility Dfferences Among Developing Countries: Are They Still Related to Family Planning Program Efforts and Social Setting.
International Perspective on Reproductive and Sexual Health 38(1): 15−22.
Kabeer, N. (2001). Ideas, economics and the sociology of supply: Explanations for fertility decline in Bangladesh. Journal of Development Studies 38(1): 29–70.
doi:10.1080/00220380412331322181.
Kumar, S. and Sathyanaraynana, K.M. (2012). District-Level Estimates of Fertility and Implied Sex Ratio at Birth in India. Economic and Political Weekly 47(33): 66– 72.
Leibenstein, H. (1974). An Interpretation of the Economic Theory of Fertility: Promising Path or Blind Alley?. The Journal of Economic Literature 12(2): 457–479.
Lesthaeghe, R. and Surkyn, J. (1988). Cultural Dynamics and Economic Theories of Fertility Change. Population and Development Review 14(1): 1–45.
doi:10.2307/1972499.
Mason, K.O. (1997). Explaining Fertility Transitions. Demography 34(4) 443–454.
Mcnay, K., Arokiasamy, P., and Cassen, R.H. (2003). Why Are Uneducated Women In India Using Contraception? A Multilevel Analysis. Population Studies 57(1): 21–40. doi:10.1080/0032472032000061703.
Merrick, T.W. (2002). Population and Poverty: New Views on an Old Controversy. International Family Planning. International Family Planning Perspective 28(1): 41–46. doi:10.2307/3088274.
Myrskylä, M., Kohler, H.-P., and Billari, F.K. (2009). Advances in development reverse fertility declines. Nature 460: 741–743. doi:10.1038/nature08230. Mohanty, S.K. and Rajbhar, M. (2014). Fertility Transition and Adverse Child Sex
Ratio in Districts of India. Journal of biosocial science 46(6) 753–771.
doi:10.1017/S0021932013000588.
Mohanty, S.K. and Ram, F. (2011). Spatial Pattern of Poverty Reduction and Fertility Transition in India. Population Review 50(1): 62–78.
Notestein, F.W. (1945). Population: The Long View. In: Schultz, E. (ed.) Food for the World. Chicago: Chicago University Press: pp.36–47.
ORGI (1997). District Level Estimates of Fertility and Child Mortality for 1991 and their Interrelations with other variables. Occasional Paper No.1 of 1997, Registrar General, India, New Delhi.
ORGI (2011). Annual Health Survey Bulletins 2010–11. Office of The Registrar General and Census Commissioner, Government of India.
Planning Commission (2012). Press Note on Poverty Estimates, 2009–10. New Delhi: Government of India.
Potter, J.E., Schmertmann, C.P., and Cavenaghi, S.M. (2002). Fertility and Development: Evidence from Brazil. Demography 39(4): 739–761.
doi:10.1353/dem.2002.0039.
Ram, U., Jha, P., Ram, F., Kumar, K., Awasthi, S., Shet, A., and Kumar, R. (2013). Neonatal, 1−59 month, and under-five mortality in 597 Indian districts, 2001 to 2012: estimates from national demographic and mortality surveys. Lancet Global Health 1(4): 219–226.
Robey, B. (1990). How Female Literacy Affects Fertility: the Case of India. Asia Pac Pop Policy 15: 1–3.
Thompson, W.S. (1929). Population. American Journal of Sociology 34(6): 959–974.
doi:10.1086/214874.
UNICEF (2014). Levels and trends in Child Mortality, Estimates Developed by the UN Inter-agency Group for Child Mortality Estimation.
van de Walle, D. (1985), Population Growth and Poverty: Another Look at the Indian Times Series Data. Journal of Development Studies 21(3): 29–39.
Appendix
Appendix 1: Correlation coefficient of TFR, female literacy, and under-five mortality in the districts of India, 1991–2011
Appendix 2: List of districts with TFR reduction of less than 0.5 during 1991–2011 and the corresponding under-five mortality, female literacy, and poverty in India, 1991–2011
Appendix 3: List of districts with TFR reduction of 2 and more during 1991–2011 and the corresponding under-five mortality, female literacy, and poverty in India, 1991–2011