A COMPARISON OF PREDICTED BRACE LOADS IN TEMPORARY RETAINING
STRUCTURES AND OBSERVED BRACE LOADS IN TWO FULL SCALE TEST
SECTIONS
A Thesis
Submitted to the Graduate Faculty of the
University of New Orleans
in partial fulfillment of the
requirements for the degree of
Master of Science
in
The Department of Engineering
by
Daniel R. Haggerty, Jr.
B.S., University of New Orleans, 2000
ii
Acknowledgement
I am grateful for the advice, instruction, and support of Dr. John B. Grieshaber,
Chief of Civil Branch at the U.S. Army Corps of Engineers. His engineering knowledge
and motivation served as an inspiration. I would also like to thank Dr. Mysore Nataraj,
Professor at the University of New Orleans, and Dr. Kenneth McManis, Chairman of the
Department of Civil Engineering at the University of New Orleans, for taking the time to
serve on my thesis committee. My knowledge and interest in geotechnical engineering
was inspired by Dr. Nataraj.
I would like to thank the New Orleans District of the U.S. Army Corps of
Engineers for financing my graduate studies. I would also like to thank the senior
engineers, especially Mr. Richard Pinner, of the Structures Foundations Section of the
New Orleans District of the U.S. Army Corps of Engineers for their geotechnical support
and guidance.
I owe a special thanks to my parents who taught me the importance of an
education and have supported me throughout my education.
Finally, I would like to thank my wife Melanie, for her sacrifice, love, and support
iii
Table of Contents
Abstract... vii
CHAPTER 1: INTRODUCTION... 1
1.1 Scope of Thesis ... 1
1.2 Background of the New Orleans Area ... 1
1.3
Background Information on the SELA Project... 2
1.4
Location and Description of Project Sites ... 3
1.5 Purpose of Geotechnical Instrumentation Program ... 6
1.6 Objectives of Thesis... 6
1.7 Organization of Thesis... 6
CHAPTER 2: LITERARY RESEARCH ... 8
2.1 Sheet
Pile
Walls ... 8
2.2
Loads On Sheet Pile Walls ... 10
2.2.1 Earth Pressure Theories ... 10
2.2.1.1 Rankine Theory... 12
2.2.1.2 Coulomb Theory ... 14
2.2.2 Surcharge
Loads... 16
2.2.2.1 Uniform Surcharge... 17
2.2.2.2 Point
Loads ... 17
2.2.2.3 Line
Loads ... 19
iv
2.2.3 Water Loads ... 20
2.3 Design of Sheet Pile Walls ... 20
2.3.1 Preliminary Data ... 21
2.3.2 Factors of Safety ... 21
2.3.3 Net Pressure Distribution... 22
2.3.4 Cantilever Walls... 23
2.3.5 Anchored
Walls ... 25
2.3.5.1 Free Earth Method ... 25
2.3.5.2 Rowe’s Moment Reduction Theory... 28
2.3.5.3 Fixed Earth Method ... 30
2.4 Braced Cofferdams ... 32
2.4.1 Lateral Pressure Distribution ... 34
2.4.2 Sizing of Cofferdam Components ... 37
2.4.3 Stability of Cofferdams - Heaving in Soft Clay... 40
2.5 Soil-Structure Interaction Analysis... 42
2.5.1 Soil-Structure Interaction Method ... 43
2.5.2 Preliminary Information... 43
2.5.3 Soil-Structure Interaction Model ... 44
2.5.4 Non-linear Soil Springs... 45
2.5.5 Non-linear Anchor Springs ... 47
v
CHAPTER 3: TEST SITES ... 50
3.1 Subsurface Exploration... 50
3.2 Geotechnical Instrumentation ... 51
3.3 Napoleon Avenue Site ... 52
3.3.1 Site Conditions... 52
3.3.2 Subsurface Stratification... 52
3.3.3 Construction... 56
3.3.4 Theoretical Strut Loads... 59
3.4 Hollygrove Site ... 60
3.4.1 Site Conditions... 60
3.4.2 Subsurface Stratification... 61
3.4.3 Construction... 62
3.4.4 Theoretical Strut Loads... 67
CHAPTER 4: Instrumentation Program Results... 69
4.1 Napoleon Avenue Site Instrumentation... 69
4.2 Hollygrove Site Instrumentation... 73
CHAPTER 5: Conclusions and Recommendations... 77
5.1 Summary ... 77
5.2
Results of Analysis of Strut Loads... 77
5.3 Conclusions... 79
vi
vii
Abstract
This thesis presents analyses of the results of a geotechnical instrumentation
program performed by Eustis Engineering Company for the U.S. Army Corps of
Engineers (USACE) during the construction of two covered canals in New Orleans,
Louisiana. At each site, a cast-in-place concrete culvert was constructed within a sheeted
and braced excavation. Information provided by Eustis Engineering Company to the
USACE is presented describing the existing soil conditions, the construction schedule,
the geotechnical testing apparatus and instrumentation, and the data produced from the
geotechnical instrumentation program.
In this thesis, several theoretical approaches available for estimating the strut
loads in braced excavations were examined and used to predict the strut loads at the two
construction sites. These theoretical approaches included Coulomb pressures diagrams,
Terzaghi pressure diagrams, and soil-structure interaction. The results of the theoretical
strut load prediction methods are presented and compared with the results of the
CHAPTER 1: INTRODUCTION
1.1 Scope of Thesis
This thesis presents the results of an analysis of the data obtained from a
geotechnical instrumentation program performed by Eustis Engineering Company for the
U.S. Army Corps of Engineers (USACE) during the construction of two covered canals
in New Orleans, Louisiana. At each site, a cast-in-place concrete culvert was constructed
within a sheeted and braced excavation. Information provided by Eustis Engineering
Company to the USACE is presented describing the existing soil conditions, the
construction schedule, the geotechnical testing apparatus and instrumentation, and the
data produced from the geotechnical instrumentation program. The results of theoretical
strut load prediction methods are presented and compared with the results of the
geotechnical instrumentation program data.
1.2 Background of the New Orleans Area
New Orleans is the largest urban area in the country that is below sea level.
Because most of the area is lower than surrounding water elevations, the area is protected
from storm surges and tidal inflow by a continuous system of levees and floodwalls. This
system that protects New Orleans from storm surges enhances the natural bowl in which
the city sits by raising its sides, so that even more water is held within the city. Since
and the area can annually expect both a storm producing at least 4.5 inches of rain in 24
hours and a storm dropping at least 2.1 inches of rain in one hour, the city needs a way to
empty that bowl. Canals and pumping stations offer drainage solutions throughout New
Orleans areas. The rainwater flows through a network of interconnected canals that
ultimately drain into Lake Ponchartrain by means of pumping stations.
1.3
Background Information on the SELA Project
Major urban flooding has been a familiar experience for New Orleans residents.
Storms dumping millions of cubic feet of rain and causing serious flooding have occurred
in nine of the last 15 years. But a flood that occurred in 1995 shocked the city into a sense
of urgency. On May 8, 1995, approximately 20 inches of rain fell into the New Orleans
metropolitan area, killing seven people, causing $1 billion in damages by flooding
approximately 35,000 homes and thousands of businesses and public facilities. This event
established the need to improve the area’s capacity to cope with rainfall flooding.
The Southeastern Louisiana (SELA) Urban Flood Control Project was created to
improve the area’s capacity to cope with rainfall flooding. The objective of the SELA
Project is to develop a feasible drainage plan that will enable the New Orleans area to
experience a 10-year rainfall event without substantial flooding. When implemented, the
SELA projects will put thousands more cubic feet of rainwater through the area’s pumps,
down its canals and into Lake Ponchartrain. This requires deepening and widening some
earthen canals, lining others with concrete, enlarging underground canals and increasing
1.4
Location and Description of Project Sites
This thesis considers the construction of covered canals at two sites in New
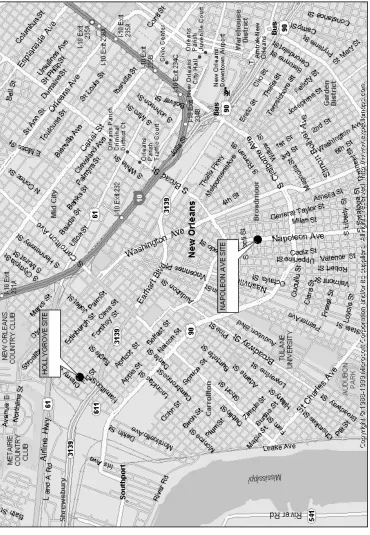
Orleans (see Figure 1.1). The first site (hereafter referenced as the “Napoleon Avenue
Site”) is located at the intersection of Napoleon Avenue and South Galvez Street. The
second site (hereafter referenced as the “Hollygrove Site”) is located south of the
intersection of Mistletoe Street and Colapissa Street.
At the Napoleon Avenue Site, two new canals are being built under Napoleon
Avenue from South Claiborne Avenue to Fontainebleau Drive. The two new canals, each
19 feet wide by 13 feet high run north and south for nine blocks along the Napoleon
Avenue traffic median. The covered concrete canals parallel an existing 20-foot by
12-foot canal, which is remaining operational during construction. Together, the new canals
will triple the capacity of the current canal.
The Hollygrove Site project consists of 800 feet of 10-foot by 20-foot box culvert
and 800 feet of 10-foot by 16-foot box culvert along an old railroad embankment, and
1500 feet of 5-foot by 6-foot box culvert along Eagle Street. The box culvert along the
old railroad embankment will run from the new Pritchard Place pump station to its
intersection with Forshey Street. The Eagle Street culvert will empty into the railroad
embankment culvert and will run as far as Stroelitz Street near the Palmetto Canal.
These recent drainage projects associated with the SELA Project have required
construction in congested urban areas. There are many buildings, residences, and
roadways in close proximity to these project sites. Because of the close proximity of
these facilities and structures it is impractical to provide slopes flat enough for safety.
lateral restraint that was provided by the material being removed. The sheet piling holds
1.5 Purpose of Geotechnical Instrumentation Program
The objective of the instrumentation program was to assess the magnitudes of
lateral and horizontal movements associated with the construction of covered canals
within sheeted and braced cofferdams. Geotechnical instruments, consisting of slope
inclinometers and Sondex settlement rings, were also installed to provide indications of
the magnitudes of soil movements at discrete locations adjacent to the excavation.
Piezometers were installed to monitor pore water pressures in the foundation soils during
construction. Lastly, strain gauges were attached to several struts to provide indications
of the magnitudes of loads applied to these components of the cofferdam system.
1.6 Objectives of Thesis
The objectives of this thesis were to analyze the geotechnical instrumentation
program data obtained by the USACE for the construction of two covered canals and to
use the results to accomplish the following:
•
Utilizing various design methods, estimate the magnitudes of loads applied to
the struts of the cofferdam systems.
•
Utilize the data obtained from the geotechnical instrumentation program to
determine the applicability of the various design methods for estimating the
strut loads in the cofferdam systems.
•
Make recommendations based on the results of the instrumentation program.
1.7 Organization of Thesis
This thesis consists of five individual sections. The first chapter contains an
the thesis. Literary research on sheeted and braced excavations is presented in Chapter
2. Chapter 3 covers the specifics of the geotechnical instrumentation program project
sites and includes the results of various theoretical methods for determining strut loads. A
compilation of the test data obtained from the geotechnical instrumentation program is
presented in Chapter 4 and the data is compared and contrasted with the theoretical strut
loads. Finally, in Chapter 5, conclusions and recommendations are made based on the
CHAPTER 2: LITERARY RESEARCH
2.1
Sheet Pile Walls
When excavations are made in soil, the soil adjacent to the cut loses its natural
lateral support. The stress unbalance caused by the removal of lateral support increases as
the excavation is made deeper and the cut is steepened. If the resulting shear stress
exceeds the soil’s strength the mass can fail by sliding. This can result in damage to
nearby facilities or structures and can disrupt the excavation and endanger workers.
When it is impractical to provide slopes flat enough for safety it becomes necessary to
support the excavation. Sheet piling, braces, and tiebacks can replace the lateral restraint
that was provided by the soil which was removed (American Society of Civil Engineers,
1997).
The essential elements of an excavation support system consist of a wall,
supports, and a reaction to the loads transmitted through the bracing. Sheet pile walls
have a number of features which distinguish them from other civil engineering structures.
First, installation of the system is coordinated with the excavation and in usually built
from the top downward. The excavation and support installation are performed in stages
and the critical case for various elements of the system can occur at intermediate stages
during the construction. Also, the support system is usually temporary with a life ranging
from several months to several years. Typically for these structures, the allowable factors
deformation of the support system can be as important as its load carrying capacity
(American Society of Civil Engineers, 1997).
The design of sheet pile walls requires several operations. First, the forces and
lateral pressure that act on the wall must be evaluated. Next, the depth of piling
penetration must be determined. The maximum bending moments in the sheet piling must
be determined. Also, the stresses in the wall need to be computed and the appropriate
sheet pile section must be selected. In the case of multi-braced excavations, these
operations must be performed for each stage of the excavation since the critical case for
each component of the support system may occur at different stages of the construction of
the system. Finally, the waling and bracing system must be designed. In order to perform
these operations, the controlling dimensions must be set. These dimensions include the
elevation of the top of the wall, the elevation of the ground surface in front of the wall,
and the water level.
Because of the structure of natural soil deposits is fairly complex, it is essential
that a subsurface investigation be performed. This investigation should consist of
exploratory soil borings and laboratory tests on representative samples. Once this has
been done, a soil profile can be drawn and the engineering properties of the different soil
strata can be determined. After these preliminary steps are taken the final design can
2.2
Loads On Sheet Pile Walls
2.2.1 Earth Pressure Theories
Earth pressure is the force per unit area exerted by the soil on the sheet pile
structure. Earth pressures reflect the state of stress in the soil mass. Earth pressure
depends on the physical and strength properties of the soil, the interaction at the
soil-structure interface, the groundwater conditions, and the deformations of the soil-soil-structure
system. Because earth pressure is a function of the soil-structure system, the movements
of the structure are a primary factor in developing earth pressures. Earth pressures for any
soil-structure system may vary from an initial state of stress referred to as at-rest, to a
minimum limit state referred to as active, or to a maximum limit state referred to as
passive (US Army Corps of Engineers, 1994).
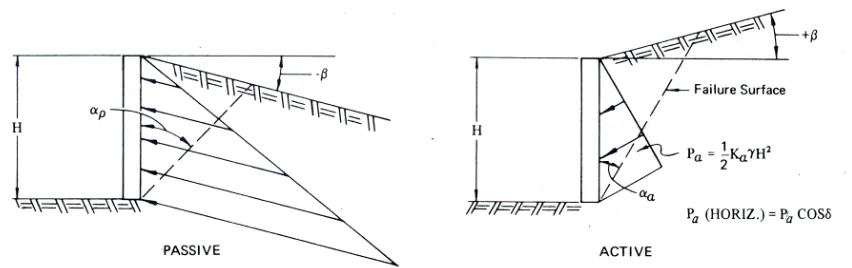
At-rest pressure refers to a state of stress where there is no lateral movement or
strain in the soil. In the case of at-rest pressure, the pressures are the pressures that
existed in the ground before the installation of the sheet pile wall. This state of stress is
Figure 2.1 Definition of active and passive pressures (US Army Corps of Engineers,
1994).
When a sheet pile wall deflects under the action of lateral earth pressure each
element of soil adjacent to the wall expands laterally which mobilizes shear resistance in
the soil causing a reduction in lateral earth pressure. The lowest state of lateral stress
which is produced when the full strength of the soil is activated is called the active state.
The active state develops when the wall moves or rotates away from the soil. The state of
stress resulting in active pressures is shown in Figure 2.1 as circle A (US Army Corps of
Engineers, 1994).
If the sheet pile wall moves toward the soil, lateral pressure will increase as the
shearing resistance of the soil is mobilized. The passive state exists when the full strength
of the soil is mobilized. Passive pressure is the maximum possible lateral pressure that
resist wall movements and failure. The state of stress resulting in passive pressure is
shown in Figure 2.1 as circle P (US Army Corps of Engineers, 1994).
The amount of wall movement required to develop minimum active or passive
earth pressures depends on the stiffness of the soil and the height of the wall. The
required movement for stiff soils such as dense sands or over consolidated clays is
relatively small. For sands of medium or higher density the movement required to reach
the minimum active pressure is no more than about 0.4 percent of the wall height or
about 1 inch for a 20-foot high wall. The movement required to increase the earth
pressure to the maximum passive value is approximately 10 times that required for the
minimum pressure or about 4.0 percent of the wall height. For loose sands the movement
required to reach the minimum active or maximum passive pressures is larger. Classical
design procedures assume that the sheet pile walls have enough movement to produce the
active or passive pressures (US Army Corps of Engineers, 1994).
In addition to the horizontal movement, vertical movement along the wall soil
interface may produce vertical stresses due to soil friction for granular soils or
wall-soil adhesion for cohesive wall-soils. This vertical stress will have an effect on the magnitude
of the minimum and maximum horizontal earth pressures. For the passive pressure, the
wall friction or adhesion can increase the horizontal earth pressure whereas it may
decrease the horizontal earth pressure for the active limit state (US Army Corps of
Engineers, 1994).
2.2.1.1 Rankine Theory
The Rankine Theory is based on the assumption that the sheet pile wall introduces
assumes that the ground and failure surfaces are straight planes and that the resultant
force acts parallel to the backfill slope. When the Rankine state of failure has been
reached, active and passive failure zones will develop as shown in Figure 2.2 (Pile Buck,
1987).
Figure 2.2 Rankine failure zones (Pile Buck, 1987).
The active and passive earth pressures for these states are expressed by the following
equations:
a a
a
γ
ZK
2c
K
p
=
−
p p
p
γ
ZK
2c
K
p
=
−
where
p
aand p
p= unit active and passive earth pressure, at a depth Z below the
ground surface
γ
Z = vertical pressure at a depth Z due to the weight of the soil above
c = unit cohesion of the soil
K
aand K
p= coefficients of active and passive earth pressures
The coefficients according to Rankine’s theory are given by the following
−
+
−
−
=
φ
φ
2 2 2 2 acos
β
cos
cos
β
cos
β
cos
cos
β
cos
β
K
−
−
−
+
=
φ
φ
2 2 2 2 pcos
β
cos
cos
β
cos
β
cos
cos
β
cos
β
K
where
φ
= angle of friction of soil
β
= angle off backfill with respect to the horizontal
If the embankment is level (
β
=0), the equations are reduced to:
−
=
+
−
=
tan
45
2
sin
1
sin
1
K
2a
φ
φ
φ
+
=
−
+
=
tan
45
2
sin
1
sin
1
K
2p
φ
φ
φ
The Rankine theory for passive pressures can only be used correctly when the
embankment slope angle is zero or negative. If a large wall friction value can develop,
the Rankine theory is not correct and will give less conservative results (Pile Buck,
1987).
2.2.1.2 Coulomb Theory
An assumption of the Rankine Theory is that the sheet pile wall does not affect
the shearing stresses at the soil-structure interface. However, since the friction between
the wall and the soil has an effect on the vertical shear stresses in the soil, the lateral
stresses in the soil are different then those assumed by the Rankine Theory. This error can
be avoided by using the Coulomb Theory. The Coulomb Theory provides a method of
analysis that gives the resultant horizontal force on a wall for any slope of wall, wall
shear resistance develops along the wall and failure plane. As the wall yields, the
failure wedge tends to move downward for the active case and for the passive case, where
the wall is forced against the soil, the wedge slides up the along the failure plane. These
movements of the wedge involve vertical displacements between the wall and the backfill
and create stresses on the back of the wall due to soil friction and adhesion. Because of
this the resulting force is inclined at an angle to the normal to the sheet pile wall. This
angle is known as the angle of wall friction,
δ
(Pile Buck, 1987).
The following coefficients are for a horizontal resultant pressure and a vertical
wall (Pile Buck, 1987):
(
) (
)
22 a
cos
cos
sin
sin
1
cos
cos
K
+
−
+
=
β
δ
β
φ
δ
φ
δ
φ
(
) (
)
22 p
cos
cos
sin
sin
1
cos
cos
K
+
+
−
=
β
δ
β
φ
δ
φ
δ
φ
where
φ
= angle of internal friction of soil
δ
= angle of wall friction
β
= angle of the backfill with respect to the horizontal
Although the Coulomb Theory assumes a plane failure surface just as in the Rankine
Theory, the position of the failure plane in the Coulomb Theory is a function of both the
φ
-angle of the soil and the angle of wall friction,
δ
. The position of the failure plane for
the active and passive cases for level backfill is given by the following expressions (Pile
(
)(
)
(
)
+
+
⋅
+
+
+
−
−
−
=
φ
φ
δ
φ
δ
φ
φ
φ
φ
φ
cot
tan
tan
1
cot
tan
1
cot
tan
tan
tan
arctan
90
α
0 a(
)(
)
(
)
+
+
⋅
+
+
+
−
+
=
φ
φ
δ
φ
δ
φ
φ
φ
φ
φ
cot
tan
tan
1
cot
tan
1
cot
tan
tan
tan
arctan
90
α
0 pwhere
α
aand
α
p= angle between the failure plane and the vertical for the active and
passive cases
Figure 2.3 shows the Coulomb active and passive failure wedges together with the
corresponding pressure distributions (Pile Buck, 1987).
Figure 2.3 Coulomb earth pressure (Pile Buck, 1987).
2.2.2 Surcharge
Loads
Sheet pile walls are often required to retain surface loadings as well as the soil
behind them. Loads due to stockpiled material, railroads, machinery, roadways,
buildings, and other influences resting on the soil surface in the vicinity of the wall
of lateral soil pressures are uniform surcharge loads, point loads, line loads, and strip
loads. For uniform loads the conventional theories of earth pressure can be used.
Conversely, the effects of point, line, and strip loads are evaluated using the theory of
elasticity (US Army Corps of Engineers, 1994).
2.2.2.1 Uniform Surcharge
A uniform surcharge is assumed to be applied at all points on the soil surface. The
effect of the uniform surcharge is to increase the effective vertical pressure by an amount
equal to the magnitude of the surcharge. Without the surcharge, the vertical pressure at a
depth h would be equal to
γ
h. When a uniform surcharge with a magnitude q is added, the
vertical pressure at a depth h is equal to
γ
h + q. The lateral pressure due to the uniform
surcharge load is equal to the magnitude of the surcharge times the lateral earth pressure
coefficient. The lateral earth pressure coefficient is either the active coefficient or the
passive coefficient depending on whether the wall tends to move away from or toward
the surcharge area. The uniform lateral earth pressure is then added to the lateral dead
weight earth pressures (US Army Corps of Engineers, 1994).
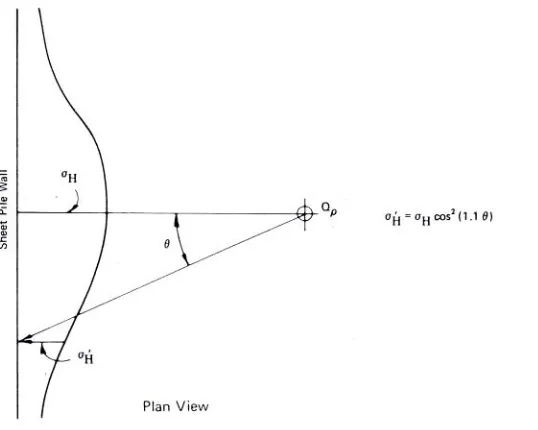
2.2.2.2 Point
Loads
A surcharge load distributed over a small area may be considered as a point load.
The lateral pressure distribution on a vertical line closest to the point load may be
Because the pressures due to point loads vary horizontally parallel to the sheet
pile wall, it may be necessary to consider several unit slices of the wall for design. As the
distance from the line closest to the point load increases, the lateral stress decreases as
shown in Figure 2.5 (Pile Buck, 1987).
Figure 2.4 Lateral pressure due to point load (Pile Buck, 1987).
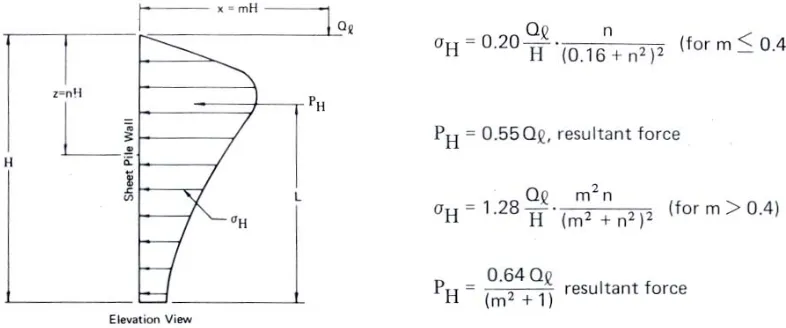
2.2.2.3 Line
Loads
A continuous load parallel to the sheet pile wall but of narrow width may be
treated as a line load. For line loads, the lateral pressure increases from zero at the ground
surface to a maximum value at a given depth and gradually diminishes at greater depths.
The lateral pressure on the sheet pile wall due to a line load may be calculated as shown
in Figure 2.6 (Pile Buck, 1987).
Figure 2.6 Lateral pressure due to line load (Pile Buck, 1987).
2.2.2.4 Strip
Loads
Continuous loads parallel to the sheet pile wall but of finite extent perpendicular
to the wall may be treated as strip loads. Highways and railroads are examples of strip
loads. The lateral pressure distribution on the sheet pile wall due to strip loads may be
Figure 2.7 Lateral pressure due to strip load (Pile Buck, 1987).
Any negative pressures calculated for strip loads should be ignored.
2.2.3 Water Loads
A difference in water level on either side of the sheet pile wall introduces
additional pressure on the back of the wall due to hydrostatic load and reduces the unit
weight of the soil in front of the wall thus reducing the passive resistance. Water
pressures are calculated by multiplying the depth of the water by the specific weight of
the water. If hydrostatic conditions are assumed, the unbalanced hydrostatic pressure is
assumed to act along the entire depth of the sheet pile wall. This water pressure is added
to the effective soil pressures to obtain total pressures (US Army Corps of Engineers,
1994).
2.3 Design of Sheet Pile Walls
The design of sheet pile walls requires several successive operations. First, the
depth of sheet piling penetration must be determined. Then the maximum bending
moments and stresses in the wall must be determined so that the appropriate sheet pile
section can be selected. Finally, the waling and anchoring system must be designed (Pile
Buck, 1987).
2.3.1 Preliminary Data
Before the design of the sheet pile system can commence, certain preliminary
information must be obtained. The elevation of the top of the wall, the ground surface
profile on each side of the wall, and the water elevation on each side of the wall must be
determined. The soil profile including location and slope of subsurface layer boundaries,
strength parameters, and unit weight for each layer must also be obtained. In addition, the
magnitudes and locations of surface surcharge loads and external loads applied directly to
the wall must be established (US Army Corps of Engineers, 1994).
2.3.2 Factors of Safety
There have been a variety of methods proposed for introducing “factors of safety”
into the design process; however, no universal method has been established. The design
of a sheet pile wall should contain some degree of conservatism consistent with the
designer’s experience and the reliability of the values assigned to the various system
parameters. A method that has gained acceptance in the Corps of Engineers is to apply a
factor of safety to the soil strength parameters
φ
and c while using “best estimates” for
The soil pressures are evaluated by using “effective” values of
φ
and c, which are
given by (US Army Corps of Engineers, 1994):
φ
eff= tan
-1(tan(
φ
)/FS)
c
eff= c/FS
where FS = factor of safety
2.3.3 Net Pressure Distribution
Sheet pile walls are subjected to a number of different pressure distributions.
These pressure distributions include: (1) active and passive soil pressures due to the
retained side soil, (2) pressures due to surcharge loads on the retained side surface, (3)
active and passive soil pressures due to the dredge side soil, (4) pressures due to
surcharge loads on the dredge side surface, and (5) net water pressures due to differential
head. For convenience in the calculation of stability, the individual pressure distributions
are combined into “net” active and passive pressures according to:
“Net Active Pressure” = retained side active soil pressure
- dredge side passive soil pressure
+ net water pressure
+ pressure due to retained side surcharge
- pressure due to dredge side surcharge
“Net Passive Pressure” = retained side passive soil pressure
- dredge side active soil pressure
+ net water pressure
In these definitions, positive pressures tend to move the wall toward the dredge side.
Typical net pressure diagrams are shown in Figure 2.8 (US Army Corps of Engineers,
1994).
Figure 2.8 Typical net pressure distributions (US Army Corps of Engineers, 1994).
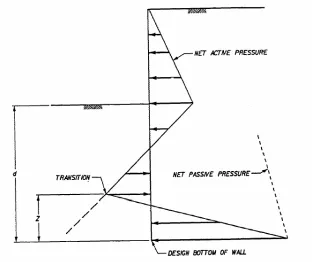
2.3.4 Cantilever Walls
In the case of cantilever walls, sheet piling are driven to a sufficient depth into the
ground to become fixed as a vertical cantilever in resisting the lateral active earth
pressure. The depth of penetration of the sheet piling governs the rotational stability of a
cantilever wall. Cantilever walls undergo large deflections and are readily affected by
scour and erosion in front of the wall. Since the lateral support for a cantilever wall
comes from the passive pressure on the embedded portion, penetrations can be quite high,
Cantilever walls are subjected to the net active pressure distribution from the
top of the wall to a point near the point of zero displacement known as the transition
point. The design pressure is then assumed to vary linearly from the net active pressure to
the net passive pressure at the bottom of the wall. This design pressure distribution is
shown in Figure 2.9. The sum of the horizontal forces and the sum of the moments about
any point along the wall must be equal to zero for the wall to be in equilibrium. The two
equations of equilibrium can be solved for the location of the transition point and the
required depth of penetration. Because the simultaneous equations are non-linear, a trial
and error solution is required (US Army Corps of Engineers, 1994).
2.3.5
Anchored Walls
Anchored sheet pile walls get their support by two means: (1) passive pressure on
the front of the embedded portion of the wall and (2) anchor tie rods near the top of the
wall. The overall stability of anchored sheet pile walls depends on the interaction of a
number of factors, such as the stiffness of the sheet piling, the depth of the piling
penetration, the compressibility and strength of the soil, and the amount of anchor yield
(Pile Buck, 1987).
Several methods have been proposed for the design of anchored sheet pile walls.
These methods have been classified as the “Free Earth” and “Fixed Earth” methods. In
the Free Earth method, the passive pressures in front of the wall are insufficient to
prevent lateral deflection and rotations at the tip of the sheet piling. In the Fixed Earth
method, passive pressures have sufficiently developed on both sides of the wall to
prevent both lateral deflection and rotation at the tip of the sheet piling. Figure 2.10
illustrates the difference between the Free Earth and Fixed Earth methods. Experience
over the years has shown that walls designed by the Free Earth method are sufficiently
stable walls with less penetration than those designed by the Fixed Earth method. The
Free Earth method predicts larger moments than those that actually occur because of the
flexibility of the sheet piling (Pile Buck, 1987).
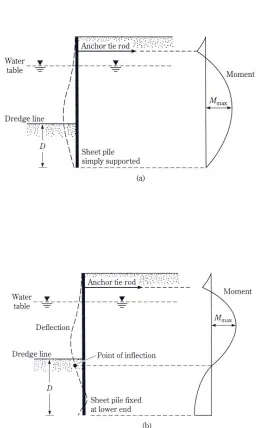
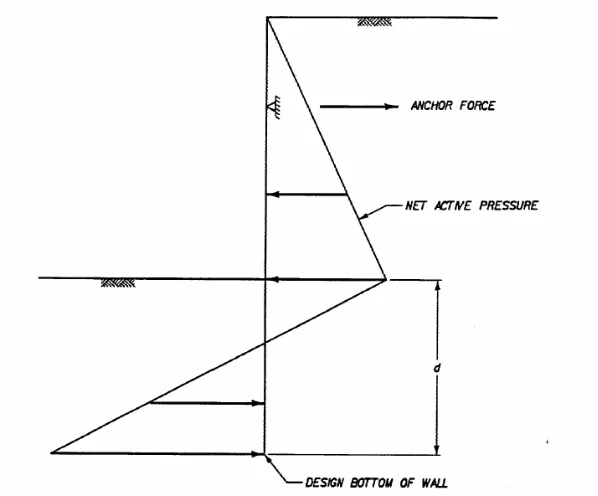
2.3.5.1 Free Earth Method
In the Free Earth method, the anchor is assumed to be a rigid simple support about
which the sheet pile wall rotates as a rigid body as shown in Figure 2.11. It is assumed
The required penetration of the sheet pile wall is determined from the equilibrium
requirement that the sum of the moments about the anchor is zero. After the penetration
has been determined, the anchor force is obtained by setting the sum of the horizontal
forces equal to zero (US Army Corps of Engineers, 1994).
Figure 2.11 Anchored Wall (US Army Corps of Engineers, 1994).
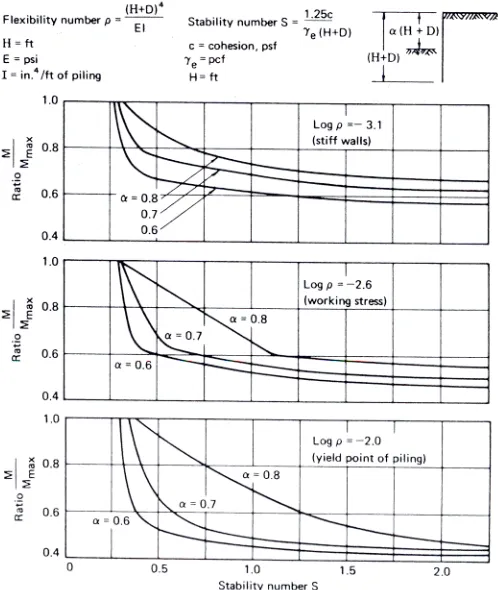
2.3.5.2 Rowe’s Moment Reduction Theory
Steel sheet piling is flexible and so sheet pile walls yield which redistributes the
lateral earth pressures. The bending moment in sheet piling generally decreases with the
increasing flexibility of the piling. With increasing flexibility, the buried part of the piling
assumes a rotation about the lower edge of the bulkhead causing the center of the passive
pressure to move closer to the dredge line. This decreases the maximum bending moment
calculated by the Free Earth method. For that reason, Rowe suggested a procedure to
reduce the maximum design moment on sheet pile walls obtained from the Free Earth
method. For sheet pile walls penetrating sand, Rowe has established a relationship
between the degree of flexibility of an anchored bulkhead, expressed as a coefficient
ρ
,
and the reduction of actual bending moment, M, as compared to the Free Earth support
value M
max. The coefficient
ρ
can be determined by (Pile Buck, 1987):
ρ
= (H + D)
4/EI
where
H = height of the wall
D = depth of penetration
E = modulus of elasticity of the wall
I = moment of inertia of the wall section
Figure 2.13 shows the relationship between the ratio M
d/M
maxand
ρ
for both medium
dense and very dense granular soils. For a given sheet pile section,
ρ
and M
d/
Mmaxcan be
plotted on Figure 2.13. If the point falls above the curve for the appropriate soil density
Figure 2.13 Rowe’s moment reduction curves (Pile Buck, 1987).
Rowe has also developed a moment reduction technique for sheet piles
penetrating clays. This technique introduces a term known as the stability number. The
stability number is the ratio of the cohesion below the dredge line to
γ
eH at the dredge
line and is a measure of the net passive resistance. To account for adhesion Rowe
proposed the following definition (Pile Buck, 1987):
H
γ
c
1.25
c
c
1
H
γ
c
(S)
number
stability
e a
e
=
+
=
Figure 2.14 shows the relationship between the stability number and the ratio of the
design moment to the maximum moment calculated by the Free Earth method for various
Figure 2.14 Moment reduction for cohesive soils (Pile Buck, 1987).
2.3.5.3 Fixed Earth Method
The Fixed Earth method is based on the assumption that the toe of the sheet pile is
restrained from rotating. The deflected shape of the wall reverses its curvature at a point
of contraflexure and becomes vertical at the tip. The wall acts like a partially built-in
beam subjected to bending moments. To produce this shape the wall must be driven deep
enough so that the soil beneath the dredge line provides the required restraint on the
bulkhead deformations (Pile Buck, 1987).
A simplified method, developed by Blum, called the equivalent beam method is
developed by Blum. This method is limited to use in granular soils. This method
assumes a hinge at the point of contraflexure, since the bending moment there is zero.
The part above the hinge can be treated as a separate freely supported beam with an
overhanging end. The reactions R and T and the bending moments can then be
determined from statics and simple beam theory. The portion below the point of
contraflexure can also be analyzed as a separate freely supported beam on two supports,
R and C (Pile Buck, 1987).
Figure 2.15 Equivalent beam method (Pile Buck, 1987).
The distance y can be determined from:
a p
a e
p'
p'
HK'
γ
y
−
=
where
γ
eH = weight of backfill and surcharge load above the dredge line
K’
a= coefficient of active earth pressure for the soil below the dredge line
The point of contraflexure can be determined using the chart in Figure 2.15(e). The
at b and at the anchor level. The dimension eb is determined by treating the lower
portion of the piling as a simple beam and equating the moment about the base to zero.
The depth of penetration, D, is equal to the sum of eb and x. To provide a margin of
safety, 20 to 40 percent can be added to the calculated depth of penetration. Generally the
point of contraflexure and the point of zero pressure are very close and the value of x can
be taken equal to y. In this case, the depth of penetration can be expressed as (Pile Buck,
1987):
a p
p'
p'
6R
y
D
−
+
=
where
y = distance form the dredge line to the point of zero pressure
R = horizontal reaction at o
p’
p, p’
a= passive and active earth pressures in the soil below the dredge line
2.4 Braced Cofferdams
Single anchor walls are only feasible for shallow depths. For deep excavations it
becomes necessary to use multi-braced sheet pile walls which are also referred to as
cofferdams. Cofferdams are retaining structures, usually temporary in nature, which are
used to support the sides of deep excavations. Cofferdams usually consist of steel sheet
piling braced by a system of wales and struts. Cofferdams are used in excavations in
urban areas where the need to prevent settlement of the adjacent ground is of prime
importance or where there is not enough space available for flat slopes (Pile Buck, 1987).
Generally, the method of construction of cofferdams begins with steel sheet piling
being driven into the ground to a predetermined depth. During the excavation, the steel
system of struts for each wale system must be in place and against the sheeting before
the excavation can continue in order to prevent lateral deflection. This installation
process needs to be determined during the design of the cofferdam. The designer must
determine the elevation of the first level of struts based on allowable moment and
deflection in the cantilever sheet pile. Each subsequent strut elevation is determined
based on the allowable moment and deflection in the sheeting and allowable load for the
struts. The designer also must consider what kind of work is taking place and what type
of equipment is being used so that the strut spacing will allow room for this work and
equipment.
The design of a temporary cofferdam usually begins with a subsurface
investigation to provide general information about the site and the soil strata. After the
soil parameters are obtained, the lateral earth pressures against the sheeting are computed.
The cofferdam components can then be sized by selecting wale spacing and sizing the
sheeting and struts. If the moments in the sheeting are too large, the spacing of the wales
can be reduced. Also, if the wales are too large, the spacing of the struts can be reduced,
however the struts should be wide enough to allow easy access through the system during
construction. Once the components have been sized, the cofferdam can be analyzed for
overall stability and for safety against piping (Pile Buck, 1987).
There are some benefits to be had by driving the sheet piling to greater depths
than the design depth of the excavation. In soft clays, the additional penetration aids in
resisting the heave in the bottom of the excavation. In granular soils, greater wall depths
serve as a cutoff wall and reduce the danger of piping and the formation of boils (Pile
2.4.1 Lateral Pressure Distribution
Once the subsurface investigation is complete, the next step is to determine the
loads acting on the cofferdam. The cofferdam may be subjected to earth pressures,
surcharge loads, and hydrostatic pressures. The lateral pressures on the cofferdam due to
surcharges can be calculated the same as the lateral pressures on cantilever and single
anchor walls, however the lateral earth pressures cannot be calculated by the classical
theories. The braced wall is subjected to earth pressures, just as other retaining structures,
except with the bracing limiting the wall movement the soil behind the wall is not likely
to be in an active state. The pressure is more likely to be somewhere between the active
and at-rest states. With the braces the wall is pressed against the retained soil which
means that the pressure profile behind the wall is more trapezoidal than triangular. Figure
2.16 shows the development of wall pressures behind a braced cofferdam (Pile Buck,
1987).
At the time the first row of struts is placed the excavation is not deep enough to
have appreciably altered the state of stress in the soil. The lateral pressure at the first row
of struts is higher than the active pressure since no significant yielding of the soil has
occurred. As the excavation continues to the next row of struts, the stiffness of the first
row of struts prevents yielding of the soil near the surface. The external lateral pressure
tends to rotate the sheet piling about the upper struts causing some inward displacement
of the sheet piling at the level of the second struts. As the excavation continues, greater
deflections occur at the lower struts. These deflections mobilize soil strength and produce
an arching effect which reduces the lateral pressures. At the completion of the
excavation, the sheeting will have deformed to the position shown in Figure 2.17. The
resulting lateral pressure diagram will have the maximum values occurring in the upper
portion of the sheet pile wall which is in disagreement with the Rankine and Coulomb
theories (Pile Buck, 1987).
For that reason, empirical pressure envelopes developed from field observations
are used for the design of braced excavations. After observations of several braced cuts
during the construction of the Chicago subway system, Peck and later Terzaghi and Peck
suggested using apparent pressure diagrams for braced cuts in sands and clays. These
apparent pressure diagrams were obtained as the envelope of the maximum pressures that
were found and plotted for several projects. The pressure envelope was given a maximum
value based on a portion of the active earth pressure using the Coulomb or Rankine
pressure coefficient. An illustration of the proposed apparent pressure diagrams is shown
in Figure 2.18 (Bowles, 1996).
For stratified soils, Peck proposed that an equivalent value of cohesion and an
average unit weight of the layers be used with the pressure envelopes in clay to design the
cuts (Pile Buck, 1987).
(
)
[
s s 2s s s u]
av
γ
K
H
tan
H
H
n'
q
2H
1
c
=
φ
+
−
(
)
[
s s s c]
av
γ
H
H
H
γ
H
1
γ
=
+
−
where
H = total height of the cut
γ
s= unit weight of sand
H
s= height of the sand layer
K
s= a lateral earth pressure coefficient for the sand layer
φ
s= angle of friction of sand
q
u= unconfined compression strength of clay
γ
c= unit weight of clay
n’ = a coefficient of progressive failure (ranging from 0.5 to 1.0)
2.4.2 Sizing of Cofferdam Components
Once the pressure diagram has been completed, a structural analysis can be
performed in order to size the sheet piling, wales, and struts. The steel sheet piling
making up the wall can be designed either as a continuous beam over several strut points
or as a series of pinned beams making each span statically determinant. The maximum
moment per foot of wall can be computed from the following equations (Pile Buck,
1987):
M
max= (1/10) wL
2continuous spans
M
max= (1/8) wL
2separate single spans
where
If the base of the excavation is unstable and heave is a problem, the sheet piling
may be driven deeper into the ground. This results in an unbalanced force acting on the
buried length (Figure 2.19). If this occurs, the steel sheeting is then designed as a
cantilever below the last strut using the following equation for the maximum moment in
the sheet (Pile Buck, 1987):
M
max= (1/3) wL
2where
L = vertical strut spacing
Figure 2.19 Deflected sheet pile wall with unbalanced force (Pile Buck, 1987).
Once the maximum moment is determined, the required section modulus of the sheet
piling is given by
all max
σ
M
S
=
where
The wales are designed to resist the horizontal reactions from the sheet piling
and may be designed as pin-ended or as continuous across the anchor points. If the
excavation is of closed geometry then the wales are subject to an axial load due to the
reaction from the perpendicular wales at the corners and should be designed including
both lateral and axial loads. The location of the first wale can be estimated by making a
cantilever wall analysis using several trials for the dredge line location and by inspecting
the output for lateral movement into the excavation (Pile Buck, 1987).
The struts are actually beam-columns subjected to an axial force (Figure 2.20) and
bending from member self-weight. The struts are designed as compression members with
buckling being the primary consideration. The carrying capacity of the strut is inversely
proportional to the ration (L/r)
2. The spacing between the struts must be designed in such
a manner that the axial loads and the L/r ratios are kept within acceptable limits. From the
construction standpoint, the spacing between the struts may be dictated by the required
Figure 2.20 Simplified method of computing strut forces (Bowles, 1996).
2.4.3 Stability of Cofferdams - Heaving in Soft Clay
As the depth of a cut increases, the soil outside the wall behaves like a surcharge
with respect to the clay inside the enclosure and causes the soil beneath the excavation to
rise. This movement extends a considerable distance below the bottom of the cut unless a
firm base exists within a short distance below the excavation level. If the depth of the cut
becomes too deep with respect to the strength of the clay, the heave at the bottom of the
excavation may become uncontrollable and settlements of the surrounding ground surface
may become excessive and the bracing system may collapse. The conventional method
for investigating heave was developed by Terzaghi and is shown in Figure 2.21 (Peck,
Figure 2.21 Mechanism for failure of the bottom of a deep excavation (Pile Buck,
1987).
The vertical column of soil along the sheeting exerts a pressure on the horizontal
plane AA’. When the pressure exerted by the soil column exceeds the bearing capacity of
the soil beneath the sheet piling a bearing type failure will occur resulting in heave of the
bottom of the excavation and settlement of the surrounding ground surface. The depth of
the excavation at which heave will occur can be determined by (Pile Buck, 1987):
B)
(forH
B
c
2
γ
5.7c
H
c<
−
=
where
H
c= critical height of the excavation (ft)
B = width of excavation (ft)
γ
= unit weight of soil (pcf)
c = unit cohesion of soil (psf)
This method is used for excavations where the width of the cofferdam is larger than the
depth of the excavation and the cofferdam is very long. For cases where the cofferdam is
width a method of analysis developed by Bjerrum and Eide can be used. The depth of
the excavation at which heave will occur can be determined by (Pile Buck, 1987):
B)
H
(for
γ
c
N
H
c c
>
=
where
H
c= critical height of the excavation
excavation
of
depth
within
soil
of
weight
unit
average
γ
=
c = unit cohesion of soil
N
c= bearing capacity factor-to be determined using Figure 2.22
Figure 2.22 Diagram for the determination of bearing pressure coefficient, N
c(Pile
Buck, 1987).
2.5 Soil-Structure Interaction Analysis
The classical design methods mentioned earlier rely on simplifying and
contradictory assumptions regarding the behavior of the wall-soil system. There are
several anomalies that are contained in the classical design methods. First, there are
incompatible pressures and displacements. In both the cantilever and anchored wall
pressure at every point along the wall without regard to the magnitude or direction of
wall displacement. The effects of the wall and anchor flexibilities are ignored and the
displacements are calculated based on hypothetical supports. Another anomaly contained
in the classical design methods is the effect of sheet pile penetration. In the classical
design methods a greater penetration than that required for stability indicates an increase
in the factory of safety, soil pressures, bending moments, anchor forces, and deflections.
An increase in penetration should be expected to result in reduced deflections. Finally,
the approximate methods proposed for multiple anchor walls introduce further
simplifying assumptions regarding system behavior and suffer from the same limitations
as single anchor walls (US Army Corps of Engineers, 1994).
2.5.1 Soil-Structure Interaction Method
The soil-structure interaction (SSI) method of analysis enforces compatibility of
deflections, soil pressures, and anchor forces while accounting for wall and anchor
flexibilities. The SSI method described here is based on a one-dimensional finite element
model of the soil-wall system consisting of linearly elastic beam-column elements for the
wall, distributed non-linear Winkler springs to represent the soil and non-linear
concentrated springs to represent any anchors (US Army Corps of Engineers, 1994).
2.5.2 Preliminary Information
Before the SSI method of analysis can commence, certain preliminary
information must be obtained. The elevation of the top of the wall, the ground surface
profile on each side of the wall, and the water elevation on each side of the wall must be
strength parameters, and unit weight for each layer must also be obtained. In addition,
the magnitudes and locations of surface surcharge loads and external loads applied
directly to the wall must be established. Also, the penetration of the sheet piling, the sheet
piling material and cross-sectional properties such as the area, moment of inertia, and
modulus of elasticity must be obtained. Finally, the anchor properties such as the anchor
area, modulus of elasticity, and flexible length are needed. These properties will be
available for analysis of an existing wall-soil system. If a new system is being designed,
an initial design using one of the classical methods may be performed and the SSI
analysis can be used to refine the design (US Army Corps of Engineers, 1994).
2.5.3 Soil-Structure Interaction Model
As stated before, the SSI model is comprised of beam-column elements for the
wall, distributed non-linear Winkler springs for the soil, and non-linear concentrated
springs for any anchors. An illustration of a typical 1-foot slice of a wall-soil system is
shown in Figure 2.23. Nodes in the model are place at the top and bottom of the wall, at
soil layer boundaries on each side of the wall, at the ground water elevation on each side
at the anchor elevations, and at other intermediate elevations to assure that the length of
the beam is no more than 6 inches. Distributed soil springs and concentrated anchor
Figure 2.23 System for Soil Structure Interaction analysis (US Army Corps of
Engineers, 1994).
There is currently no acceptable procedure to account for the effects of wall friction or
adhesion in resisting vertical motions of the wall. The effects of these factors are included
in the assessment of the lateral resistance of the soil. Conventional matrix structural
analysis is used to relate the deformations of the wall-soil system to the applied external
forces. For a system with N nodes the resulting system is a system of 3N non-linear
simultaneous equations that must be solved by iteration (US Army Corps of Engineers,
1994).
2.5.4 Non-linear Soil Springs
As stated before, distributed non-linear Winkler springs are used to represent the
soil. The forces exerted by the distributed soil springs vary with lateral wall displacement
between the active and passive limits as shown in Figure 2.24 (US Army Corps of
Figure 2.24 Distributed soil springs (US Army Corps of Engineers, 1994).
The active and passive soil pressures are calculated by classical earth pressure theories
including wall-soil friction and adhesion. The at-rest pressure, which corresponds to zero
wall displacement, is calculated using the following equation (US Army Corps of
Engineers, 1994):
p
o= p
vK
owhere
p
o= at-rest earth pressure at the point of interest
p
v= effective vertical soil pressure at the point of interest
K
o= at-rest soil coefficient
The variation of soil pressure between the active and passive limits follows a curved path,
but a simplified linear representation like the one shown in Figure 2.24 is used. The
displacements at which the limiting active or passive pressures are reached are dependent
on the type of soil and the flexibility of the wall. These influences are functions of the
significantly stressed. With these values the transition displacements for sand can be
obtained as
d)
)/(
γ
p
(s
p
p
∆
v a a oa
⋅
⋅
−
=
d)
)/(
γ
p
(s
p
p
∆
v p o pp
⋅
⋅
−
=
and for clay as
)/(d)
(s
p
p
∆
a a o a−
=
)/(d)
(s
p
p
∆
p o p p−
=
where
p
a, p
o, and p
p= active, at-rest, and passive pressures
s
aand s
p= active and passive soil stiffnesses, respectively
p
v= effective vertical soil pressure
g = effective soil unit weight
d = interaction distance, all at the node of interest
2.5.5 Non-linear Anchor Springs
Anchors are represented in the SSI model as concentrated non-linear springs. The
force in the spring varies with wall displacement as shown in Figure 2.25. The limiting
tension force is given by
F
t= A
rf
ywhere
Figure 2.25 Anchor spring (US Army Corps of Engineers, 1994).
The limiting compressive force of the anchor depends on how the anchor is connected to
the wales and the axial load capacity or rod buckling of the anchor. The limiting
compressive force may vary from zero to the yield value given for tension. The
displacements at which the linear variation of force ceases are given by
a t
A
E
L
F
∆
yt
=
a c