ISSN: 2374-2380 (Print) 2374-2399 (Online) Copyright © The Author(s). 2014. All Rights Reserved. Published by American Research Institute for Policy Development
Learning by Seeing Before Learning by Doing: The Role of Observation and Intervention in Learning Direct and Inverse Relationships
Amanda M. Kelley1 and Chris P. Long1,2
Abstract
Identification of relationships in the environment is an essential skill. Arguably, the most common sequence through which learning occurs is passive observation followed by some form of active intervention. We present a set of two experiments evaluating the role of relationship type in causal judgment following a sequence of observation and intervention tasks and a third experiment comparing judgments made from observation to those from intervention tasks. The results show that ratings of generative relationships differed from those of inhibitory and unrelated samples whereas the ratings of inhibitory and unrelated samples did not differ from each other. Also, the findings show that final judgments are reflective of both observation and intervention task data when positively correlated data but not negatively correlated data is presented in the observation task. These findings suggest that generative relationships are more readily apparent whereas inhibitory relationships are more difficult to detect.
Keywords: causal judgment, correlation, generative, inhibitory
1.1 Introduction
Identifying relationships in one’s environment is an essential skill. Understanding causation allows us to explain the past, navigate the present, and predict the future. Research on these relationships has yielded a number of theories and explanatory models including the Power PC theory, the event rarity hypothesis, and the Rescorla-Wagner associative learning theory (Cheng, 1997; McKenzie &Mikkelson, 2007; Rescorla& Wagner, 1972). Collectively, these theories outline a number of ways that individuals learn about and decipher relationships.
1United States Army Aeromedical Research Laboratory, Fort Rucker, AL 36330, USA.
2PhD, Management Area, Hariri Building 556, McDonough School of Business, Georgetown
In this paper, we contribute to this literature by demonstrating how the type of relationship that an individual encounters influences how accurately he or she is able to identify that relationship in a simple context using both active and passive information acquisition roles. This research specifically demonstrates that while individuals can easily identify generative (i.e., positive) relationships, they have a more difficult time identifying inhibitory (i.e., negative) relationships of equal strength.
We examine this phenomenon through a sequence of observation tasks followed by intervention tasks. Observation describes the earlier stage or lower-order causal judgment process where individuals “learn by seeing” to form initial judgments about causal relationships by examining pre-existing summaries of data (Hattori &Oaksford, 2007). Intervention describes a more active approach to data gathering and evaluation where individuals “learn by doing” and iteratively assess the probability of a predictor causing a particular outcome. This higher-order causal judgment process has been effectively reproduced in experimental research where participants who encounter intervention-based tasks are often asked to apply a potential, causal factor to a problem and then observe the effects produced by those actions. Based on the frequency of effects/non-effects observed through these trial and error processes, individuals generate data to help them assess the degree to which a particular cause will elicit/inhibit a particular effect. Additionally, this active role allows for the individual to assess causal direction as well (e.g., Lagnado&Sloman, 2004). This paper focuses on causal strength, however, excluding two other important components of understanding causal relationships; causal structure and directionality.
Building on previous research (e.g., Griffiths &Tenenbaum, 2005; Waldmann&Hagmayer, 2005), in this paper we extend investigation of observation and intervention from determining causal direction to using covariation information presented in an observation-intervention sequence for determining causal strength. We present two studies evaluating perception of causal strength using 1) generative relationships, 2) inhibitory relationships, and a third study examining whether causal strength judgments are influenced by an active versus passive role in information acquisition. Our findings reveal that while individuals are able to readily detect generative relationships in the observation-intervention task sequence, individuals are less able to detect inhibitory relationships despite the influential role of the task (observation versus intervention).
1.2 Background
The key question that we examine in this paper is how causal judgments that are generated through observation and intervention together may be influenced by the types of relationships that individuals encounter. Observation and Intervention describe two processes that individuals use to learn and categorize information in forming their beliefs about causal relationships (Busemeyer, 1990; Chapman, 1967; Crocker, 1981; Kareev, 2005). Individuals use these processes to assess the probability that a causal relationship exists (or does not exist) or a particular event will (or will not) occur.
While studies of covariation detection and causal judgment typically examine samples in which the relationship between causes and effects are positive/direct or zero, the relatively few studies that incorporate samples with negative/inverse or indeterminate correlational relationships suggest that individuals are less able to learn these relationships (e.g., Levin, Wasserman, & Kao, 1993; Lipe, 1990; Wasserman, Dorner, & Kao, 1990). Because individuals tend to more easily identify generative relationships, there is a concern that individuals’ judgments of covariation and causation may be biased in the direction of generative relationships.
In particular, research shows that people show differential preference to different types of information in judgments of causal strength. Specifically, people tend to weight conjunctive observations (specifically, observations of the joint occurrence of cause and effect variables) more heavily in their judgment process than disjunctive observations (e.g., presence of cause or effect and absence of the other; Levin, Wasserman, & Kao, 1993; Lipe, 1990; Wasserman, Dorner, & Kao, 1990). However, arguably more interesting to the present study, researchers have argued that observations of non-occurrence are ignored (Hattori &Oaksford, 2007) or uninformative under some conditions (McKenzie &Mikkelson, 2007) when determining causal strength. This bias may influence judgments made by observation versus intervention tasks given that participants control what type of info they collect in intervention tasks whereas they may simply ignore information passively observed and deemed uninformative. This distinction in control over available information may result in varied perceptions of generative and inhibitory relationships dependent on the mode of information acquisition.
1.3 Experiment 1
1.3.1 Method
In this experiment, we evaluated participants’ judgments of generative and inhibitory relationships using a combination of observation and intervention tasks. In the observation task, participants view a summary of observations and use this information to judge the relationship between the variables. The correlation between the variables in the sample shown is labeled as the observation task sample correlation. In the intervention task, participants collect data observations, one at a time, by making an active decision about whether to apply the causal candidate and then subsequently learn whether the effect occurs. The correlation of the population from which the samples are drawn is manipulated. However, the type of relationship (generative,
inhibitory, or not related) the sample represents is labeled as the intervention task relationship type. Participants then use the information from both tasks to form a final judgment.
The purpose of the experiment is to determine the extent to which this final judgment reflects a bias towards one type of relationship in an observation-intervention sequence.
1.3.1.1 Design
In experiment 1, we use a within-subjects design where we manipulate
observation task sample correlation levels positive (ΔP = 0.50) and zero (ΔP = 0.00) the order
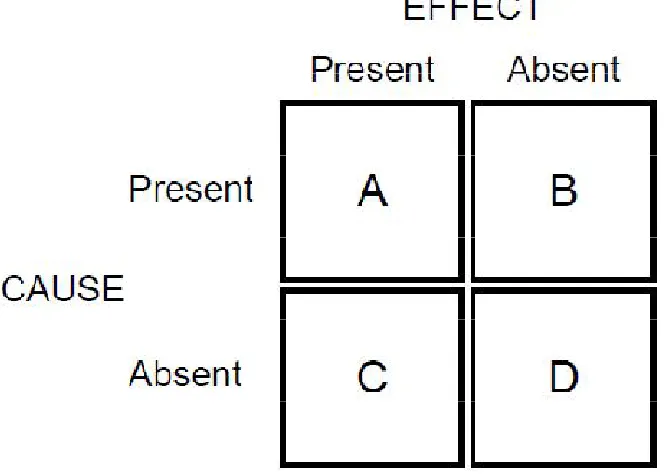
of which were presented randomly. Figure 1 presents a contingency table of the four possible observations. Cells A and D in the figure represent conjunctive (joint-presence or joint-absence of cause and effect variables) observations and Cells B and C represent disjunctive (presence of one variable and absence of the other) observations.
The ratio of conjunctive to disjunctive observations in the intervention task sample was used for categorization. Specifically, ratios favoring conjunctive observations were labeled generative, ratios favoring disjunctive were labeled inhibitory, and ratios that contained equal amounts of conjunctive and disjunctive observations were labeled not related. The experiment sampled observations from a positively correlated population for half of the trials and an uncorrelated population for the other half (the order of which was randomized).
Figure 1. A contingency table. The cell labels A (co-occurrence of causal candidate and effect), B (occurrence of causal candidate and non-occurrence of effect), C (non-occurrence of causal candidate and occurrence of effect), and D (co-non-occurrence of causal candidate and effect) represent the number of observations in the sample or population it describes that fit each cell of the contingency table.
1.3.1.2 Participants
A convenience sample of 20 U.S. Army Soldiers participated in the study. The mean age was 26.35 years and the mean education level was 15.8 years (e.g., 12 years = high school diploma). Participants with advanced degrees or a bachelor’s degree in statistics as well as those who scored above the 95th percentile on a measure of cognitive ability were excluded from participation given that it is possible that those with above average experience or knowledge of statistics or superior intelligence may perform differently than those without additional experience or of average intelligence (Doherty, Anderson, Kelley, & Albert, 2009; Stanovich, 1999).
1.3.1.3 Procedure
Participants completed a demographics questionnaire at the onset of the session. The length of the test sessions ranged from 20 minutes to 45 minutes. All tasks were completed using the experiment generator software, E-Prime 2.0.
At the start of each trial, participants were presented with a cover story describing the variables in question. The instructions stated:
“First, you will look at a small sample of data drawn from test results conducted by another researcher. You will be asked to assess the relationship between the [causal candidate] and [effect variable]. Next, you will be able to generate your own data and to test the [causal candidate]. You will be asked to assess this data. Finally, you will be asked to evaluate the overall effectiveness of the [causal candidate].”
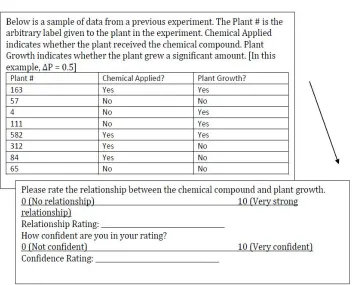
Participants were then asked to provide a rating of their “observation task confidence” by reporting their level of confidence in the rating they provided on a scale from 0 (not confident) to 10 (very confident). The observation task is summarized in Figure 2.
Figure 2. The observation task consisted of a screen of instructions, a screen with the summary table of observations, and a screen where participants
provided judgment and confidence ratings
At the end of the observation and intervention tasks, participants were asked to incorporate all of the information presented and make a final “overall recommendation response” consisting of a forced-choice binary judgment: (e.g., “Given all the information you have seen and generated, do you recommend Chemical A as an effective plant fertilizer? 1. Yes 2. No”). Each trial consisted of an observation task, followed by an intervention task, and the “overall recommendation response.” Participants completed a total of 16 trials. Participants were not allowed to write anything down during the experiment, did not have access to observation task data during the intervention task, and did not have access to observation or intervention task data when prompted to give a final recommendation.
1.3.1.4 Manipulation check and statistical analyses
Paired samples t-tests comparing participants’ “observation task relationship” and “observation task confidence” ratings in each condition were used to confirm differences in participants’ perceptions of the types of samples they observed. Repeated measures analyses of variance (ANOVAs) with subsequent t-tests were used to confirm differences in “intervention task relationship” and “intervention task confidence” ratings. As both sets of ratings helped to confirm perceptual differences in the relationships that participants observed, they also served as checks on the manipulations that we employed. Additionally, the JZS-Bayes Factor was calculated to supplement the traditional hypothesis testing and estimate preference, with respect to likelihood, for the null or alternative hypothesis (Rouder, Speckman, Sun, Morey, & Iverson, 2009).Binary logistic regressions were used to evaluate overall recommendation responses. Model fit was evaluated using the Nagelkerke’s R2 index and Hosmer-Lemeshow goodness-of-fit test statistic. From these, we were able to analyze the respective influences of the data collected through both observation and intervention tasks.
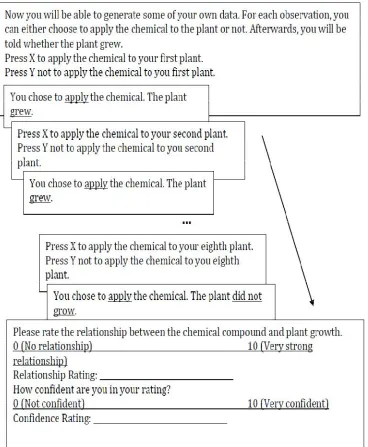
Figure 3: The intervention task consisted of eight separate screens where participants were asked to decide whether to present the causal candidate each
1.3.2 Results
1.3.2.1 Manipulation check: Observation task
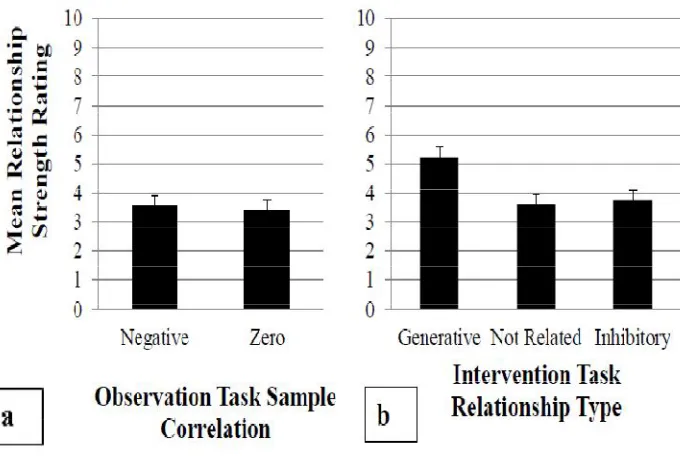
The perceived strength of sample relationships in the observation task was assessed using a paired samples t-test comparing “observation task relationship ratings” for each level of the independent variable “observation task sample correlation” (ΔP = 0.0 or ΔP = 0.5). The analysis revealed a significant difference such that positively correlated samples were rated as higher than uncorrelated
samples, t(19) = -7.12, p < 0.001, JZS-BF = 4.31 X 10⁻⁵ (figure 4a). ”Observation task
confidence ratings” were consistent across relationship types, t(19) = -0.68, p = 0.505, JZS-BF = 4.71.
1.3.2.2 Manipulation check: Intervention task
A repeated measures ANOVA was run (one participant was excluded for incomplete data) setting the intervention task generated sample type (generative, inhibitory, or
not related) as the independent variable and “intervention task relationship rating” as
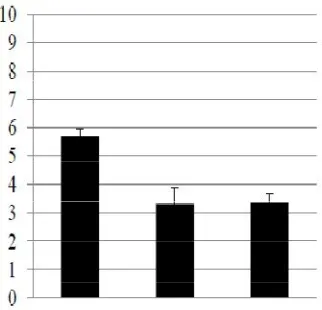
the dependent measure. The results show that participants rated samples differently relative to intervention task generated sample type, F(2, 36) = 26.15, MSE = 34.602, p < 0.001. Ratings of generative intervention task samples were greater than those for
inhibitory (t(18) = 8.36, p < 0.001, JZS-BF = 6.98 X 10⁻⁶) and not related (t(18) = 5.14, p
< 0.001, JZS-BF = 0.002) intervention task samples (figure 4b). “Intervention task confidence” ratings were consistent across relationship types, F(2, 38) = 0.456, MSE
= 0.573, p = 0.637. Across all participants and trials, 320 samples were generated, 128
of which the participant chose to not vary their behavior (always presented the causal candidate).
1.3.2.3 Binary logistic regression
A binary logistic regression model was tested to evaluate the predictive value of the observation and intervention task relationship ratings (judgments of relationship between variables) on “overall recommendation responses.” The dependent variable was coded as “0” (do not recommend as effective “treatment”) or “1” (do recommend as effective “treatment”). An omnibus test of the model suggests that the inclusion of the variables we selected improved the predictive capacity of the
model (χ2 (2) = 134.917, p < 0.001). The model explains 46.0 percent of the variance
in the data (Nagelkerke’s R2 = 0.460). The Hosmer and Lemeshow (H-L) test for
goodness of fit yielded a χ2 (8) = 11.424 which was not significant (p = 0.179) thus
1.3.2.4 Effect of Cover Story
1.3.3 Discussion
Participants were presented with positively correlated and uncorrelated samples in the observation task and the results of the judgments given in the observation task suggest that these samples differentially influenced individuals’ ratings such that participants rated the relationship as greater for correlated samples than uncorrelated. This finding suggests that participants could successfully detect a generative relationship between the cause and effect from statistically related samples.
However, in the intervention task, participants’ capacities to accurately detect inhibitory relationships were called into question. This is because, while participants were able to detect generative relationships, they were unable to distinguish between
inhibitory samples and not related samples when assessing the strength of the
relationships they encountered. This is surprising, because the strength of the data supporting inhibitory relationships in the intervention tasks was consistent with the data supporting the generative relationships and because judgments about the relationship between the cause and effect variables in both tasks influenced the overall recommendation ratings that participants provided.
Just under half of the samples generated did not vary the presence/absence of the causal candidate. In these cases, normative models are unable to infer a relationship (see Griffiths &Tenenbaum, 2005), however, the participants were successful at inferring a generative relationship but not an inhibitory relationship.
1.4 Experiment 2
1.4.1 Method
1.4.1.1 Design
Thus the only difference in the design between experiment 2 and experiment 1 was that the observation task sample correlation levels participants encountered were
negative and zero (refers to the correlation value of the sample observed by participants
in the observation task).
1.4.1.2 Participants
A convenience sample of 20 U.S. Army Soldiers participated in the study. The mean age was 24.35 years and the mean education level was 15.85 years (e.g., 12 years = high school diploma). The same exclusion criteria were adopted as that for experiment 1. Additionally, participants in experiment 1 were excluded to eliminate the possibility of any carry-over effects.
1.4.1.3 Procedure
The procedure was the same as that for experiment 1.
1.4.1.4 Manipulation check and statistical analyses
Analyses are the same as that for experiment 1.
1.4.2 Results
1.4.2.1 Manipulation check: Observation task
As in experiment 1, the perception of sample relationships in the observation task was assessed using a paired samples t-test comparing “observation task
relationship ratings” for each level of the independent variable (ΔP = 0.0 or ΔP =
1.4.2.2 Manipulation Check: Intervention Task
Again, similar to experiment 1, we also ran a repeated measures ANOVA using the
intervention task generated sample type (generative, inhibitory, or not related) as the independent
variable and “intervention task relationship rating” as the dependent measure. The results show that participants rated samples differently relative to intervention task
generated sample type, F(2, 38) = 7.88, MSE = 1.98, p = .001. Ratings of generative
intervention task samples were greater than those for inhibitory (t(19) = 3.23, p = 0.004, JZS-BF = 0.11) and not related (t(19) = 3.54, p = 0.002, JZS-BF = 0.06) intervention task samples (figure 3b). This finding is consistent with the results of the intervention task in experiment 1 and observation task in experiment 2 such that individuals did not report the strength of the relationship of an inhibitory sample as different from that of an unrelated sample.
However, participants who encountered a generative sample reported a relationship that was stronger than the relationships reported by participants who encountered inhibitory (t(19) = 3.23, p = 0.004) or not related samples (t(19) = 3.54, p = 0.002). As in the observation task, “intervention task confidence” ratings were consistent across relationship types, F(2, 36) = 2.264, MSE = 0.235, p = 0.119. Across all participants and trials, 320 samples were generated, 149 of which the participant chose to not vary their behavior (always presented the causal candidate).
1.4.2.3 Binary Logistic Regression
Binary logistic regression models were tested to evaluate the predictive value of the observation and intervention task perceptions on final causal judgments. The dependent variable was coded as “0” (do not recommend as effective “treatment”) or “1” (“do recommend as effective “treatment”). An overall test of the model suggests
that the inclusion of the variables improves prediction (χ2 (2) = 50.324, p < 0.001).
The model explains 20.7 percent of the variance in the data (Nagelkerke’sR2 = 0.207).
The H-L test for goodness of fit yielded a χ2 (8) = 10.206 which was not significant (p
= 0.251) thus suggesting that the model fit well to the data. Due primarily to the fact that generative samples were only present in the intervention tasks, only intervention
task relationship ratings provided significant predictors (p < 0.001).
1.4.2.4 Effect of Cover Story
The potential effect of scenario/cover story (levels of which were chemical/plant growth, food/allergic reaction, experimental drug/pain relief, and diet plan/weight loss) on “observation task relationship ratings” was assessed using a repeated measures ANOVA. The analysis revealed a significant effect, F(3, 57) = 5.80,
p = 0.002, such that participants rated samples in the experimental drug/pain relief
The analysis of the observation and intervention task ratings were re-run without the experimental drug/pain relief scenario data and replicated the results of the full dataset analyses: “observation task relationship ratings” analysis result was nonsignificant, t(19) = -613, p = 0.55; “intervention task relationship rating” analysis result was significant, F(2, 38) = 10.17, MSE = 2.04, p < .001, such that ratings of
generative intervention task samples were greater than those for inhibitory (t(19) = 4.35, p
< 0.001) and not related (t(19) = 3.81, p = 0.001).
1.4.3 Discussion
The results we obtained through experiment 2 supported the observations we initially formed about inhibitory samples through our observations reported with experiment 1. Specifically, in the observation and intervention tasks of experiment 2, when participants encountered inhibitory samples, they were unable to discern a difference in relationship strength compared to when participants encountered unrelated samples. In contrast (and consistent with experiment 1), individuals in experiment 2 who encountered generative samples in the intervention task rated the relationship they encountered as stronger than individuals who encountered inhibitory or indeterminate samples.
1.5 Experiment 3
1.5.1 Method
Given that past work has demonstrated an advantage for learning causality with intervention tasks in more complex scenarios (e.g., competing causal candidates; Lagnado&Sloman, 2004) and that the results of experiments 1 and 2 differ with respect to the predictive value of the observation versus intervention ratings on final judgments, the objective of this additional experiment was to determine whether participants respond differently to the same information provided by intervention or observation tasks with respect to determining causal strength.
1.5.1.1 Design.A between-subjects design was employed for this two-phase experiment. In phase 1, participants completed an intervention task (one per cover story resulting in 4 total). In phase 2, the samples generated in phase 1 were presented to participants in phase 2 in an observation task.
1.5.1.2 Participants.Forty participants completed each phase resulting in a total of 80 participants. Three participants’ incomplete data were excluded from analyses. Participants were recruited using Amazon’s mTurk and completed the experiment online.
1.5.1.4 Statistical analyses.To evaluate whether perception of causal strength differs between intervention and observation, the differences between the ratings provided by the participant who generated the sample in an intervention task and that provided by the participant who viewed the sample, subsequently, in an observation task were examined. Specifically, the absolute values of the differences between the rating of each sample when generated in an intervention task and that when viewed in an observation task were calculated. The differences were aggregated by generated sample type – generative or inhibitory. Absolute values of differences in confidence ratings were also calculated. Single-sample t-tests were used to determine whether the difference values were inequivalent to zero.
1.5.2 Results and Discussion
As noted above, three participants’ data was incomplete and excluded from analysis yielding a total of 37 difference scores for analysis. For generative samples, the mean difference (M = 3.19, SE = 0.39) between observation and intervention ratings was significantly different from zero, t(36) = 8.21, p < 0.001. Likewise, for inhibitory samples, the mean difference (M = 2.22, SE = 0.37) was significantly different from zero, t(36) = 5.98, p < 0.001. Mean differences in confidence ratings for both generative (M = 6.65, SE = 0.34) and inhibitory (M = 7.80, SE = 0.27) samples significantly differed from zero; generative, t(36) = 19.43, p < 0.001, inhibitory, t(36) = 29.01, p < 0.001.
These results suggest that participants rated the samples differently when generated in an intervention task versus viewed in an observation task. Participants also indicated differences in their confidence levels between the task types. These results demonstrate that participants’ perception of a sample was influenced by the method of information acquisition.
1.6 General Discussion
Specifically, we find that individuals are more easily able to diagnose generative relationships and have a more difficult time identifying inhibitory relationships in both observation and intervention-based processes. The results of the third experiment also provide evidence of different perceptions of causal strength dependent on the mode of information acquisition (active versus passive).
Our results refine and extend arguments made by Dennis and Ahn (2001) who observed that individuals are unable to distinguish between inhibitory relationships and random (not related) relationships in evaluating data gathered through observation tasks. The objective of the Dennis and Ahn (2001) study was to demonstrate order effects using a single-cue task in causal strength judgments and presented participants with learning and test phases varying the order of generative and inhibitory information. The design of that study differed from our own in that they used a learning sequence manipulating the order of the contingent and non-contingent blocks to evaluate a primacy effect. All of the information presented to participants was through observation whereas in our study, we presented an observation-intervention learning sequence. The results we obtained suggest that these findings hold even as individuals engage in more active, intervention-based data gathering and analysis.
Our findings also imply that individuals may maintain a bias for generative relationships. The argument here is that individuals who are engaged in detecting covariation and causal relationships may anticipate that any relationship they encounter will be generative. Thus, when they do not observe a generative relationship, they simply make the errant assumption that no relationship exists. While, many theories in the literature have been tested with a concentration on generative relationships (see Shanks, 2004 for a review), these findings suggest that research predicting relationship strength should confirm judgments made from inhibitory relationships as well.
While some prior research presents evidence of primacy effects (e.g., Yates & Curley, 1986), and recency effects (e.g., Lopez, Shanks, Almarez, & Fernandez, 1998), our work is more consistent with the work of scholars who have failed to find evidence of primary or recency effects in causal detection processes (e.g., Wasserman et al., 1996). Specifically, participants’ abilities to identify inhibitory relationships appeared compromised in both experiments and this lack of ability was unaffected by prior exposure to generative relationships (i.e., in experiment 1). In addition, participants who concluded at the end of their observation tasks that the relationships they observed were weak or non-existent (i.e., in experiments 1 or 2), were equally likely to report strong, generative relationships in their responses given in the intervention task.
1.6.1 Study Limitations and Future Research
Given the nature of the intervention task, we did not attempt to control the samples generated by participants. While some scholars may view this as a study limitation, we contend that the data set generated by participants here provides valuable insights into what information they view as important and informative. In this set of experiments, participants more often chose to “apply” the causal candidate in the intervention task. This could suggest that individuals are more interested in gaining information about what happens in the presence of a causal candidate than they are about gathering information about what happens in its absence. To further evaluate this, it would be interesting to employ a procedure that requires participants to derive or generate intervention task samples by restricting their capacity to apply a causal candidate. Observing the conclusions that individuals draw from these samples could highlight important issues for scholars relevant to the types of information people find most valuable in this process. This question is beyond the scope of the present study, however.
Future research should also examine the sequence of intervention followed by observation. While this is a less commonly experienced education and training regimen, it could provide insights into how individuals reconcile data that they gather passively with data they have previously generated. The two ratings of the same sample presented in an observation and intervention format would then be compared to evaluate whether the same conclusions and inferences could be derived.
1.7 Conclusions
In conclusion, the set of experiments we present evaluated the influence of relationship type on causal judgments following a sequence of observation and intervention. The findings suggest that individuals are able to accurately assess generative relationships but are not able to accurately assess inhibitory relationships. Many theories in the literature have been tested with a concentration on generative relationships and these findings suggest that theories of causal judgment need to account for the differential processes individuals engage in when encountering inhibitory relationships.
Acknowledgments
The views expressed in this article are those of the authors and do not reflect the official policy or position of the Department of the Army, the Department of Defense, the U.S. government, or the institution affiliated with the authors.
References
Anderson, J. R., &Sheu, C. F. (1995). Causal inferences as perceptual judgments. Memory & Cognition, 23, 510-524.
Baker, A.G., Murphy, R.A., &Vallee-Tourangeau, F. (1996). Associative and normative accounts of causal induction: Reacting to verses understanding a cause. In D.R. Shanks, K.J. Holyoak, & D.L. Medin (Eds.), The psychology of learning and motivation: Vol. 34. Causal learning (pp.1-46). London: Academic.
Busemeyer, J.R. (1990). Intuitive statistical estimation. In N.H. Anderson (Ed.), Contributions to Information Integration Theory (pp. 187-215). Hillsdale, N.J.: Lawrence Erlbaum Associates, Inc.
Chapman, L.J. (1967). Illusory correlation in observational report. Journal of Verbal Learning and Verbal Behavior, 6, 151-155.
Crocker, J. (1981). Judgment of covariation by social perceivers. Psychological Bulletin, 90, 272-292.
Dennis, M.J., &Ahn, W.K. (2001). Primacy in causal strength judgments: The effect of initial evidence for generative versus inhibitory relationships. Memory & Cognition, 29, 152-164.
Doherty, M.E., Anderson, R.B., Kelley, A.M., & Albert, J.H. (2009). Probabilistically valid inference of covariation from a single xy observation when univariate characteristics are known. Cognitive Science, 33, 183-205.
Fiedler, K., Freytag, P., &Unkelbach, C. (2011). Great oaks from giant acorns grow: How causal-impact judgments depend on the strength of the cause. European Journal of Social Psychology, 41, 162-172.
Hattori, M., &Oaksford, M. (2007). Adaptive non-interventional heuristics for covariation detection in causal induction: Model comparison and rational analysis. Cognitive Science, 31, 765-814.
Kao, S. F., & Wasserman, E. A., (1993). Assessment of an information integration account of contingency judgment with examination of subjective cell importance and method of information presentation. Journal of Experimental Psychology: Learning, Memory, & Cognition, 19, 1363-1386.
Kareev, Y. (2005). And Yet the Small-Sample Effect Does Hold: Reply to Juslin and Olsson (2005) and Anderson, Doherty, Berg, and Friedrich (2005). Psychological Review, 112, 280-285.
Lagnado, D.A., &Sloman, S.A. (2004). The advantage of timely intervention. Journal of Experimental Psychology: Learning, Memory, and Cognition, 30, 856-876.
Levin, I. P., Wasserman, E. A., & Kao, S. F. (1993). Multiple methods for examining biased information use in contingency judgments. Organizational Behavior and Human Decision Processes, 55, 228-250.
Lipe, M. G. (1990). A lens model analysis of covariation research. Journal of Behavioral Decision Making, 3, 47-59.
Lopez, F.J., Shanks, D.R., Almaraz, J., & Fernandez, P. (1998). Effects of trial order on contingency judgments: A comparison of associative and probabilistic contrast accounts. Journal of Experimental Psychology: Learning, Memory, & Cognition, 24, 672-694.
McKenzie, C. R. M., &Mikkelsen, L. A. (2007). A Bayesian view of covariation assessment. Cognitive Psychology, 54, 33-61.
Rescorla, R.A., & Wagner, A.R. (1972). A theory of Pavlovian learning: Variations in the effectiveness of reinforcement and non-reinforcement. In A.H. Black & W.F. Prokasy (Eds.), Classical Conditioning II: Current theory and research (pp. 64-99). New York: Appleton-Century-Crofts.
Rouder, J. N., Speckman, P. L., Sun, D., Morey, R. D., & Iverson, G. (2009) Bayesian t tests for accepting and rejecting the null hypothesis. Psychonomic Bulletin & Review, 16(2), 225-237.
Shanks, D.R. (2004). Judging covariation and causation. In D. J. Koehler and N. Harvey (Eds.), Blackwell Handbook of Judgment and Decision Making (pp. 220-239). Oxford, England: Blackwell Publishing.
Steyvers, M., Tenenbaum, J.B., Wagenmakers, E.J., &Blunmd, B. (2003). Inferring causal networks from observations and interventions. Cognitive Science, 27, 453 – 489. Waldmann, M. R., &Hagmayer, Y. (2005). Seeing versus doing: Two modes of accessing
causal knowledge. Journal of Experimental Psychology: Learning, Memory, and Cognition, 31(2), 216-227.
Wasserman, E. A. (1990). Attribution of causality to common and distinctive elements of compound stimuli. Psychological Science, 1, 298-302.
Wasserman, E. A., Dorner, W. W., & Kao, S. F. (1990). Contributions of specific cell information to judgments of interevent contingency. Journal of Experimental Psychology: Learning, Memory, and Cognition, 14, 509-521.
Wasserman, E. A, Kao, S. F., Van Hamme, L. J., Katagiri, M., & Young, M. E. (1996). Causation and association. In Causal Learning, Eds Shank, D. R., Holyoak, K., &Medin, D. L., Academic Press, San Diego, 207-264.