ISSN 0975-928X
Research Article
Estimation of Combining Ability in Black Gram (
Vigna mungo
(L.)Hepper) for Yield and it’s Attributing Traits Using the Diallel Crossing
Method.
K.K. Panigrahi1*, A. Mohanty1, J. Pradhan1, T.R. Das2 and B. Baisakh1.
1Orissa University of Agriculture and Technology (OUAT), Bhubaneswar, Odisha, India. 2
NBPGR, IARI, New Delhi. *E mail [email protected]
(Received:06 Jan 2015; Accepted:05 June 2015:)
Abstract
A diallel set of 8 parents and their 28 F1were studied for ten characters to determine the nature of gene action in parents and hybrid population. The analysis of variance revealed significant differences for general combining ability (GCA) and specific combining ability (SCA) indicating presence of additive as well as non additive gene effects for genetic factors controlling the traits.Though additive and non-additive gene actions governed the expression of quantitative traits, the magnitude of non-additive gene action was higher than that of additive gene action for each quantitative trait. Parental genotypes like B-3-8-8, OBG-17, LBG-17 and Kenojhar Local were superior to others for different yield contributing traits. Among crosses the superior hybrids were LBG-17 × Keonjhar Local, OBG-31 × Keonjhar Local, PU-35 × OBG-31, PU-30 × LBG-17, B-3-8-8 × OBG-17, B-3-8-8 × PU-30, B-3-8-8 × OBG-31, B-3-8-8 × Keonjhar Local, TU-94-2 × LBG-17, OBG-17 × LBG-17.
Key words
Combining ability, GCA, SCA, Vigna mungo.
Introduction
Grain legumes occupy unique position in Indian agriculture. Besides forming a sustainable component of Indian agriculture, they are a major source of vegetable protein to the larger mass of the country that are basically vegetarian in their food habit. Black gram grain contains about 25% protein, 56% carbohydrate, 2% fat, 4% minerals and 0.4% vitamins. Black gram is said to have originated in India where it is most widely grown and highly esteemed grain legume (Chatterjee and Bhattacharya, 1986). It is well known that 50 g. pulses /person /day should be consumed in addition to other sources of protein such as cereals, milk, meat and egg which is a very difficult task to achieve as the production and productivity of pulse crop including black gram is very low. Diallel analysis, as proposed by Griffing (1956), measures the combining ability of parents to be used in hybridization and helps the crop breeder in choosing the desirable parents for hybridization program. Besides this, diallel analysis also guides the breeder in choosing appropriate breeding method by estimating the GCA (general combining ability) and SCA (specific combining ability) variances governing the traits and by determining the components of genetic variance viz. additive and dominance variances assuming epistasis being absent. The present study was undertaken to study the GCA and SCA effects and variances of some black gram parents and crosses, respectively for yield and other quantitative traits. Significant GCA and SCA effects provide information to determine the efficacy of breeding for improvements in given traits and they can be used to identify the lines to be served as parents in a breeding program for
improvement (Kearsey and Pooni, 1996). In addition, this technique enables the breeder to combine desirable genes that are found in two or more genotypes (Dabholkar, 1992). Genetic parameters like narrow sense heritability and degree of dominance for seed yield and other quantitative traits were also estimated in this study.
Materials and method
The field experiment was undertaken at Experimental Block-II section of the department of Plant Breeding and Genetics, OUAT during pre rabi, 2013 to late rabi 2013-14. Geographically, the field experimentation site is located on 20o52’. N latitude, 82o52’.E longitude and at an altitude of 25.9 m above the mean sea level and nearly 64 km west of the Bay of Bengal. It comes under the humid and sub-tropical climate zone of the state. In pre rabi(Sept-Dec.), 2013 eight Black gram genotypes of different origin (7 improved variety + 1 promising local) were utilized as parents to obtain 28 hybrid combinations according to a diallel crossing scheme (all combinations without reciprocals). Seeds of parental genotype were obtained by selfing. Hybrid F1 seeds were obtained by manual pollination. Further in late rabi (Dec-March)
ISSN 0975-928X
were surrounded by a row of non-experimental material. The observations were recorded on ten quantitative traits viz. days to 50% flowering, days to maturity, plant height, number of primary branches/plant, number of cluster/plant, number of pods/plant, number of seeds/plant, pod length, 100 seed weight and yield/plant. Analysis of data for general and specific combining ability was carried out following Griffing (1956) Method II, Model I (fixed effect model). The statistical analysis was carried out using AGRISTAT software.
Result and discussion
Analysis of variance:The analysis of variance revealed that the lines differed among themselves at p=0.01 or 0.05 for all the characters under studied (data not shown). Therefore, analysis of variance suggested presence of wide variability for the respective traits among the parents. The ANOVA revealed that mean squares due to genotypes were significant for all the yield attributing traits under evaluation indicating presence of sufficient amount of variability among the parents and crosses. The mean sum of squares due to general combining ability (GCA) and specific combining ability (SCA) were significant for all the characters under studied. This implies both the additive and non-additive gene actions were playing significant role in the expression of these characters as suggested by Cheraluet al.
(1999), Singh and Singh (2005).
For GCA the parents were significant for all the characters which revealed that additive gene action existed for the all characters under evaluation. Similarly for the crosses specific combing ability was significant for all the characters under studied, confirming high influence of non additive gene action dominating over the additive one, influence of these characters were broadly due to non additive gene action and which in favours manifestation of heterosis in F1 (Chakraborty et al. 2010) and Bhagirathi et al. (2013). . In the present investigation, GCA variance (σ2GCA) was invariably lower than SCA variance (σ2
SCA) for almost all characters.Similar kinds of result were reported by Mansuria and Joshi (1994) and Halkudeet al. (1996) and Kuteet al. (2002). In contrast, SCA variance exhibited appreciably greater contribution to total genetic variance in case of almost all characters except for days to 50% flowering and days to maturity as established earlier by Swindell and Poehlman (1976). From the above component heritability had been worked out. The percentage of heritability in broad sense was highest with number of seeds/pod (95.46%) followed by number of cluster/plant (92.46%) and days to maturity (90.93%). Maximum cases the broad sense heritability was more than 85% for all the characters taken into consideration except for yield/plant. The heritability narrow sense was
highest with number of primary branches/plant (33.70%) followed by yield/plant (Table 1).
Combining ability analysis:The success of any breeding programme largely depends on the choice of the parent used in the hybridization. In addition to it, high mean was also considered as the main criterion for the selection of superior parents for breeding programme. Gilbert (1958) suggested that the parents with good per se performance would result in better hybrids. Further the parents having high GCA effects could be useful since, the GCA effect is due to additive gene action and is fixable (Sprague and Tatum, 1942).
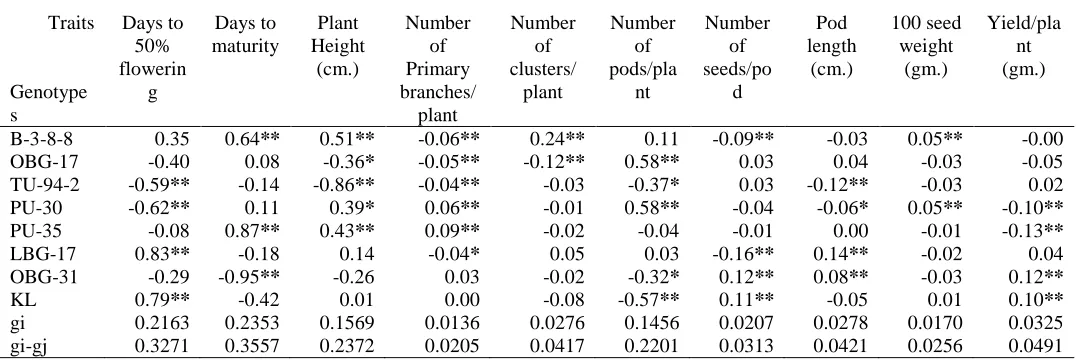
General combining ability: The GCA effects and
per se performance of the parents revealed that none of the parents were found to be a good general combiner for all the characters under studied (Table 2). A wide range of variability of GCA effect was observed among the parents. B-3-8-8 and PU-30 (0.05) had maximum significant positive GCA effect for 100 seed weight whereas OBG-31 (0.12) had maximum significant positive GCA effect followed by Keonjhar Local (0.10) for yield/plant. LBG-17 (0.14) registered significant highest GCAeffects for pod length followed by OBG-31 (0.08). The maximum GCAeffect for number of seed/pods exhibited by OBG-31 (0.12) followed by Keonjhar Local (0.11). PU-30 (0.58) and OBG-17 (0.58) exhibited strong positive GCA effect than other genotypes with respect number of pods/plant. B-3-8-8 (0.24) exhibited significant positiveGCA effects for number of clusters/plant. PU-35 (0.09)exhibited significant positive GCA effects for number of primary branches/plant followed by PU-30 (0.06). B-3-8-8 (0.51) adjudged as the best combiner for plant height with significant positiveGCA effect followed by PU-35 (0.43). OBG-31 (-0.95) followed by Keonjhar Local (-0.42) had the lowest general combining ability effect for days to maturity and for days to 50% flowering PU-30 (-0.62) and TU-94-2 (-0.59) had the lowest general combining ability effect. For these two characters we expect negative GCA for the expression of desirable plant type. Thus, it was observed that the parents PU-30, B-3-8-8, OBG-31 and Keonjhar Local were adjudged as superior based on per se and GCA effects which would therefore result in the identification of superior segregants with favourable genes for seed yield and its component traits.
ISSN 0975-928X
the GCA effects of the parents were very low or even negative (Grakh and Chaudhary, 1985).
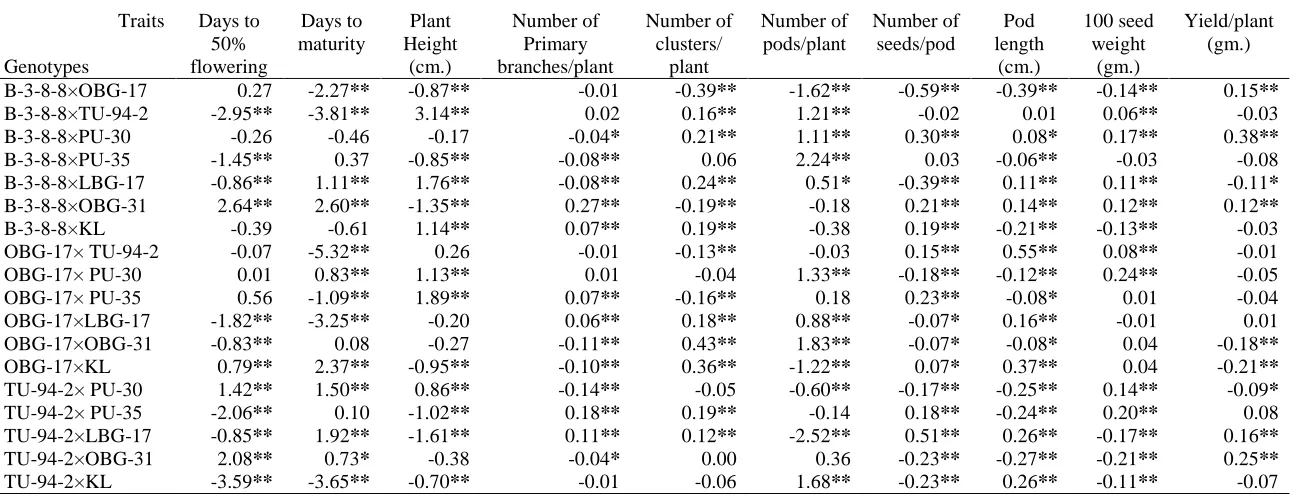
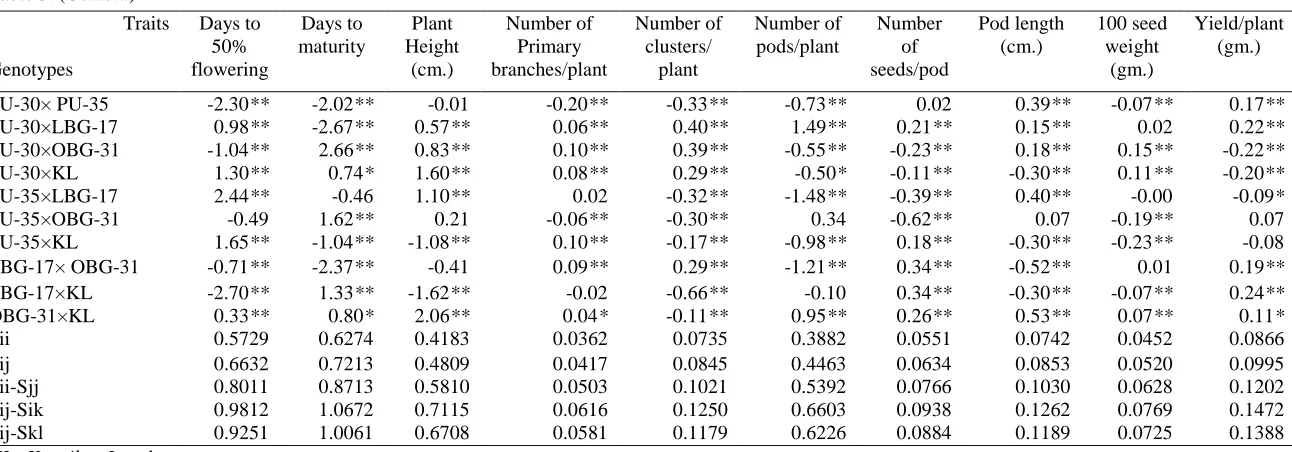
For yield generally the crosses showing significant positive SCA effects also possessed high mean performance and significant negative SCA effects possessed low mean performance. This reflects that high per se value of the crosses indicated their potentiality. Since yield/plant is a complex character and influenced by number of traits so for any breeding programme yield/plant is the most vital character. So the cross combinations having promising SCA effects were desirable for incorporation of high yielding gene to the metric traits. As yield is a polygenic trait the influence of both additive and non additive effects prevails. For yield the range of SCA varied from -0.22 to 0.38. Among the 28 F1 hybrids B-3-8-8 × PU-30 (0.38) had the highest SCA effect followed by TU-94-2 × OBG-31 (0.25) and LBG-17 × Keonjhar Local (0.24). The lowest SCA effect was recorded with the cross PU-30 × OBG-31 (-0.22) followed PU-30 × Keonjhar Local (-0.20). Among 28 cross combinations 13 crosses exhibited positive SCAeffect (10 were significant) for this character whereas 15 crosses exhibited negative SCA effect (7 were significant) (Table 3).
The best specific combiners for early flowering were TU-94-2 × Keonjhar local (-3.59) followed by B-3-8-8 × TU-94-2 (-2.95), LBG-17 × Keonjhar Local (-2.70), PU-30 × PU-35 (-2.30) for days to maturity OBG-17 × TU-94-2 (-5.32) followed by B-3-8-8 × 94-2 (-3.81) and TU-94-2 × Keonjhar Local (-3.65) were adjudged promising since negative SCA favours improvement of these characters. The cross B-3-8-8 × TU-94-2 yielded the promising hybrid with a significant positive SCA of 3.14 followed by OBG-31 × Keonjhar Local (2.06) and OBG-17 × PU-35 (1.89) for plant height. For number of cluster/plant the best specific combiner among the entire 28 F1 hybrid was OBG-17 × OBG-31 (0.43) followed by PU-30 × LBG-17 (0.40) and PU-30 × OBG-31 (0.39). B-3-8-8 × PU-35 (2.24) exhibited significant highest scaeffect for number of pods/plant followed by OBG-17 × OBG-31 (1.83) and TU-94-2 × Keonjhar Local (1.68). More the number of pods more is yield/plant. The SCA effect for number of seeds/pod character ranged between -0.62 to 0.34, crosses PU-35 × OBG-31 (0.34) topped the list followed by LBG-17 × Keonjhar Local (0.34) and B-3-8-8 × PU-30 (0.30) with respect to number of seeds/pod. OBG-17 × TU-94-2 had highest SCAeffect for pod length (0.55) followed by OBG-31 × Keonjhar Local (0.53) and PU-35 × LBG-17 (0.40). The specific combining ability effects revealed that the highest SCA was observed with the hybrid OBG-17 × PU-30 (0.24) followed TU-94-2 × PU-35 (0.20) and B-3-8-8 × PU-30 (0.17) for 100 seed weight. Several crosses possessed high yield with desirable yield
components along with desirable plant stature. Hence these cross combination could favourably be considered for exploiting its vigour through heterosis breeding. However employing hybridization techniques in pulses including black gram is very tedious as the flowers are very small and delicate with cleistogamous nature. It is practically observed that through hand emasculation and pollination technique less than 5 per cent seed set is possible. Hence, heterosis could be favourably exploited only if proper male sterility system is available (Selvam and Elangaimannan 2010).
Good general combining inbred parents have not always showed high SCA effects in theircross combinations. Thus it may be concluded that the information on GCA effects alonemay not be sufficient to predict the extent of hybrid vigour by a particular cross combination (Chakrabortyet al. 2010).Therefore, information on GCA effects of the inbred need to be supplemented with that onSCA effects. In many crosses significant SCA effects for yield per plant were associated with negative SCA effects of days to maturity. This is desirable because we want hybrids having high yield and early in crop duration (Gupta et al.
2006).In general, crosses involving good general combiner as well as one good and the other poor combiner showed high SCA effects, which is due to additive × additive and additive × dominant gene action. Parents PU-30, OBG-31 and Keonjhar Local were identified as the best general combiner due to their good general combining ability effects and also their ability to transmit characters to their progenies for most of the characters. The crosses LBG-17 × Keonjhar Local, OBG-31 × Keonjhar Local, PU-30 × LBG-17, PU-35 × OBG-31, B-3-8-8 × PU-30 and OBG-17 × LBG-17 were identified as the best cross combinations due to their desired SCA effects.
References
Allard, R.W.1956. Biometrical approach to plant breeding. Proc Symp. Genet.Pl.B reed.Broahave.Nat.Lab. 66-68.
Bhagirath, R.; Tikka, S.B.S. and Acharya, S. 2013. Heterosis and combining ability in blackgram (Vigna mungo) under different environments.Indian Journal of Agricultural Sciences, 83(6): 611–616. Chakraborty, S.; Borah, H. K.; Borah, B. K.; Pathak, D.;
Baruah, B. K.; Kalita, H. and Barman, B. 2010. Genetic Parameters and Combining Ability Effects of Parents for Seed Yield and other Quantitative Traits in Black Gram [Vigna mungo (L.)Hepper].Not. Sci. Biol.,2 (2): 121-126.
ISSN 0975-928X
Cheralu, C. A.; Satyanarayana, N.; Kulkarni, K.; Jagdishwar, M.; Reddy, S. S. 1999.Combining ability analysis for resistance to preharvest sprouting in mungbean (VignaradiataL. Wilczek).Indian Journal of Genetics and Plant Breeding,
59(4):465-472.
Dabholkar, A.R. 1992. Elements of Biometrical Genetics.Concept Publishing Company, New Delhi, India.
Gilbert, N.E.1958 .Diallelcross in Plant Breeding.
Heredity, 12:477-492.
Grakh,S.S. and M.S.Chaudhary.1985 .Heterosis for early maturing and high yield in Gossypium arboreum. Indian J.Agric.Sci., 55:10-13. Griffing, B. 1956.Concept of general and specific
combining ability in relation to diallel crossing systems. Aust. J. Biol. Sci.,9(4): 463–493
Gupta, S. K.; Kumar, A. and Banis, T. S. 2006. Line x tester analysis for combining ability in mungbean.Indian J. Pulses Res., 19(1): 31-33.
Halkude, I. S.; Aher, R. P.; Deshmukh, R. B. and Kute, N. S. 1996.Combining ability analysis in greengram.J. Maharastra Agric. Univ., 21: 235-238.
Kearsey, M.J. and Pooni, H.S. 1996. The genetic analysis of quantitative traits.Chapman & Hall, London.
Kute, N. S. and Deshmukh, R. B. 2002.Genetic analysis
in mungbean
(Vignaradiata(L.)Wilczek).Legume Res.,
25(4): 258-261.
Mansuria, C. A. and Joshi, B. C. 1994.Combining ability analysis for polygenic traits in greengram.Gujarat Agric. Univ. Res. J., 19: 78-81.
Selvam Y. A. and Elangaimannan, R. 2010. Combining ability analysis for yield and its component traits in Blackgram (Vigna mungo
(L.)Hepper).Electronic Journal of Plant Breeding, 1(6):1386-1391.
Singh, I. P. and Singh, J. D. 2005. Combining ability in blackgram [Vigna mungo (L.) Hepper].
National Journal of Plant Improvement, 7(1): 24-26.
Sprague, G.F. and Tatum, L.A .1942.General Vs specific combining ability in single crosses of corn. J. American Soc. Agron., 34: 823-832. Swindell, R. F. and Poehlman, J. M. 1976.Heterosis in
mung bean (Vigna radiata).Tropic.Agric.,
ISSN 0975-928X
Table 1.Estimates of variance components and degree of dominance for yield, yield contributing characters in F1 Generation
Days to 50% flowering
Days to maturity
Plant Height
(cm.)
Number of Primary branches/
plant
Number of clusters/
plant
Number of pods/ plant
Number of seeds/
pod
Pod length
(cm.)
100 seed weight
(gm.)
Yield/plant (gm.)
σ2
GCA 0.2902 0.2683 0.1948 0.0030 0.0107 0.1556 0.0087 0.0061 0.0009 0.0070 σ2SCA 2.7351 5.8076 1.4921 0.0097 0.0854 1.2579 0.0857 0.0759 0.0204 0.0208 σ2GCA/
σ2SCA
0.1061 0.0462 0.1305 0.3061 0.1258 0.1237 0.1020 0.0803 0.0416 0.3342
σ2
A 0.5804 0.5366 0.3896 0.0060 0.0214 0.3112 0.0174 0.0122 0.0018 0.0140
σ2D 2.7351 5.8076 1.4921 0.0097 0.0854 1.2579 0.0857 0.0759 0.0204 0.0208 h2bs (%) 85.8626 90.9341 86.7017 88.2022 92.4675 86.3706 95.4629 90.7312 87.0588 74.3589 h2ns (%) 15.0308 7.6913 17.9771 33.7078 18.5281 17.1233 16.1111 12.5643 7.0588 29.9145 σ2A=Additive variance, σ2D= Dominance variance.
Table 2.General combining ability effects of parents for different traits of Blackgram in F1 Generation
Traits
Genotype s
Days to 50% flowerin
g
Days to maturity
Plant Height
(cm.)
Number of Primary branches/
plant
Number of clusters/
plant
Number of pods/pla
nt
Number of seeds/po
d
Pod length
(cm.)
100 seed weight
(gm.)
Yield/pla nt (gm.)
B-3-8-8 0.35 0.64** 0.51** -0.06** 0.24** 0.11 -0.09** -0.03 0.05** -0.00
OBG-17 -0.40 0.08 -0.36* -0.05** -0.12** 0.58** 0.03 0.04 -0.03 -0.05
TU-94-2 -0.59** -0.14 -0.86** -0.04** -0.03 -0.37* 0.03 -0.12** -0.03 0.02
PU-30 -0.62** 0.11 0.39* 0.06** -0.01 0.58** -0.04 -0.06* 0.05** -0.10**
PU-35 -0.08 0.87** 0.43** 0.09** -0.02 -0.04 -0.01 0.00 -0.01 -0.13**
LBG-17 0.83** -0.18 0.14 -0.04* 0.05 0.03 -0.16** 0.14** -0.02 0.04
OBG-31 -0.29 -0.95** -0.26 0.03 -0.02 -0.32* 0.12** 0.08** -0.03 0.12**
KL 0.79** -0.42 0.01 0.00 -0.08 -0.57** 0.11** -0.05 0.01 0.10**
gi 0.2163 0.2353 0.1569 0.0136 0.0276 0.1456 0.0207 0.0278 0.0170 0.0325
gi-gj 0.3271 0.3557 0.2372 0.0205 0.0417 0.2201 0.0313 0.0421 0.0256 0.0491
ISSN 0975-928X
Table 3.Specific combining ability effects of Hybrids for different traits of Blackgram in F1 Generation
Traits
Genotypes
Days to 50% flowering
Days to maturity
Plant Height
(cm.)
Number of Primary branches/plant
Number of clusters/
plant
Number of pods/plant
Number of seeds/pod
Pod length
(cm.)
100 seed weight
(gm.)
Yield/plant (gm.)
B-3-8-8×OBG-17 0.27 -2.27** -0.87** -0.01 -0.39** -1.62** -0.59** -0.39** -0.14** 0.15**
B-3-8-8×TU-94-2 -2.95** -3.81** 3.14** 0.02 0.16** 1.21** -0.02 0.01 0.06** -0.03
B-3-8-8×PU-30 -0.26 -0.46 -0.17 -0.04* 0.21** 1.11** 0.30** 0.08* 0.17** 0.38**
B-3-8-8×PU-35 -1.45** 0.37 -0.85** -0.08** 0.06 2.24** 0.03 -0.06** -0.03 -0.08
B-3-8-8×LBG-17 -0.86** 1.11** 1.76** -0.08** 0.24** 0.51* -0.39** 0.11** 0.11** -0.11*
B-3-8-8×OBG-31 2.64** 2.60** -1.35** 0.27** -0.19** -0.18 0.21** 0.14** 0.12** 0.12**
B-3-8-8×KL -0.39 -0.61 1.14** 0.07** 0.19** -0.38 0.19** -0.21** -0.13** -0.03
OBG-17× TU-94-2 -0.07 -5.32** 0.26 -0.01 -0.13** -0.03 0.15** 0.55** 0.08** -0.01
OBG-17× PU-30 0.01 0.83** 1.13** 0.01 -0.04 1.33** -0.18** -0.12** 0.24** -0.05
OBG-17× PU-35 0.56 -1.09** 1.89** 0.07** -0.16** 0.18 0.23** -0.08* 0.01 -0.04
OBG-17×LBG-17 -1.82** -3.25** -0.20 0.06** 0.18** 0.88** -0.07* 0.16** -0.01 0.01
OBG-17×OBG-31 -0.83** 0.08 -0.27 -0.11** 0.43** 1.83** -0.07* -0.08* 0.04 -0.18**
OBG-17×KL 0.79** 2.37** -0.95** -0.10** 0.36** -1.22** 0.07* 0.37** 0.04 -0.21**
TU-94-2× PU-30 1.42** 1.50** 0.86** -0.14** -0.05 -0.60** -0.17** -0.25** 0.14** -0.09*
TU-94-2× PU-35 -2.06** 0.10 -1.02** 0.18** 0.19** -0.14 0.18** -0.24** 0.20** 0.08
TU-94-2×LBG-17 -0.85** 1.92** -1.61** 0.11** 0.12** -2.52** 0.51** 0.26** -0.17** 0.16**
TU-94-2×OBG-31 2.08** 0.73* -0.38 -0.04* 0.00 0.36 -0.23** -0.27** -0.21** 0.25**
ISSN 0975-928X Table 3. (Contd...)
KL=Keonjhar Local
Traits
Genotypes
Days to 50% flowering
Days to maturity
Plant Height
(cm.)
Number of Primary branches/plant
Number of clusters/
plant
Number of pods/plant
Number of seeds/pod
Pod length (cm.)
100 seed weight
(gm.)
Yield/plant (gm.)
PU-30× PU-35 -2.30** -2.02** -0.01 -0.20** -0.33** -0.73** 0.02 0.39** -0.07** 0.17**
PU-30×LBG-17 0.98** -2.67** 0.57** 0.06** 0.40** 1.49** 0.21** 0.15** 0.02 0.22**
PU-30×OBG-31 -1.04** 2.66** 0.83** 0.10** 0.39** -0.55** -0.23** 0.18** 0.15** -0.22**
PU-30×KL 1.30** 0.74* 1.60** 0.08** 0.29** -0.50* -0.11** -0.30** 0.11** -0.20**
PU-35×LBG-17 2.44** -0.46 1.10** 0.02 -0.32** -1.48** -0.39** 0.40** -0.00 -0.09*
PU-35×OBG-31 -0.49 1.62** 0.21 -0.06** -0.30** 0.34 -0.62** 0.07 -0.19** 0.07
PU-35×KL 1.65** -1.04** -1.08** 0.10** -0.17** -0.98** 0.18** -0.30** -0.23** -0.08
LBG-17× OBG-31 -0.71** -2.37** -0.41 0.09** 0.29** -1.21** 0.34** -0.52** 0.01 0.19**
LBG-17×KL -2.70** 1.33** -1.62** -0.02 -0.66** -0.10 0.34** -0.30** -0.07** 0.24**
OBG-31×KL 0.33** 0.80* 2.06** 0.04* -0.11** 0.95** 0.26** 0.53** 0.07** 0.11*
Sii 0.5729 0.6274 0.4183 0.0362 0.0735 0.3882 0.0551 0.0742 0.0452 0.0866
Sij 0.6632 0.7213 0.4809 0.0417 0.0845 0.4463 0.0634 0.0853 0.0520 0.0995
Sii-Sjj 0.8011 0.8713 0.5810 0.0503 0.1021 0.5392 0.0766 0.1030 0.0628 0.1202
Sij-Sik 0.9812 1.0672 0.7115 0.0616 0.1250 0.6603 0.0938 0.1262 0.0769 0.1472