American Journal of Theoretical and Applied Statistics
2014; 3(2): 31-38Published online March 20, 2014 (http://www.sciencepublishinggroup.com/j/ajtas) doi: 10.11648/j.ajtas.20140302.11
Comparison of parametric and nonparametric item
response techniques in determining differential item
functioning in polytomous scale
T. Oguz Basokcu, Tuncay Ogretmen
Department of Assessment and Evaluation in Education, Ege University, İzmir, Turkey
Email address:
[email protected](T. O. Başokçu), [email protected] (T. Öğretmen)
To cite this article:
T. Oguz Basokcu, Tuncay Ogretmen. Comparison of Parametric and Nonparametric Item Response Techniques in Determining
Differential Item Functioning in Polytomous Scale. American Journal of Theoretical and Applied Statistics. Vol. 3, No. 2, 2014, pp. 31-38. doi: 10.11648/j.ajtas.20140302.11
Abstract
:This study aims to compare parametric and nonparametric methods based on Item Response Theory in determining differential item functioning in polytomous scales. DIF analysis based on parametric IRT was conducted by using parameters comparison method. For nonparametric IRT analysis, DIF is determined by comparison of area indices pertaining to ICC obtained for reference and focal groups. The Comparisons were conducted on data sets from TIMSS 2011 8th Class students survey where data set pertaining to responses of students to "Attitudes Toward Mathematics" composing of samplings from Turkey and South Korea and it was determined if it incorporated DIF according to country and sex differences. It is observed that parametric and nonparametric methods produce generally similar results for DIF analysis in terms of countries. Nevertheless, DIF analysis results for country based sex groups differed according to techniques based on parametric and nonparametric IRT. Results of the study showed that items incorporating DIF differed as to preferred technique. This indicated importance of choosing the best technique in studies to detect whether scale items incorporates DIF or not.Keywords:
Differential Item Functioning,Item Response Theory, Nonparametric Differential Item Functioning, Nonparametric IRT1. Introduction
Differential Item functioning (DIF), can be defined as differentiation in probability of giving correct response for individuals with the same skills levels but coming from different subgroups (Carter & Zickar, 2011; Cohen, Kim, & Baker, 1993; Finch, 2005; Holland, Wainer, & Service, 1993; Rudner, Getson, & Knight, 1980; Shepard, Camilli, & Williams, 1985; Wang, Tay, & Drasgow, 2013) Differentiation in probabilities may be due to item bias or differences in individual knowledge, skills and traits. In determination of test-item bias Differential item functioning (DIF) analysis is widely used technique. From this point of view, differentiation of parameters of an item for individuals in different sub-populations and in the same skill levels shall indicate existence of DIF. Test items' exhibiting DIF means scale scores obtained from those groups contain systematic error and this issue show up as validity problem of measurement tool in the process of test
development. Therefore DIF analysis are an important part of scale development process.
32 T. OguzBasokcu and TuncayOgretmen: Comparison of Parametric and Nonparametric Item Response Techniques in Determining Differential Item Functioning in Polytomous Scale
the criteria, deciding on which technique to be used, is the scale levels of measurement to be analyzed. On account of preponderance of ordinal scale for personality, attitude, achievement or skills measurements in education and psychology, majority of researchers propounded nonparametric methods in DIF analysis for the measuring the same traits. (Glickman et al., 2009 2008; Ramsay, 2000; Sijtsma & Molenaar, 2002
A review of papers studying to determine DIF in test and items shows that IRT based studies have come into prominence in recent years. Besides it is also obser
researchers widely used multidimensional IRT and nonparametric IRT techniques according to structure of scale and characteristics of measurement results.
1997; Nozawa, 2008; Ramsay, 1991). Those researchers suggested nonparametric DIF rather than parametric IRT techniques due to the fact that scale leve
ordinal in multi-categorically graded or bi
graded scales. Nonparametric item response theory, used in detecting DIF, is explained below.
1.1. Nonparametric IRT
Nonparametric IRT, within the framework of Item Response Theory, focuses on measurements in the level of classification. In parametric IRT models, skills are assumed to have distributions according to normal or logistic distributions and skills scale are constructed over that distribution. In fact this indicates
determine precisely skill distribution characteristics and shape of skills distributions cannot be predicted. On the other hand, in nonparametric IRT model, skill scale is determined first and then Item Characteristic Curve (ICC) is calculated according to this distribution. In this sense, Nonparametric IRT is less restricted form of traditional IRT. (Nozawa, 2008). Therefore in determining item characteristic curve assumptions of parametric model were not maintained. Instead, nonparametric regression methods such as kernel smoothing, spline regression
smoothing are used in estimation of item response functioning.
1.2. Kernel Smoothing and Nonparametric Regression
Kernel smoothing approach, suggested by Ramsay(1991), is most widely used nonparametric item characteristics estimation method (ICC) in the literature.
correct answering probability of item i is esti follows:
In the equation, N denotes number of respondents,
j denotes skill of respondent, and
T. OguzBasokcu and TuncayOgretmen: Comparison of Parametric and Nonparametric Item Response Techniques in Determining Differential Item Functioning in Polytomous Scale
the criteria, deciding on which technique to be used, is the levels of measurement to be analyzed. On account of preponderance of ordinal scale for personality, attitude, achievement or skills measurements in education and psychology, majority of researchers propounded nonparametric methods in DIF analysis for the tools Glickman et al., 2009; Nozawa, Sijtsma & Molenaar, 2002).
A review of papers studying to determine DIF in test and items shows that IRT based studies have come into prominence in recent years. Besides it is also observed that researchers widely used multidimensional IRT and nonparametric IRT techniques according to structure of scale and characteristics of measurement results. (Douglas, . Those researchers suggested nonparametric DIF rather than parametric IRT techniques due to the fact that scale levels are nominal and categorically graded or bi-categorical (1, 0) graded scales. Nonparametric item response theory, used in
Nonparametric IRT, within the framework of Item heory, focuses on measurements in the level of classification. In parametric IRT models, skills are assumed to have distributions according to normal or logistic distributions and skills scale are constructed over that distribution. In fact this indicates that assumptions determine precisely skill distribution characteristics and shape of skills distributions cannot be predicted. On the other hand, in nonparametric IRT model, skill scale is determined first and then Item Characteristic Curve (ICC) is ated according to this distribution. In this sense, Nonparametric IRT is less restricted form of traditional IRT. . Therefore in determining item characteristic curve assumptions of parametric model were not maintained. Instead, nonparametric regression methods such as kernel smoothing, spline regression or spline smoothing are used in estimation of item response
ng and Nonparametric Regression
Kernel smoothing approach, suggested by Ramsay(1991), is most widely used nonparametric item characteristics ) in the literature. In this method, correct answering probability of item i is estimated as
denotes number of respondents, and
denotes binary
response of respondent j to item parameters. (Ramsay, 1991)
nonnegative symmetrical function and decreases after reaching maximum value 0 (
h controls the balance between random and systematic error. (Nozawa, 2008; Ramsay, 2000
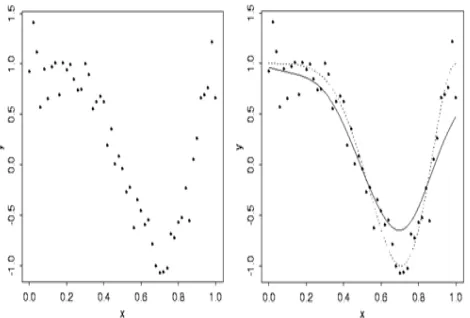
Figure 1. An example for item characteristic curve estimated using Kernel Smoothing.
An example for ICC determination by nonparametric regression method and Kernel smoothing is provided in Figure 1. For the first graphics in the figure, functional relation between independent variable x and dependent variable y is estimated. In the second graphics, function curve f(x) shown by doted curve is
Dark curve is estimated by Gaussian Kernel smoothing (Ramsay, 2000). In the second graphics in Figure 1, difference between normal regression curve and the curve after kernel smoothing is clearly seen.
Kernel approach has some advantages over other nonparametric methods. Foremost advantage is the ease of calculation. In calculation of ICC, when weighting mean values approach for observed grades was preferred, there is no agreement on the required convergence in estimation procedure. Kernel method eliminates this uncertainty (Ramsay, 1991; Wand & Jones, 1994
smoothing approach can be used with both data obtained from multi-categorical and nominal scale,. Most important and third advantage is that Kernel smoothing approach, when skill estimation was in or
(Douglas, 1997). Douglas noted that when there are sufficient number of items and resp
assumptions of parametric model were not met, Kernel smoothing approach gives better results than parametric IRT.
Multi-categorical nonparametric IRT, is adaptation of analysis of bi-categorical items to multi
(Sijtsma & Molenaar, 2002). In this process, Item response Function (IRF) is determined separately for each option of each item. Figures 2 shows separate curves were plotted for an item's each option.
T. OguzBasokcu and TuncayOgretmen: Comparison of Parametric and Nonparametric Item Response Techniques in
to item i and h is bandwidth A typical kernel function is a onnegative symmetrical function and decreases after = θ). Bandwidth parameter
controls the balance between random and systematic error. Ramsay, 2000).
An example for item characteristic curve estimated using Kernel
An example for ICC determination by nonparametric ession method and Kernel smoothing is provided in Figure 1. For the first graphics in the figure, functional relation between independent variable x and dependent variable y is estimated. In the second graphics, function curve f(x) shown by doted curve is produced from data. Dark curve is estimated by Gaussian Kernel smoothing . In the second graphics in Figure 1, difference between normal regression curve and the curve after kernel smoothing is clearly seen.
Kernel approach has some advantages over other nonparametric methods. Foremost advantage is the ease of calculation of ICC, when weighting mean values approach for observed grades was preferred, there is no agreement on the required convergence in estimation procedure. Kernel method eliminates this uncertainty Wand & Jones, 1994). Besides, Kernel smoothing approach can be used with both data obtained categorical and nominal scale,. Most important and third advantage is that Kernel smoothing approach, when skill estimation was in ordinal level, fit consistently. . Douglas noted that when there are sufficient number of items and respondents, and if assumptions of parametric model were not met, Kernel smoothing approach gives better results than parametric
American Journal of Theoretical and Applied Statistics 2014;
Figure 2.Category response curves, based on nonparametr belonging to a 4-category item obtained by TestGraf program.
1.3. Determination of Differential Item Nonparametric IRT Models
In nonparametric IRT models DIF is determined
& Hubley, 2003), like many other IRT models, by calculating areas between item characteristic curves. This area is defined as beta (β). This value shows the difference between weighted expected grade curves belonging to reference group and focal group which are in the sa
level. TestGraf program, used in this research, estimates β value according to following formula;
In above formula, and
characteristic curves for each option for focal and reference groups. In case focal group has a disadvantage in average, β index takes negative values (Nozawa, 2008
β value, obtained to determine DIF, is normalized by dividing its standard error. This value fits to normal Z distribution and significance of DIF is determined as significance of Z statistics according to Ramsey.
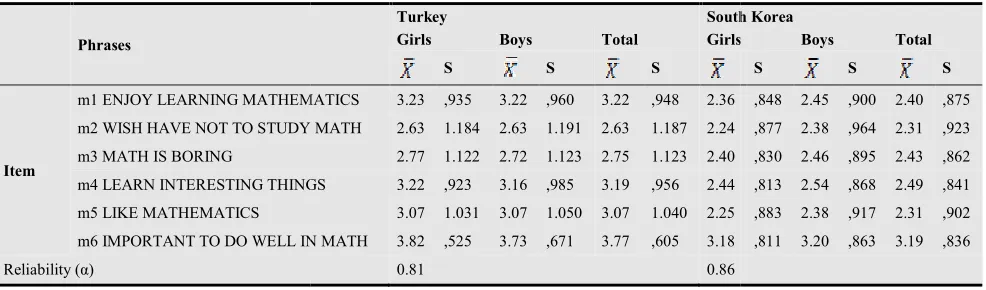
Table 2.Descriptive statistics for DIF comparison groups belonging to TIMSS 2011 8. Class Attitudes toward Mathematics scale
Phrases
Item
m1 ENJOY LEARNING MATHEMATICS
m2 WISH HAVE NOT TO STUDY MATH
m3 MATH IS BORING
m4 LEARN INTERESTING THINGS
m5 LIKE MATHEMATICS
m6 IMPORTANT TO DO WELL IN MATH
Reliability (α)
American Journal of Theoretical and Applied Statistics 2014; 3(2): 31-38
Category response curves, based on nonparametric IRT, category item obtained by TestGraf program.
Determination of Differential Item Functioning in
In nonparametric IRT models DIF is determined (Zumbo , like many other IRT models, by calculating areas between item characteristic curves. This area is defined as beta (β). This value shows the difference between weighted expected grade curves belonging to reference group and focal group which are in the same skills level. TestGraf program, used in this research, estimates β
and show
characteristic curves for each option for focal and reference a disadvantage in average, β
2008).
β value, obtained to determine DIF, is normalized by dividing its standard error. This value fits to normal Z distribution and significance of DIF is determined as significance of Z statistics according to Ramsey.
Nevertheless, Roussos and Stout
determined some cut values for β value by their method developed for SIBTEST software program. They suggested that |β|< .59 and, |β|>.59< .88 and |β|> .88 indicates acceptable, average level and important level DIF respectively.
This study aims to investigate comparatively parametric and nonparametric DIF determination metho
theoretical basis were explained above. To this end, items for Attitudes
TIMSS 2011 student survey were used as real data. It is investigated if items exhibit DIF or not according to sex and countries. In this study, whe
and exhibit differences in parametric and nonparametric IRT methods or not, were determined comparatively.
2.Method
2.1. Study Group
Samples for this study obtained from students responding to TIMSS 2011 survey in Turkey and So
Distribution of samplings studied according to DIF comparison groups is provided in Table 1
Table 1.Distribution of samples according to DIF comparison groups
Countries Sex N
Turkey Girls 3245
Boys 3316
South Korea Girls 2642
Boys 2479
In deciding for reference and focal groups, South Korea taking the first row in TIMSS 2011 survey is taken as reference group to compare with Turkish sampling.
2.2. Measurement Instrument
In this study 6 items belonging to sub
towards Mathematics", for which descriptive statistics were provided in the table below, of TIMSS 2011 8th class student survey. were used as data collection instrument. In Table 2, descriptive statistics
used in this study and work groups belonging to these phrases are shown.
Descriptive statistics for DIF comparison groups belonging to TIMSS 2011 8. Class Attitudes toward Mathematics scale
Turkey South Korea
Girls Boys Total Girls
S S S
m1 ENJOY LEARNING MATHEMATICS 3.23 ,935 3.22 ,960 3.22 ,948 2.36
m2 WISH HAVE NOT TO STUDY MATH 2.63 1.184 2.63 1.191 2.63 1.187 2.24
2.77 1.122 2.72 1.123 2.75 1.123 2.40
m4 LEARN INTERESTING THINGS 3.22 ,923 3.16 ,985 3.19 ,956 2.44
3.07 1.031 3.07 1.050 3.07 1.040 2.25
m6 IMPORTANT TO DO WELL IN MATH 3.82 ,525 3.73 ,671 3.77 ,605 3.18
0.81 0.86
38 33
Nevertheless, Roussos and Stout (Roussos & Stout, 1996) determined some cut values for β value by their method BTEST software program. They suggested that |β|< .59 and, |β|>.59< .88 and |β|> .88 indicates acceptable, average level and important level DIF
This study aims to investigate comparatively parametric and nonparametric DIF determination methods, for which theoretical basis were explained above.
To this end, items for Attitudes toward Mathematics in TIMSS 2011 student survey were used as real data. It is investigated if items exhibit DIF or not according to sex and countries. In this study, whether items incorporating DIF and exhibit differences in parametric and nonparametric IRT methods or not, were determined comparatively.
Samples for this study obtained from students responding to TIMSS 2011 survey in Turkey and South Korea. Distribution of samplings studied according to DIF comparison groups is provided in Table 1
Distribution of samples according to DIF comparison groups
% Total
3245 49.5 6561
316 50.5
2642 51.6 5121
2479 48.4
In deciding for reference and focal groups, South Korea taking the first row in TIMSS 2011 survey is taken as reference group to compare with Turkish sampling.
2.2. Measurement Instrument
his study 6 items belonging to sub-scale "Attitudes towards Mathematics", for which descriptive statistics were provided in the table below, of TIMSS 2011 8th class student survey. were used as data collection instrument. In Table 2, descriptive statistics pertaining to Scale phrases used in this study and work groups belonging to these
Descriptive statistics for DIF comparison groups belonging to TIMSS 2011 8. Class Attitudes toward Mathematics scale
South Korea
Girls Boys Total
S S S
,848 2.45 ,900 2.40 ,875
,877 2.38 ,964 2.31 ,923
,830 2.46 ,895 2.43 ,862
,813 2.54 ,868 2.49 ,841
,883 2.38 ,917 2.31 ,902
34 T. OguzBasokcu and TuncayOgretmen: Comparison of Parametric and Nonparametric Item Response Techniques in Determining Differential Item Functioning in Polytomous Scale
2.3. Data Analysis
DIF analysis by IRT method was conducted using IRTPRO program. This program performed DIF analysis according to Lord’s (F. M. Lord, 1977; F.M. Lord, 1980)parameter comparison technique. Basis of this technique relies on comparison of ICC for focal and reference groups estimated on the basis of item parameters. In other words, this method is based on differences in parameters between groups.
For nonparametric IRT analysis TESTGRAFH program was used. This program detects DIF by comparing indices belonging to ICC obtained on this basis for groups (Ramsay, 2000).
In the study, DIF analysis according to both technique were conducted in three stages.
At the first stage, considering country variables for Turkey and South Korea samplings, DIF analysis were
conducted by parametric and non parametric IRT techniques .
At the second stage, for samples from Turkey and South Korea, DIF analysis according to Sex variable was conducted by parametric IRT techniques.
At the third stage, for samples from Turkey and South Korea, DIF analysis according to Sex variable was conducted by nonparametric IRT techniques.
3. Results and Discussion
In this section of study, results obtained by both methods are presented respectively. Besides, the results are discussed in comparison.
DIF results from IRTPRO program pertaining to Parametric IRT analysis (Turkey - South Korea samplings)
Table 3. DIF analysis results based on parametric IRT for Turkey and South Korea Samplings
South Korea Turkey
Item a b1 b2 b3 a b1 b2 b3 X2c|a d.f. p
1 5.02 -1.02 0.11 1.32 3.71 -1.42 -1 0.01 1550.3 3 0.0001
2 1.83 -1.07 0.31 1.71 1.55 -1.07 -0.04 0.53 1092.7 3 0.0001
3 2.77 -1.2 0.08 1.51 2.23 -1.18 -0.17 0.4 1137.4 3 0.0001
4 3.31 -1.27 -0.03 1.42 1.33 -2.21 -1.35 0.07 1412.4 3 0.0001
5 6.31 -0.84 0.22 1.31 6.17 -1.11 -0.74 0.12 916.8 3 0.0001
6 0.6 -5.09 -2.81 0.66 1.1 -3.84 -3.16 -1.81 1902.5 3 0.0001
Item discrimination and location parameters, estimated using IRTPRO software program for South Korea and Turkey samplings, are given in the table. In last 3 column of Table χ2, degree of freedom, and significance levels pertaining to parameter comparison results belonging to DIF analysis are provided. As shown in Table 3 χ2,results are all significant. In other words, in all items DIF, favoring Turkish sampling, was detected. As an example, in item 4, Turkish students reached " disagree"," agree" and " strongly agree" grades, .at lower skill levels than South Korean students. This situation can be observed even better in Figure 3 below.
In Figure 3, Item characteristic curves for item 4 of test calculated over South Korean and Turkish samplings. The figure shows that θ level, at which South Korean students reached from 0 level (strongly disagree) to level 1 (disagree), is much lower comparing to Turkish sample. Nevertheless examination of the figures shows that Turkish sample reaches from the level "Agree" to "Strongly Agree "at much lower θ level than South Korean sample.
Figure 3.Item Characteristic curves for item 4 from South Korean and Turkish samplings.
American Journal of Theoretical and Applied Statistics 2014; 3(2): 31-38 35
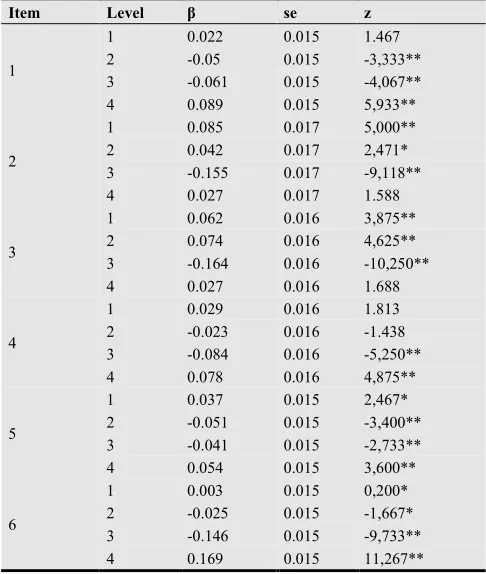
Table 4.DIF analysis results based on nonparametric IRT for Turkish and South Korean Samples
Item Level β se z
1
1 0.022 0.015 1.467
2 -0.05 0.015 -3,333**
3 -0.061 0.015 -4,067**
4 0.089 0.015 5,933**
2
1 0.085 0.017 5,000**
2 0.042 0.017 2,471*
3 -0.155 0.017 -9,118**
4 0.027 0.017 1.588
3
1 0.062 0.016 3,875**
2 0.074 0.016 4,625**
3 -0.164 0.016 -10,250**
4 0.027 0.016 1.688
4
1 0.029 0.016 1.813
2 -0.023 0.016 -1.438
3 -0.084 0.016 -5,250**
4 0.078 0.016 4,875**
5
1 0.037 0.015 2,467*
2 -0.051 0.015 -3,400**
3 -0.041 0.015 -2,733**
4 0.054 0.015 3,600**
6
1 0.003 0.015 0,200*
2 -0.025 0.015 -1,667*
3 -0.146 0.015 -9,733**
4 0.169 0.015 11,267**
* Options include DIF
As it can be seen from the Table, β values and their standard errors are calculated separately for each item and its each level pertaining to DIF and significance of DIF was tested using Z statistic. As an example, examining item 4 shows that in agree and strongly agree levels DIF was found statistically significant. Moreover, signs of z values also indicates at the same time DIF direction. In this case, Item 4 Agree level and Strongly Agree levels are reached in lower θ levels for focal group and references group respectively. Level (option) characteristic curves obtained by Kernel Smoothing for each level for this item were given in Figure 4.
For this item, it is found that students in Turkish sampling easily reached strongly agree level in the lower skill levels than South Korean students.
DIF analysis results according to sex groups from Turkish and South Korean samplings.
DIF analysis results based on parametric IRT in sex groups in Turkey and sex groups in South Korea are given in Table 5 and Table 6 respectively.
Figure2. DIF analysis results based on nonparametric IRT for Turkish and South Korean Samplings Item 4 categories response curves.
Table 5. DIF Analysis results based on parametric IRT for sex groups from Turkish sample.
Girls Boys
Item a b1 b2 b3 a b1 b2 b3 X2c|a d.f. p
1 3.75 -1.44 -1.03 0.02 3.55 -1.46 -1.02 -0.03 5.7 3 0.1284
2 1.83 -1 -0.02 0.49 1.3 -1.2 -0.09 0.56 7.5 3 0.0587
3 2.45 -1.19 -0.17 0.35 2.02 -1.22 -0.18 0.45 6.1 3 0.1045
4 1.18 -2.53 -1.57 0.07 1.47 -2.02 -1.22 0.05 8.8 3 0.032
5 5.56 -1.14 -0.77 0.14 6.98 -1.12 -0.74 0.08 3.5 3 0.3216
36 T. OguzBasokcu and TuncayOgretmen: Comparison of Parametric and Nonparametric Item Response Techniques in Determining Differential Item Functioning in Polytomous Scale
Table 6.DIF Analysis results based on parametric IRT for sex groups from South Korean sample.
Girls Boys
Item a b1 b2 b3 a b1 b2 b3 X2c|a d.f. p
1 4.97 -1.02 0.18 1.45 4.57 -1 0.18 1.48 1.5 3 0.6812
2 1.79 -1.08 0.45 1.97 1.68 -1.03 0.31 1.8 28.6 3 0.0001
3 2.85 -1.23 0.13 1.63 2.44 -1.14 0.18 1.69 13.8 3 0.0032
4 3.18 -1.31 0.07 1.57 3.07 -1.24 0 1.57 10.3 3 0.016
5 6.07 -0.8 0.31 1.42 5.89 -0.84 0.29 1.48 2.9 3 0.4089
6 0.59 -5.51 -2.88 0.8 0.54 -5.12 -2.92 0.71 16.2 3 0.001
In Table 5, χ2 statistics detecting DIF and significance level of this statistics and item parameters estimated by IRTPRO program for groups are provided. Findings indicate that items 4 and 6 in scale incorporate DIF favoring girls in sex groups. In the second stage of analysis, item not exhibiting DIF are taken as connection items and items 4 and 6 were chosen as candidate items exhibiting DIF. Results also showed that items 4 and 6 incorporates DIF favoring girls. The same calculations were repeated for sex groups from South Korean sampling and analysis results are provided in Table 6.
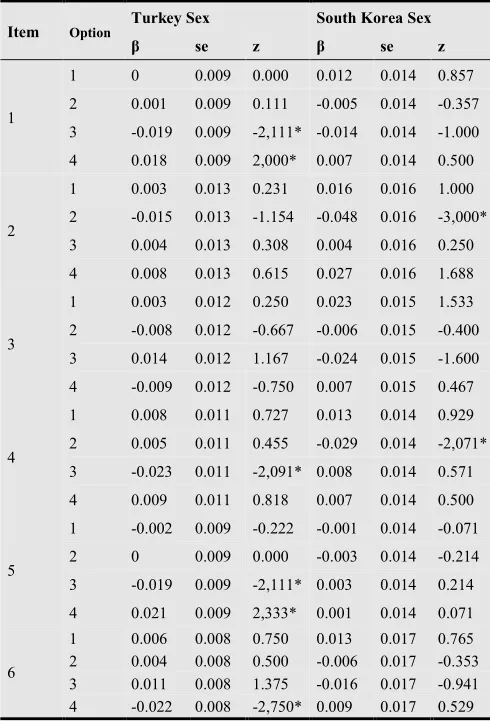
Table 7.DIF analysis results based on nonparametric IRT for sex groups from both Turkish and South Korean Samples
Item Option Turkey Sex South Korea Sex
β se z β se z
1
1 0 0.009 0.000 0.012 0.014 0.857
2 0.001 0.009 0.111 -0.005 0.014 -0.357
3 -0.019 0.009 -2,111* -0.014 0.014 -1.000
4 0.018 0.009 2,000* 0.007 0.014 0.500
2
1 0.003 0.013 0.231 0.016 0.016 1.000
2 -0.015 0.013 -1.154 -0.048 0.016 -3,000*
3 0.004 0.013 0.308 0.004 0.016 0.250
4 0.008 0.013 0.615 0.027 0.016 1.688
3
1 0.003 0.012 0.250 0.023 0.015 1.533
2 -0.008 0.012 -0.667 -0.006 0.015 -0.400
3 0.014 0.012 1.167 -0.024 0.015 -1.600
4 -0.009 0.012 -0.750 0.007 0.015 0.467
4
1 0.008 0.011 0.727 0.013 0.014 0.929
2 0.005 0.011 0.455 -0.029 0.014 -2,071*
3 -0.023 0.011 -2,091* 0.008 0.014 0.571
4 0.009 0.011 0.818 0.007 0.014 0.500
5
1 -0.002 0.009 -0.222 -0.001 0.014 -0.071
2 0 0.009 0.000 -0.003 0.014 -0.214
3 -0.019 0.009 -2,111* 0.003 0.014 0.214
4 0.021 0.009 2,333* 0.001 0.014 0.071
6
1 0.006 0.008 0.750 0.013 0.017 0.765
2 0.004 0.008 0.500 -0.006 0.017 -0.353
3 0.011 0.008 1.375 -0.016 0.017 -0.941
4 -0.022 0.008 -2,750* 0.009 0.017 0.529
* Options include DIF
Examining findings in Table 6, In South Korean sample, demonstrated that items 2, 3, 4 and 6 in scale incorporated DIF for sex groups. As shown in Table, item 2 exhibits DIF favoring boys and items 3,4 and 6 exhibit DIF favoring girls. At the second stage of analysis, item not exhibiting DIF are taken as connection items and items 2,3, 4 and 6 were chosen as candidate items exhibiting DIF and analysis was repeated. Analysis results demonstrated again the same item 4 incorporated DIF favoring the same groups.
DIF analysis results based on nonparametric IRT both in sex groups from Turkey and from South Korea were provided in Table 7.
In Table 7, DIF analysis results based on nonparametric IRT for Turkish sample indicated that items 1,4, 5 and 6 in the scale exhibit DIF according to sex groups. According
to Analysis results, 2 an 4 options for item 1, 3 option for item 4, and 3 and 4 options for item 5 and 4 level for item 6 incorporate DIF for sex groups. Signs of parameters can be used to understand which option for an item exhibits DIF favoring a group. For example, girls reached level 3 for item 1 in lower skills levels whereas boys may reach level 4 in lower skills levels. In South Korean sample, DIF analysis results based on nonparametric IRT indicated DIF in one level for only item 2 and 4.
4. Conclusions
In the scope of this study, parametric and nonparametric DIF determination methods were examined comparatively. To this end, Attitude towards mathematics items in TIMSS 2011 student survey were used as real data and it is determined if items incorporated DIF or not in terms of sex and country variables. It is noted that parametric and nonparametric methods produced generally similar results for DIF analysis in which countries were labeled as reference and focal groups,
American Journal of Theoretical and Applied Statistics 2014; 3(2): 31-38 37
for neither of these items. This indicated different techniques produced different results for DIF analysis. For South Korean sampling, similar results were observed for sex groups.
A review of relevant field studies reveals that measurements regarding structures in education and psychology provided information at the level of ordering scale. (Allen & Yen, 1979; Murphy & Davidshofer, 1998; Torgerson, 1958). Besides, Sijtsma and Molenaar (2002), on account of preponderance of rating scale level for personality, attitude, achievement or skills measurements in education and psychology, propounded nonparametric methods in DIF analysis for the tools measuring the same traits.
Results of the study showed that items incorporating DMF exhibit difference according to preferred technique. This indicated importance of choosing best fit technique in studies investigating whether scale items incorporated DMF or not. In DIF analysis, which is an important stage in developing and validating scales, researchers should consider level of scale for the measurement and whether assumptions of methods were satisfied or not and chose the best technique accordingly.
References
[1] Adams, R. J., & Rowe, K. J. (1988). Item Bias In J. P. Keeves (Ed.), Educational research, methodology, and measurement:An international handbook. (pp. 398-403). Oxford: Pergamon Press.
[2] Adams, R. J., & Rowe, K. J. (1988). Item Bias In J. P. Keeves (Ed.), Educational research, methodology, and measurement:An international handbook. (pp. 398-403). Oxford: Pergamon Press.
[3] Allen, M. J., & Yen, W. M. (1979). Introduction to Measurement Theory: Brooks/Cole Pub.
[4] Carter, N. T., &Zickar, M. J. (2011). A Comparison of the LR and DFIT Frameworks of Differential Functioning Applied to the Generalized Graded Unfolding Model. Applied Psychological Measurement, 35(8), 623-642. doi: 10.1177/0146621611427898
[5] Cohen, A. S., Kim, S.-H., & Baker, F. B. (1993). Detection of Differential Item Functioning in the Graded Response Model. Applied Psychological Measurement, 17(4), 335-350. doi: 10.1177/014662169301700402
[6] Devine, P. J., &Raju, N. S. (1982). Extent of Overlap among Four Item Bias Methods. Educational and Psychological
Measurement, 42(4), 1049-1066. doi:
10.1177/001316448204200412
[7] Douglas, J. (1997). Joint consistency of nonparametric item characteristic curve and ability estimation. Psychometrika, 62(1), 7-28. doi: 10.1007/bf02294778
[8] Finch, H. (2005). The MIMIC Model as a Method for Detecting DIF: Comparison with Mantel-Haenszel, SIBTEST, and the IRT Likelihood Ratio. Applied Psychological Measurement, 29(4), 278-295. doi: 10.1177/0146621605275728
[9] Glickman, M., Seal, P., &Eisen, S. (2009). A non-parametric Bayesian diagnostic for detecting differential item functioning in IRT models. Health Services and Outcomes Research Methodology, 9(3), 145-161. doi: 10.1007/s10742-009-0052-4
[10] Hambleton, R. K., Swaminathan, H., & Rogers, H. J. (1991). Fundamentals of Item Response Theory: SAGE Publications.
[11] Holland, P. W., & Thayer, D. T. (1986). Differential item performance and the Mantel-Haenszel procedure Technical Report (Vol. 86-69). Princeton, NJ: Educational Testing Service.
[12] Holland, P. W., Wainer, H., & Service, E. T. (1993). Differential Item Functioning: Taylor & Francis.
[13] Lord, F. M. (1977). A Broad-Range Tailored Test of Verbal Ability. Applied Psychological Measurement, 1(1), 95-100. doi: 10.1177/014662167700100115
[14] Lord, F. M. (1980). Applications of item response theory to practical testing problems: Erlbaum Associates.
[15] Mellenberg, G. J. (1983). Conditional Item Bias Methods. In S. H. Irvine & W. J. Barry (Eds.), Human Assesment and Cultural Factors (pp. 123-144). Newyork: Plenum Pres.
[16] Murphy, K. R., &Davidshofer, C. O. (1998). Psychological testing: principles and applications: Prentice Hall.
[17] Nozawa, Y. (2008). Comparison of Parametric and Nonparametric IRT Equating Methods Under The Common-Item Nonequıvalent Groups Desing. Doctor of Philosopy, The University of Iowa.
[18] Raju, N. (1988). The area between two item characteristic curves. Psychometrika, 53(4), 495-502. doi: 10.1007/bf02294403
[19] Ramsay, J. O. (1991). Kernel smoothing approaches to nonparametric item characteristic curve estimation. Psychometrika, 56(4), 611-630. doi: 10.1007/bf02294494
[20] Ramsay, J. O. (2000). TestGraf A Program for the Graphical Analysis of Multiple Choice Test and Questionnaire Data Canada, Montreal, Quebec:McGill University
[21] Rodney, G. L., &Drasgow, F. (1990). Evaluation of Two Methods for Estimating Item Response Theory Parameters When Assessing Differential Item Functioning. . Journal of Applied Psychology, 75(2), 164-174.
[22] Roju, N. S., van der Linden, W. J., & Fleer, P. F. (1995). IRT-Based Internal Measures of Differential Functioning of Items and Tests. Applied Psychological Measurement, 19(4), 353-368. doi: 10.1177/014662169501900405
[23] Roussos, L. A., & Stout, W. F. (1996). Simulation Studies of the Effects of Small Sample Size and Studied Item Parameters on SIBTEST and Mantel-Haenszel Type I Error Performance. Journal of Educational Measurement, 33(2), 215-230. doi: 10.1111/j.1745-3984.1996.tb00490.x
[24] Rudner, L. M., Getson, P. R., & Knight, D. L. (1980). Biased Item Detection Techniques. Journal of Educational Statistics, 5(3), 213-233. doi: 10.2307/1164965
38 T. OguzBasokcu and TuncayOgretmen: Comparison of Parametric and Nonparametric Item Response Techniques in Determining Differential Item Functioning in Polytomous Scale
[26] Sijtsma, K., &Molenaar, I. W. (2002). Introduction to Nonparametric Item Response Theory: SAGE Publications.
[27] Torgerson, W. S. (1958). Theory and methods of scaling: Wiley.
[28] Wand, P., & Jones, C. (1994). Kernel Smoothing: Taylor & Francis.
[29] Wang, W., Tay, L., &Drasgow, F. (2013). Detecting Differential Item Functioning of Polytomous Items for an Ideal Point Response Process. Applied Psychological
Measurement, 37(4), 316-335. doi:
10.1177/0146621613476156