Vol.8 (2018) No. 4-2
ISSN: 2088-5334
Artificial Neural Network Classification for Fatigue Feature Extraction
Parameters Based on Road Surface Response
M. F. M.Yunoh
#, S. Abdullah
#, S. S. K. Singh
# #Centre for Integrated Design for Advanced Mechanical Systems (PRISMA), Faculty of Engineering & Built Environment, Universiti Kebangsaan Malaysia, 43600 Bangi, Selangor, Malaysia
E-mail: [email protected]
Abstract— The aim of this paper is for classification for fatigue feature extraction parameters based on road surface response using
the artificial neural network (ANN) technique. It is important for classification of the fatigue damage of automotive suspension as it is considers the random strain loading from the road surface contributed from complex variable amplitude loadings. In this study, the proposed method captured that strain signal collected from the car coil spring during the road test. Hence, the prediction of fatigue life need to assess based on actual loading to ensure the prediction results are accurate. The high amplitude segments were extracted from the strain signals using the discrete wavelet transform. This approach provides an advantage in assessing the signals containing random loads for both discontinuities and smooth components for the areas that contain high fatigue damage in the strain signal. From this, three significant fatigue features extraction parameters such as kurtosis, wavelet energy coefficients and fatigue damage were classified based on the similarities using ANN classification technique. This is important in analysing the clustering and classification were used in detection of fatigue damage according to the response of the various road surface condition. The results show the classifications using ANN give the accuracy based on the coefficient of determinant, R= 0.85 for all data. From on the accuracy of the ANN, it can be concluded that the discrete wavelet transform as a pre-processing method to extract the features from the signal for classification level of fatigue damage for the coil spring according to the response of loading based on road surface.
Keywords: artificial neural network; fatigue damage; features extraction; road surface; wavelet transform.
I. INTRODUCTION
Currently, there are various methods and techniques developed to detect and reduce failure caused by fatigue, cracks and fractures in engineering fields such as within the oil and gas, aerospace and automotive industries [1-3]. The prediction of fatigue life needs to be assessed based on actual loading in order to ensure the prediction results are accurate [4]. Therefore, in the evaluation of fatigue life for automotive components, the loading imposed on the actual road surface should be used as input data. There are different types of road surfaces, which contribute to different responses for automotive components. Therefore, it is necessary considers the road surfaces effects on fatigue damage given the complex Variable Amplitude Loading (VAL) compared to Constant Amplitude loading (VAL).
However, effective methods need to be developed in order to collect and analyse the responses from variable road surfaces. At present, the approach related to signal processing has been widely adopted in the assessment of fatigue life. Based on previous studies, signal-processing methods were carried out in three domains, namely; time,
frequency, and time-frequency domains. Putra et al. [5], classify the strain signal properties from the response of a car suspension system using global statistical analysis. Based on the results, they found that the amplitude of the strain signal affected the value of RMS and Kurtosis. Ananthakrishnan et al. [6], conducted a study on vehicle vibration using Power Spectral Density (PSD) and in another study, Putra et al. [7] extracted the features from the strain signal and predicted the fatigue damage using wavelet transform. Accordingly, wavelet transform can detect the areas that contain high fatigue damage in the strain signal and extract the features. In a separate study, Oh [8], produced the shorten signal by extracting the high amplitude signal using wavelet transform which was then used as an input in an accelerated test.
strain signal are classified using the ANN technique to determine the level of fatigue damage according to the response of the road surface.
II. MATERIAL AND METHOD
A. Parameters for Features Extraction
The features extraction technique is a process of establishing transformation of the original strain signal. In general, there are several approaches used in signal processing to explain or specify the signal information. In this paper, three types of approaches were selected for extracting the features such as Kurtosis, Discrete Wavelet Transform (DWT) coefficient and fatigue damage.
Kurtosis is a parameter that is sensitive with a spike of data and is typically used for measuring the non-gaussianity for fault symptoms detection due to its sensitivity to a spike of data and outlier among the instantaneous values [10]. Kurtosis is defined as follows in Eq. 1:
(
)
44 1 1 ( ) n j j
K x x
n SD −
=
− (1)In signal analysis, the kurtosis value increases in Gaussian distribution due to the high amplitude segment in the signal [11].
The DWT was used in the fatigue data analysis given it can avoid duplication in data. Also, DWT can extract information such as the energy generated by vibration in the signal [8] and can summarise the functions that operate in a different frequency. DWT is defined based on Eq. 2:
W m n x t a m a m t nb dt
) , ( * ) ( ) ,
( 0 0
2 0 − = ∞ − ∞ − −
ψψ (2)
In DWT analysis, the wavelet decomposition process is based on the appropriate order to the application needed to be determined. This order can be considered as a value of a scale that determines the wavelet.
Analysis of fatigue damage in this paper was calculated according to the strain-life analysis based on the Morrow model and the Palmgren-Miner rule. The Morrow model is determined according to the modifications of the basic strain-life curves that contribute to the mean stress effect by changing the elastic part in the strain-life curves [12-13]. The Morrow’s model is defined according to Eq. 3:
f 1 m
(
2)
b(
2)
ca f f f
f N N E σ σ ε ε σ ′ ′ = − + ′ (3)
The total of fatigue damage is determined based on Palmgren-Miner rule according to Eq. 4:
i 1 TOT fi i n D N
=
= (4)B. Artificial Neural Network
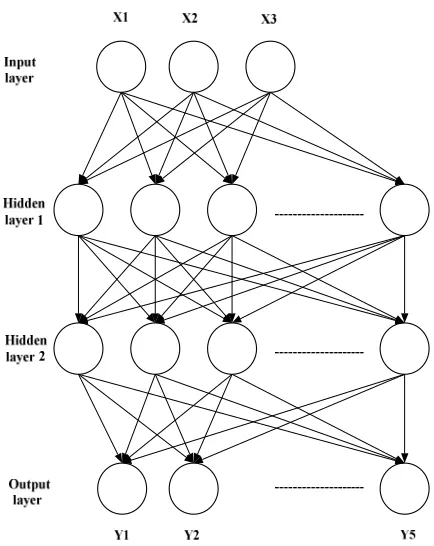
Classification is a machine learning application, which generates the classifier, based on observational examples and supervised learning. ANN is a large class of similar structure, which is useful in the processing of certain categories of complex problems. The Multi-Layered
Perceptron (MLP) provides back-propagation for training was deploed for many classification analyses [14]. ANN has various numbers of neurons that are associated by a weight link that pass the signals starting from one neuron to another. MLP contains layers that include; input, output and hidden layers with some predefined neurons. The neurons in the input layer acts as buffers in transferring the signal x to i
the hidden layers. In this case, each neuron j that is in the hidden layers summarises the input signal x . Next, the i
weightwjiextends the layer from the input and calculates the
outputyj as a number of functions fa as shown in Eq. 5:
yi = fa
(
w xji i)
(5)ANN training includes the adjustment of weight used in other algorithms that can be defined according to Eq. 6:
wji
( )
t+ =1 wji( )
t + ∆wji( )
t+1 (6)C. Methodologies
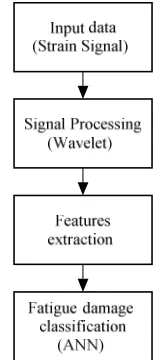
The general process flow of the proposed method is illustrated in Fig. 1. First, the strain signals were collected during the road test. Next, the signal processing approach involving wavelet extraction is performed to extract the high amplitude segments of the strain signal. Then, the features extraction parameters were calculated based on the segments retained. To classify the features, the ANN classification technique is applied.
Fig. 1 Process flow of the proposed approach
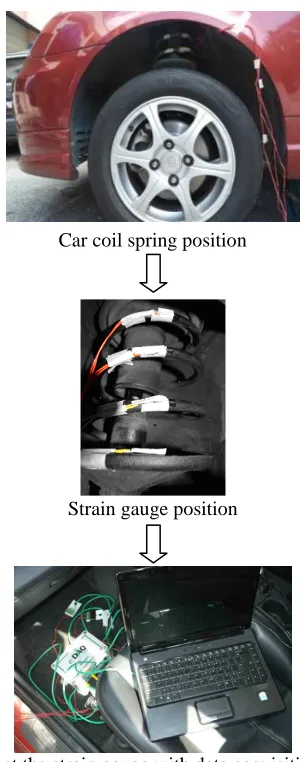
D. Strain Signal Collection
bumps, potholes and cornering. The overall process for the strain signal collection is summarised in Fig. 2.
Car coil spring position
Strain gauge position
Connect the strain gauge with data acquisition and computer
Road profile
Fig. 2 Process for strain signal collection
E. Features Extraction
The appropriate features for classification must be distinctive, collectable and universal. The wavelet transform was applied to recognise high amplitude segment from the strain signal according to the high wavelet energy coefficients. The magnitude of the wavelet energy coefficients in the time-frequency domain was reversed to time histories with the purpose of extracting the position of
the high amplitude segment. The features extraction for all segments were next analysed according to the parameters of kurtosis, DWT energy coefficient and fatigue damage. The features selection commonly relies on the application. Importantly, the kurtosis, DWT energy coefficient and fatigue damage are important parameters in fatigue life assessment. Next, all values were normalised and served as input for the further classification process. In this paper, the focus is towards classifying the fatigue damage into classes. Five significant categories of signals and ranges are tabulated in Table 1.
TABLE 1
TYPES OF SIGNAL AND RANGE OF FATIGUE DAMAGE
Types of Signal Range of Fatigue Damage Class
Minimum Maximum
36 38 40 42 -500 -1000 0 1000 500
1.98 x 10 -7
8.42 x 10 -5
1
42 44 46 -500 -1000 0 1000 500
8.41 x 10 -5
7.25 x 10 -4
2
4 6 8 -1,00 0
-50 0 0 50 0 1,00 0
7.24 x 10 -4
2.92 x 10 -4
3
-1,00 0 -50 0 0 50 0 1,00 0
2.91 x 10 -4
1.65 x 10 -3
4
20 21 22 -1,000
-500 0 500 1,000
1.64 x 10 -3
1.14 x 10 -3
5
F. Artificial Neural Network Classification
Clustering is a process to categorise a group with similar characteristics into the same class and is the main process for pattern recognition and classification. K-means clustering is widely applied, as it is simple and easily implemented in many applications. In this paper, k-means clustering was used, and five classes of fatigue damage were considered.
The primary motivation in this paper is to classify fatigue damage based on the ANN classification approach. ANN is a common classifier as a network of neurons based on a learning algorithm (10) determines the performance. ANN is a non-linear model that contributes to real-time problems. Furthermore, it is constructed gradually with an organised procedure in order to increase the performance criterion due to some internal restrictions known as learning rules.
Fig. 3 Neural network model for classification
III.RESULTS AND DISCUSSION
Fig. 4 displays the extraction process for the identification and extraction of the high amplitude strain signal. The signal shows the plot; x-axis representing time and the y-axis representing the amplitude of strain. Fig. 4 present the time history signal measured on a paved, bumpy and potholed road surface profile. The plot shows a non-stationary behaviour pattern with several high amplitude segments. This pattern occurs once the car hits the paving, bumps, potholes or cornering that leads to the coil spring imposed
with higher loading. The signal from zero to 3 seconds shows that the data were captured at the road consisting of small potholes. During 3 to 7 seconds, the signal was captured at the road surface consisting of paving and a corner. After that, the signal was captured at the rough road surface consisting of large potholes and bumps.
Fig. 5 shows the scalogram of plots from the DWT analysis. As can be seen from the figure, the absolute coefficient value is proportional to the intensity of the colour as it provides a distribution of wavelet energy concerning time and frequency. The scalogram plot indicates that the lower scale at a higher frequency and lower amplitude means that the cycles in the signal have a lower energy coefficient. A large-scale at a low frequency and higher amplitude specify that the cycles had a higher energy coefficient that contributes to fatigue damage. The higher energy coefficients contribute to high damage which leads to component failure.
Fig. 6 shows the retained segments after the extraction process using wavelet transform. The higher amplitude segments based on the DWT energy coefficients were extracted. The extracted segments were then transposed to time history segments to calculate the parameters, kurtosis and fatigue damage. There were 26 segments extracted from the signal, and mostly the segments were from the road surface consisting of rough surface profiling such as paving, potholes and bumps. All segments were then calculated to obtain their features extraction parameters such as kurtosis, DWT energy coefficients and fatigue damage. Then, the features extraction parameters provided as an input data for ANN classification analysis. The signal types from the response according to the road surface and range of fatigue damage are tabulated in Table 1 as a reference for classification purposes.
Fig. 4. Time histories plot captured during the road test
0 2 4 6 8 10 12 14 16 18 20 -1,500
-1,000 -500 0 500 1,000 1,500
M
ic
ro
st
ra
in
(
u
e)
Time (s)
Fig. 6. Retained segment of time history plot
Fig. 7 illustrates the plot of the ANN classification consisting of the parameters of kurtosis, DWT energy coefficients and fatigue damage. This classification for this data has been performed based on the information from Table 1. The classification output is grouped into five classes of fatigue damage; very small, small, moderate, high, very high. This is due to the type of signal and range of the fatigue damage for the time history signal not having a pattern for class number 5. The plot shows the data scattered at class numbers 1 to 4. Most of the data is scattered in class numbers 1 and 2 indicating that the coil spring experience with the fatigue damage was in the range 1.98 x 10⁻⁷ to 7.25 x 10⁻⁴ during the test. Most of the data in this class are from the segment that experienced a paved road surface. Meanwhile, the data scattered in class number 4 are mostly from the segment that experienced large potholes and bumps.
Fig. 7 Distribution of features extraction based on ANN classification
The suggested method for classifying fatigue damage depends on the accuracy. The plots from Figs. 8-10 show the accuracy of the proposed algorithm. In this approach, the accuracy of the training, testing and all data are computed to provide better classification rate with R = 0.9. In the ANN classification, the acceptable accuracy should be 0.9 to obtain the classification with higher accuracy. If the accuracy does not reach 0.9, the training and testing, data needs to be trained to achieve improved accuracy [15-16].
Fig. 8 The accuracy of the training data
Fig. 9 The accuracy for testing data
IV.CONCLUSIONS
In conclusion, based on signal extraction using the DWT technique, the time histories of the stain signal contributed towards identifying 26 damaging segments. This result suggests that DWT can be used as a pre-processing method to extract the features from the signal. In addition, from the results of the classification, it strongly shows that the ANN classification can be used to classify fatigue damage. With the features extraction parameters, it was capable of producing good results for the classification with an accuracy of nearly 0.9. Therefore, it is suggested that the ANN classification is used for the prediction of fatigue damage for coil spring based on the road surface response for the coil spring.
NOMENCLATURE
a
scaleb
time to discretize sa
f active function
n sample size
i
n number of cycle in fatigue test cycles
TOT
D total damage /cycle
f
N number of cycle to failure cycles
fi
N fatigue life based on stress level cycles
SD standard deviation
ji
w Weight
j
y Number of function
Greek letters
a
ε
total strain amplitudef
σ ′ fatigue strength coefficient
f
ε′ fatigue ductility coefficient
m
σ mean stress MPa
Ψ Mother wavelet
ACKNOWLEDGEMENT
The authors would like to express their gratitude to Universiti Kebangsaan Malaysia through the funds of FRGS/1/2015/TK03/UKM/01/2 and GGPM-2017-057 for supporting this research.
REFERENCES
[1] S. M. Dominguez and J. D. Sorensen, “Fatigue reliability and calibration of fatigue design factors for offshore wind turbines,” Energies, vol. 5, pp. 1816-1834, 2012.
[2] Z. Dworakowski, L. Ambrozinski and P. Packo, “Application of artificial neural networks for compounding multiple damage indices in lamb-wave-based damage detection,” Struct. Control Hlth., vol. 22, pp. 50–61, 2015.
[3] L. Witek, M. Sikora, F. Stachowicz, and T. Trzepiecinski, “Stress and failure analysis of the crankshaft of diesel engine,” Eng. Fail. Anal., vol. 82, pp. 703-712, 2017.
[4] S. Suman, A. Kallmeyer and J. Smith, “development of a multilaxial fatigue damage parameter and life prediction methodology for non-proportional loading”. Frattura Integr. Strutt., vol. 38, pp.224-230, 2016.
[5] T. E. Putra, S. Abdullah, D. Schramm, M. Z. Nuawi, and T. Bruckmann, “Generating strain signals under consideration of road surface profiles” Mech. Syst. and Signal Process., vol. 60-6, pp. 485-497, 2015.
[6] A. Ananthakrishnan, I. Kozinsky, and I. Bargatin, “Limits to inertial vibration power harvesting: power spectral density approach and its applications, “arXiv, vol. 2014, pp.1-20. 2014.
[7] T. E. Putra, S. Abdullah, D. Schramm, M. Z. Nuawi, and T. Bruckmann, “Reducing cyclic testing time for components of automotive suspension system utilising the wavelet transform and fuzzy c-mean,” Mech. Syst. and Signal Process., vol. 90, pp. 1-14, 2017.
[8] C. S. Oh, “Application of wavelet transform in fatigue history editing,” Int. J. Fatigue, vol.23 (3), pp. 241–250, 2001.
[9] I. Abu-Mahfouz, and A. Banerjee, “Drill wear feature identification under varying cutting conditions using vibration and cutting force signals and data mining techniques,” Procedia Comput. Sci., vol.36, pp. 556-563. 2014.
[10] J. A. Ghani, A. Rizal, M. Z. Nuawi, R. Ramli, B. Deros and C. H. C. Haron, “Online tool wear monitoring using portable assistant (PDA), Int. J. Phys. Sci., vol.6 (16), pp. 4064-4069, 2011.
[11] S. A. Rizzi, M. N. Behnke and P. Przekop, “The effect of a non-gaussian random loading on high-cycle fatigue of a thermally post-buckled structure, structural dynamics: Recent Advances”, Proc. of the 10th Int. Conf., pp. 1-16, 2010.
[12] H. Gao, H. Z. Huang, S. P. Zhu, Y. F. Li, and R. Yuan, “A modified nonlinear damage accumulation model for fatigue life prediction considering load interaction effects,” Scientific World Journal, vol 2014, pp. 1-7, 2014.
[13] R. Walid and E. Abdellah, “Assessment of fatigue behavior and effects of crack growth in Aluminium alloys 6082 under various stress ratios,” Int. J. on Adv. Sc. Eng. Info.Tech., vol. 6(5), pp. 582-587,2016.
[14] H. El Kadi, Y. Al-Assaf, “Energy-based fatigue life prediction of fiberglass/epoxy composites using modular neural networks,” Compo. Struc. vol. 57, pp. 85-89, 2002.
[15] M. Meng and M. Meng, “Spectrum recognition with three-stage neural network”. 3rd Int. Conf. on Intelligent Networks and Intelligent Systems (ICINIS), Shenyang, China.2010.