HTA Metro Map: a patient centred model for optimizing
the decision making process
Abstract
Health Technology Assessment (HTA) is a systematic evaluation of a health technology, designed to appraise the direct or intended effects
Marco Chiumente
1Khalid M. Kamal
2and indirect or unintended consequences of the technology with an
Hans-Peter Dauben
3overall goal of supporting informed decision making regarding the use
of these health technologies in the healthcare system.
Rainer Riedel
3In this paper, we present fundamental HTA concepts and provide a
conceptual framework that embraces the processes and outcomes
Inaki
Gutierrez-Ibarluzea
4required for integrated healthcare decision-making. The “HTA Metro Map” was designed to guide the user through the different areas on:
where to use, what and whom to involve within the decision process. 1 Scientific Direction, Italian Society for Clinical Pharmacy and Therapeutics, Milan, Italy The map reflects the complexity and inter-connectedness of the different
kind of healthcare services that need to work together to be able to
ef-ficiently deliver coordinated decisions at local, regional, national, and 2 Division of Pharmaceutical,
Administrative and Social international levels. This tool may also serve as base for facilitating
developments and improvements of the HTA structure worldwide. Sciences, School of The paper discusses the main features of the “HTA Metro Map” while
reinforcing the key concepts underlying HTA‘s integrated approach. The
Pharmacy, Duquesne University, Pittsburgh, United States
first view of the map provides the several layers of complexity seen in
HTA and the various lines within the map represent the main actors in- 3 Institute of Health Economics & Medical Outcome volved in the assessment processes. The map connections and crossings
symbolize the interprofessional and interpersonal collaborations while Research, University of Applied Sciences RFH, Cologne, Germany the stations denote the knowledge, skills, experiences, and attitudes
of each professionals as they interact within this framework. Every line
represents a HTA stakeholder and the circular line in the centre repres- 4 Basque Foundation for Health innovation and ents the patient at the centre of the system. The zones, from social to
community and hospital level, represent the need for integration from Research (BIOEF), Barakaldo (Bizkaia), Basque Country, Spain
the perspective of health systems. The HTA Metro Map also has different dimensions depicted by the level of profoundness. Finally, the concepts of different healthcare stakeholder perspectives are introduced both in visual and temporal terms.
The “HTA Metro Map” is designed as a flexible model for easy adaptability and in accurately capturing the complexity inherent in any healthcare system. It is hoped that the map will assist different stake-holders to build network capacity, pool existing resources, and develop a more holistic vision that will result in a sustainable, efficient and collaborative decision-making process.
Keywords:health technology assessment, capacity building, decision making, patient-centred care, continuing medical education
Introduction
Health Technology Assessment (HTA) is an essential support tool in healthcare decision-making due to its strategic importance of bridging the discrepancies between limited healthcare resources, adoption of novel technologies and improving the appropriate use of implemented health technologies [1], [2]. There are sev-eral definitions of HTA, but the most common agreed definition is: “The systematic evaluation of the properties and effects of a health technology, addressing the direct
and intended effects of this technology, as well as its in-direct and unintended consequences, and aimed mainly at informing decision making regarding health technolo-gies [3].”
Some authors have stated that simply eliminating the inefficiencies in the healthcare system may not result in healthcare savings [6]. Efforts are being made in imple-menting and sustaining evidence-based technologies that improve outcomes through robustly demonstrating theoretical value (randomized controlled trials, systematic reviews, meta-analysis), assessing the benefits of a technology in relation to its costs (health economic eval-uations), evaluating the suitability to the context in which it will be implemented (social, ethical, legal, environmental and organizational analyses) and improving safety (regu-latory approaches on national and international level). Bringing all these ideas together revealed that the simple scientific one-dimensional approach probably led to misunderstandings, which may not have been in the best interest of public health-related policies, as well as having the issue of not solving the intention of improving context related outcomes and cost containment within health care services. Given the challenges, in the 1970s, general technology assessment (TA) approaches led to a new transdisciplinary approach called Health Technology Assessment (HTA) [7].
Today the terminology HTA is often misused and reduced to either clinical evaluations or economic analysis without paying much attention to other factors that determine the efficient use and the real value of health technologies in different contexts. Very often there is a lack of engage-ment of different healthcare stakeholders as well as in relation to the expectation, the acceptance and use of a technology as the organizational daily practice issues (standards of care, professional competencies and context related clinical pathways) or the acceptance and affordability challenges among others [8].
Therefore, in order to capture the complexity of health technologies and related interventions and to address the methodological challenges that involve and include opinions from different stakeholders, HTA needs to be multidimensional and transdisciplinary.
Transdisciplinary describes the need to bring together different kind of scientific attitudes; questions and discus-sions are done in cooperative teams at the same time to gain the multidisciplinary issues of identifying questions and answering them not just from one disciplinary per-spective.
Transdisciplinary approaches, although strongly desired, could be challenging given the multifold and often contrasting needs of different stakeholders and a lack of framework that aligns their interests. A seemingly simple solution to enhancing the collaboration among healthcare professionals, aimed at providing an accurate and com-plete assessment of health technologies, is to work on building competencies that can be leveraged for providing a robust evaluation supporting the decision making pro-cess. Training and education in this area are still very heterogeneous, despite several international agencies having published teaching manuals and many universities offering master courses in HTA [9], [10].
To account for the complexity and completeness of healthcare information, people assessing a technology
and preparing a decision should definitely consider and acknowledge the transdisciplinary, multi-stakeholder approach of HTA.
Based on HTA methods, the objectives of this proposal are:
• highlighting the multidimensionality/transdisciplinary nature of the approach for a better decision making process,
• integrating and viewing HTA core concepts within the decision making process,
• offering non HTA experts, as well as HTA experts, a simplified but correct access to find the right person, method and interaction within a specific question, re-garding local requirements as well as healthcare pro-fession.
“HTA Metro Map”: fundamental
concepts
The meaning of the map
Many models could help to show different concepts of HTA, but no single model had been able to combine all the requirements in a way that could still be handled and depicted in a sole frame.
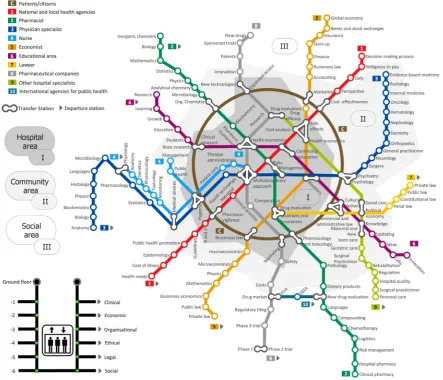
The “HTA Metro Map” (Figure 1) is similar to a traffic plan map, which is basically a set of lines that cross each other, share intersection points and are concentrated in the central zone. Conceptually, these maps describe a complex network with interconnections as peculiarity. By interpreting lines as professionals working areas in the healthcare sector, the starting station is the beginning of their educational pathway and the subsequent stations are particular skills and attitudes of their profession. The multidimensional approach is graphically represented by the levels of depth of different stations, with clinical and economic aspects being within the easy reach of all pro-fessionals while others, such as organisational, ethical, legal, environmental and social aspects being much more complex to evaluate and therefore, are on the outside. The map also highlights the levels of care represented as city areas, from the central “hospital area” to the ex-ternal social periphery. Additionally, the overall traffic or-ganisation is representing the transdisciplinary coordina-tion and exchange to assure the traffic is in time. The structure of the HTA Metro Map is not random, it is inspired by the actual structure of the metro map from the Russian city of Moscow [11] and on the ideas of how many different kind of services have to work together to be able to serve with this kind of complex infrastructure on local, city, regional and national levels.
Figure 1: The “HTA Metro Map” provides a conceptual framework of immediate impact for capacity building purposes of HTA. The figure is inspired by the actual structure of the Metro Map from the Russian city of Moscow and designed using
ConceptDraw®
Pro 11 software (CS Odessa Corporation)
At first sight: complexity
The first sight of the Metro Map, as a whole, provides the level of complexity within HTA. The complexity stems from the collaborative work of many professionals who need to communicate with each other on different topics des-pite having different backgrounds. Multidisciplinarity is a valuable and crucial asset within the healthcare de-cision making process for shared objectives like the effi-cient use of health technologies. Also, all professionals employed in the healthcare sector should be able to contribute without meeting hierarchically classified posi-tions. Conceptually other professionals, even if not primarily involved in healthcare, can influence health choices indirectly. The complexity of the HTA system should be able to consider every aspect of the technology: from the easily identifiable to the more difficult ones.
Many lines: multidisciplinarity/
transdisciplinarity
The lines represent the main actors involved in the as-sessment processes. The presence of 10 coloured lines, which cross each other proceeding towards the central area, creates the idea of essential professional collabor-ation. Each line starts far away from downtown, where most lines cross, like any professional who begins his/her educational career working on its bases.
Often, the basic skills of a professional training are similar in the first period, but the approach to the matter may vary substantially.
identified, could play a key role in the decision-making process.
The transdisciplinary aspect is represented by the concept of traffic at the same time on all lines. Any line could function individually, but would represent a partial analys-is or the whole problem, increasing the likelihood of bias in the separate use of its conclusions to make decisions.
Connections and crossings:
interprofessional/interpersonal
collaborations
Each station represents a competence or an attitude and there are single, double, triple, and quadruple connections in the map, able to connect different lines (shared skills or knowledge by different professionals). The concept behind this graphic representation is the interprofessional and interpersonal collaboration required by the HTA pro-cess. So here the different actors and groups are coming together to see whether the traffic can be synchronized again in case there has been a delay for any reason. In reality, the potential for sharing and cooperation between professionals and people is virtually endless. It is important to highlight that only one or a few profes-sionals will never be enough to consider all aspects of a healthcare technology. Only sustained cooperation between professionals and other related stakeholders including the willingness to discuss on each topic will then make shared decisions feasible, especially to ensure that the future use of any technology will be effective as the theoretical results assumed in the initial assessment of that health technology.
Stations: knowledge, skills, experiences
and attitudes
Within the Metro Map, each line contains a number of stops that represent professional skills and knowledge. All knowledge shared by different lines must be seen as related to similar scientific/social background skills based on common or at least similar terminology and a similar kind of scientific methods and understanding.
However, different professionals involved in HTA may sometimes lead to conflicting evaluations and outcomes, as during ethical evaluations that are often difficult to manage.
Every professional needs to be trained not only by increas-ing knowledge and developincreas-ing specific skills and experi-ences (formerly competencies), but also collaborating with other professionals through their attitudes, especially in complex areas such as the ethical or social ones. Within the lines anyone can see that different kind of specific topics, having the same name in different lines are occurring, but are handled first of all within the con-text of the specific profession. Also at crossing-line sta-tions other professionals can join to support the “decision traveller” on its way to the next station and to clarify topic related issues.
Linear lines: HTA stakeholders
Depending on the nature of a health technology, on the decision background and on the questions which should be answered, every line can vary and can even be adap-ted. If urgent decisions are needed, stations could be skipped when they are not required. By this, due to differ-ent needs, the professional skills on each line can be brought in accordance to the traffic needs. E.g. if a spe-cific implementation knowledge regarding a technology within an entire national health care system is needed, all stations should be used. Conversely, for a common transnational project some of the stations could be skipped due to the fact that there is no common level of health services provision in those nations. Thus, this would need to be added later within the national adapta-tion process (context tailoring). On the other side, com-mon basic medical knowledge, compiled at the transna-tional level, can lead to the issue that during the natransna-tional adaptation process some stations related to this know-ledge can be skipped, making the process itself more efficient. Everyone should bear in mind that this is only possible if the systems are alike and thus, the national guidelines follow the internationally obtained information. Otherwise, the acceptance of this knowledge and the trust on the decision-made would be low or non-existing.
Circular line: patients/citizens
Zones: from social, to community and
hospital level of care
All lines not only connect different stakeholders and pro-fessions, but also different areas of a healthcare system or (by connecting also train stations) regions and nations. The zones represent the need for integration from the perspective of patient-centred systems. That means there are boundaries in terms of care, from acute to community and social care. However, these boundaries need to be replaced by an integrative and integral system that co-ordinates and informs people about different issues in order to provide the best solution to the individual patient. Each patient will have different itineraries including differ-ent zones. Hospital, community and social care will con-tinue defining their services, but knowing with whom to communicate with in order to ensure continuity of care, to benefit from transdisciplinarity and to reduce inefficien-cies. The concept of zones is part of the health forming process as well as the coordination and inclusion of re-lated social and professional groups.
At the same time, other zones have the chance to use the metro lines to connect with other areas. The potential exchange of experiences and opinions as well as facts and background, can lead to effective decisions. When individual problems exceed the boundaries or limits of a single metro map the crossing of the border is necessary; e.g. big ticket technologies that require bigger populations in terms of efficiency or rare-diseases that require bigger geographical areas (referral sites) to promote a size that grants safety, effectiveness and comprehensive economy of scale.
Elevator: different dimensions of HTA
analysis (profoundness of the analysis)
According to the definition, HTA is not only a multidiscip-linary but also a transdiscipmultidiscip-linary political analysis to in-form decision makers. Moreover, it requires the analysis of different dimensions that define the direct and indirect consequences of implementing, using or deleting a technology and in comparison with others. Within those dimensions, we could find, among others: health aspects such as safety and efficacy/effectiveness, economic pects, organisational aspects, ethical issues, legal as-pects, environmental and social issues. The elevator tries to represent these different levels of analysis (profound-ness) from a minimum and core analysis to a tight and accurate analysis that embraces all those mentioned aspects [12]. The latter can not be easily shared within different contexts without considering the differences among them. That is the reason why, the same technology with different outcomes in mind and applied to different systems could lead to different decisions. Accordingly, someone that reads a HTA report should be aware of the level or profoundness of the analysis, in order to consider to which extent the conclusions and recommendations could be applicable in the context of interest without
amendments or adaptation or even further new assess-ment in terms of ensuring its validity and applicability. The elevator gives the possibility of following only a base-line or of assessing more interconnections leading to in-clusion of more different dimensions to the HTA analysis. The level of profoundness could also define the time re-quired for doing this analysis, the further we go, the longer the process will be; thus the process will be tailored better to the context. This is applicable to regional analysis, in which the profoundness and the characteristics of the systems will define the evidence or evidences that could be shared among HTA doers. That is internal validity defined from the method and external validity or applic-ability defined from the degree the health care systems differences affect the direct or adapted adoption of the analysis.
The visual perspective: the city centre
and a view beyond the boundaries
The Metro Map figure also tries to represent the indirect consequences that individual decisions might have on the final decision applied to a technology. Any delay in providing information around a single technology (access to technology delays) or any decision that is based on insufficient data that leads to a rapid decision, provoke a cascade of consequences. For example how the budget will be used or how new technologies knocking at the door will be considered. Any investment requires a cau-tious consideration as it will influence the amount of budget possibly invested elsewhere. The Metro Map is attractive from another point of view. Trains can be delayed (access to treatments or budget constrains) or the coordinator of the metro could give priority access to different lines (adaptive pathways or decisions on priorit-ies in health). Not all health systems have the same pri-orities or goals. These might influence what is going to be assessed and moreover, what is going to be implemen-ted or deleimplemen-ted from the systems.
The temporal perspective: decisions and
future impact
profession-als and citizens; any decision will affect both short and long term conditions.
Conclusions
The importance of HTA for increasing efficiency in healthcare decisions is well acknowledged.
The model of a “Metro Map” provides a multidimensional and transdisciplinary conceptual approach for understand-ing the complexity of HTA. Actors, interactions, back-ground and needs are visualized for easy guidance of all actors in HTA, from scientist to decision maker.
The map is not designed to provide an accurate depiction of the complexity. In that respect, the map is an approach to visualize the HTA-complexity in a simplified model. The strength of the Metro Map is the ability to identify the re-lative position and expertise of different stakeholders, the connections among them and the required interac-tions for better and efficient decisions with the patient in the centre of the healthcare system. The map also provides a good representation of the overall system from whatever position it is viewed. Another advantage is that it can be altered and adjusted as needed. Each metro station could have a different name and could be in a different position in each line. To illustrate a more com-plex system, it may be possible to add more lines and stations; even other metro maps (for complex technolo-gies, rare conditions and required higher competences). Thus, it is clear that the idea is not to provide a one-size-fits-all tool. The map is a flexible tool useful to capture the complexity of the healthcare system which at the same time is adaptable for local, national or international purposes. This will assist different stakeholders to build network capacity, pool existing resources, and to develop a more holistic vision that, hopefully, will result in a sus-tainable (efficient) and collaborative decision making process.
Notes
Author contributions
All authors contributed equally to this work.
Competing interests
The authors declare that they have no competing in-terests.
References
1. Allen N, Liberti L, Walker SR, Salek S. A Comparison of Reimbursement Recommendations by European HTA Agencies: Is There Opportunity for Further Alignment? Front Pharmacol. 2017;8:384. DOI: 10.3389/fphar.2017.00384.
2. Gutiérrez-Ibarluzea I, Chiumente M, Dauben HP. The Life Cycle of Health Technologies. Challenges and Ways Forward. Front Pharmacol. 2017;8:14. DOI: 10.3389/fphar.2017.00014 3. HTAi/INAHTA/EuroScan international network glossary. [cited
2017 Oct 13]. Available from: http://htaglossary.net 4. Bodenheimer T. High and rising health care costs. Part 2:
technologic innovation. Ann Intern Med. 2005;142(11):932-937. DOI: 10.7326/0003-4819-142-11-200506070-00012 5. De Meijer C, Wouterse B, Polder J, Koopmanschap M. The effect
of population aging on health expenditure growth: a critical review. Eur J Ageing. 2013;10(4):353-361. DOI:
10.1007/s10433-013-0280-x
6. Fineberg, HV. A Successful and Sustainable Health System — How to Get There from Here. N Engl J Med. 2012;366(11):1020-1027. DOI: 10.1056/NEJMsa1114777
7. Benoit C, Gorry P. Health technology assessment: the scientific career of a policy concept. Int J Technol Assess Health Care. 2017;33(1):128-134. DOI: 10.1017/S0266462317000186 8. Kaló Z, Gheorghe A, Huic M, Csanádi M, Kristensen FB. HTA Implementation Roadmap in Central and Eastern European Countries. Health Econ. 2016;25 Suppl 1:179-192. DOI: 10.1002/hec.3298
9. Mueller D, Gutiérrez-Ibarluzea I, Schuller T, Chiumente M, Ahn J, Pichon-Riviere A, et al. Capacity building in agencies for efficient and effective health technology assessment. Int J Technol Assess Health Care. 2016;32(4):292-299. DOI:
10.1017/S0266462316000490
10. Zechmeister-Koss I, Schnell-Inderst P, Zauner G. Appropriate evidence sources for populating decision analytic models within health technology assessment (HTA): a systematic review of HTA manuals and health economic guidelines. Med Decis Making. 2014;34(3):288-299. DOI: 10.1177/0272989X13509406 11. Moscow metro map. [cited 2017 Oct 13]. Available from: http://
mosmetro.ru/metro-map/
12. Lampe K, Mäkelä M, Garrido MV, Anttila H, Autti-Rämö I, Hicks NJ, et al. The HTA core model: a novel method for producing and reporting health technology assessments. Int J Technol Assess Health Care. 2009; 25 Suppl 2:9-20. DOI:
10.1017/S0266462309990638
Corresponding author: Marco Chiumente
Scientific Direction, Italian Society for Clinical Pharmacy and Therapeutics, Via Carlo Farini 81, Milan, Italy, Phone: +39 0266802323
Please cite as
Chiumente M, Kamal KM, Dauben HP, Riedel R, Gutierrez-Ibarluzea I. HTA Metro Map: a patient centred model for optimizing the decision making process. GMS Health Innov Technol. 2019;15:Doc02. DOI: 10.3205/hta000132, URN: urn:nbn:de:0183-hta0001328
This article is freely available from
Received:2018-06-20
Accepted:2019-06-26
Published:2019-09-24
Copyright