VOLUME 41, ARTICLE 28, PAGES 815
-
846
PUBLISHED 2 OCTOBER 2019
https://www.demographic-research.org/Volumes/Vol41/28/ DOI: 10.4054/DemRes.2019.41.28
Research Article
The limits to cumulative causation revisited:
Urban-origin Mexico
‒
US migration in an era of
increased immigration restrictions
Guillermo Paredes-Orozco
© 2019 Guillermo Paredes-Orozco.
This open-access work is published under the terms of the Creative Commons Attribution 3.0 Germany (CC BY 3.0 DE), which permits use, reproduction, and distribution in any medium, provided the original author(s) and source are given credit.
1 Introduction 816
2 Background 818
3 Present study 821
4 Data, methods, and analytic strategy 822
4.1 Data 822
4.2 Dependent and independent variables 823
4.3 Analytic strategy 827
5 Results 828
5.1 Descriptive analysis 828
5.2 Variables Analysis of first trip to the United States (all
communities) 829
5.3 Analysis of last trip to the United States (all communities) 833 5.4 Analysis of first trip to the United States (communities surveyed
before 1998) 836
5.5 Analysis of last trip to the United States (communities surveyed
before 1998) 837
6 Discussion and conclusion 838
7 Acknowledgements 840
The limits to cumulative causation revisited: Urban-origin Mexico‒
US migration in an era of increased immigration restrictions
Guillermo Paredes-Orozco1
Abstract
BACKGROUND
Cumulative causation ‒ the self-reproduction of migration through community social ties ‒ is a phenomenon central to the continuation of Mexico‒US migration, particularly for flows originating in rural areas. A debate has emerged over whether this self-reproducing process also occurs in large urban areas.
OBJECTIVE
I aim to determine whether cumulative causation explains US-bound migration from metropolitan areas in Mexico.
METHODS
Data comes from the Mexican Migration Project (MMP), which covers 154 origin communities in Mexico (30 of which are in metropolitan areas) and spans the period 1970‒2015. Event-history models are used to estimate the association between community ties and taking a first and last US trip in rural areas, small cities, and metropolitan areas.
RESULTS
The findings support the contention that the migration process from metropolitan areas in Mexico is self-reproducing. Differences in the strength of community ties for predicting international repeat migration between rural and metropolitan areas have declined in recent decades.
CONTRIBUTION
Previous studies that found no evidence in support of the self-reproduction of migration in metropolitan areas were limited by either the small number of communities assessed or inadequate measurement of community ties. Using a larger sample of communities and better measurement, this study shows that social ties in large cities can play a role similar to that played by rural ties in facilitating and perpetuating international migration. The results suggest that metropolitan migrants from more recently surveyed localities use community ties to reduce the costs and risks of migration.
1. Introduction
One of the most influential theories that have been developed to explain the persistence of international migration flows is cumulative causation (Massey et al. 1993; Morawska 2007; de Haas 2010). According to this theory, migration is primarily a social process driven by the diffusion of information, resources, and support through social networks in the communities of origin. These networks serve to reduce barriers to migration for disadvantaged individuals and ensure the reproduction of migration from sending areas over time (Massey et al. 1987). The cumulative causation theory argues that, as people gain migratory experience, they become a source of ‘migratory social capital’ for other people from the same community of origin (Massey et al. 1987). The accumulation of migratory capital in a given sending area allows migration to become accessible to practically anyone living there (Massey, Goldring, and Durand 1994).
Cumulative causation has been found to explain the persistence of a wide variety of international migration flows, including those from Mexico (Massey et al. 1998), Central America and the Caribbean (Fussell 2010), Poland (Kalter 2011), and China (Liang et al. 2008). In a classic study on the case of Mexico, Massey and Espinosa (1997) analyze data from 41 Mexican communities and find that the likelihood of an individual migrating to the United States increased with the proportion of people in the home community with US migration experience, suggesting that migratory capital plays a central role in perpetuating the migrant flow over time. Later, Massey and Aysa-Lastra (2011) present similar findings using data from a broader set of Mexican communities (128 versus the previous 41).
Other studies, however, have argued that prior migration from a given area does not always feed back and create further migration. According to this argument, the emergence of cumulative causation can be curtailed by conditions in the origin and destination communities. For instance, weak solidarity norms at the origin (Fussell and Massey 2004; Hernandez-Leon 2008) and a lack of opportunities for migrants at the destination (Heer 2002; Kubal and Dekker 2014) may prevent migration from becoming self-sustaining as would-be migrants fail to receive support from previous migrants.
international migration is based on the same social mechanisms that drive migration from rural areas. If the conditions that foment or hinder the development of cumulative causation depend on factors such as the number of people residing in a given sending area and the relationships that exist between them, then we would expect differences in the relevance of cumulative causation for migration from rural and urban areas (Fussell and Massey 2004; Arias and Woo 2004; Hernandez-Leon 2008; Flores-Yeffal and Aysa-Lastra 2011).
One of the few studies to assess this possibility directly in the context of the US‒ Mexico migration flow is Fussell and Massey (2004).These authors analyze data from 70 Mexican communities surveyed by the Mexican Migration Project (MMP) between 1982 and 1998 to determine whether urbanization deterred the formation of cumulative causation. They found that in rural areas, migratory capital is associated with a higher likelihood of migrating to the United States (as the cumulative causation theory suggests), whereas in large urban areas the availability of migratory capital is negatively associated with US migration (the authors refer to this phenomenon as “the limits to cumulative causation”). Among other factors, Fussell and Massey attribute this difference to the allegedly weaker social ties between urban residents, which they argue preclude the formation of migratory social capital in large cities. The authors conclude that the theory of cumulative causation fails to explain international migration from Mexican urban areas.
There are several reasons to revisit the conclusions of this study. First, its analysis rests on a limited sample of large urban communities (of the 70 communities included, only 14 are located in large urban areas). Moreover, the sample did not capture migration occurring after 1998, therefore missing a time period over which urban-origin migration from Mexico grew significantly. Additionally, the United States at the turn of the century (post 9/11) saw a marked increase in restrictionist immigration policy. Heightened border patrol and more punitive immigration enforcement have altered the context in which household migratory decisions are made and may have changed the salience of community social ties for facilitating migration. The September 11 attacks and the rise of anti-immigration sentiments in the United States have led to increased restrictions on immigration (Angelucci 2012). Another factor that has been shown to have shaped Mexico‒US migration in recent times is the economic slowdown brought on by the Great Recession. This economic downturn resulted in a significant reduction in the demand for Mexican immigrant workers, which in turn had a negative impact on migration (Villarreal 2014). Taken together, these factors underscore the importance of revisiting the role played by cumulative causation in facilitating Mexican migration.
in turn can provide access to social capital (see for example Fischer 1972; Wellman 1979; Hofferth and Iceland 1998; Curtis and Guest 2003). In the following study I reexamine the relationship between migratory capital and migration, using a larger, more contemporary sample of communities (154 in total, of which 30 are metropolitan), enabling an assessment of whether the weak ties available to people in metropolitan areas play a similar role in reproducing international migration as strong ties do in rural areas.
2. Background
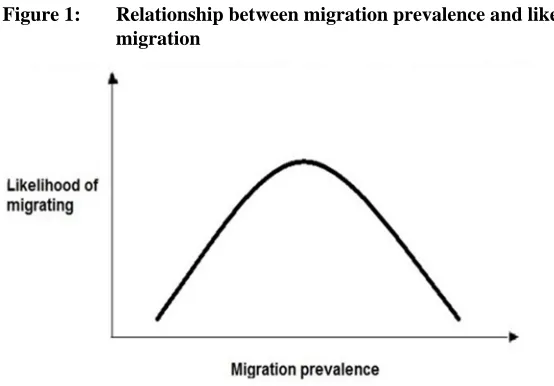
The cumulative causation theory postulates that the diffusion of social capital through communities of origin (previous migrants assisting newer migrants) explains the reproduction of migration (Massey et al. 1987; Massey et al. 1993). This assumes a large degree of acquaintance between people who reside in the same area, as well as social ties that are strong enough to create a sense of solidarity and mutual obligation (Massey et al. 1987). The ‘migration hump’ model suggests that the effect of cumulative causation on migration is inversely U-shaped; in the early stages of the migration process, social capital provided by previous migrants increases the likelihood that more people from the origin community will migrate. As larger numbers of people migrate from a given area, however, remittances and savings from previous migrants increase the local demand for labor, making international migration less attractive (Figure 1; see also Martin and Taylor 1996; de Haas 2010).
Figure 1: Relationship between migration prevalence and likelihood of migration
Source: based on de Haas (2010).
The self-reproducing character of migration postulated by the cumulative causation theory depends not only on the persistence of strong community ties in sending areas but also on changes brought about by the migration process itself (Massey et al. 1993). These changes include a sense of relative deprivation resulting from the inflow of migrant resources into sending communities (Stark and Taylor 1991; Quinn 2006), cultural shifts that create normative pressures for individuals to migrate (Kandel and Massey 2002; Cohen 2004; Garip and Asad 2013), and a reduction in the demand for labor that results from migrants purchasing land as a form of insurance against risk rather than for economic production (Mines and de Janvry 1982; VanWey 2005). Hernandez-Leon (2008) argues that these feedback factors, which explain continued outmigration from the Mexican countryside, do not apply to migration from cities. In rural areas, the purchasing of land by previous migrants can lead to feelings of relative deprivation and give rise to cultural pressures to migrate. Since land in urban areas is less important as a means of production, the aforementioned processes are hypothesized to be less likely to motivate urban residents to migrate and therefore do not contribute to reproducing the migrant flow from large cities (Hernandez-Leon 2008).
urban concentrations make it less likely that any one person will know a large proportion of residents well, they also give rise to greater opportunities for individuals to create and access a variety of social networks and ties. These ties include those to neighbors (Lee, Campbell, and Miller 1991; Martineau 1977; Curtis and Guest 2003), coworkers (Wellman 1979; Dahlin, Kelly, and Moen 2008), friends and acquaintances (Beggs, Haines, and Hurlbert 1996; Barnes 2003), members of clubs and associations (Fischer 1975; Fisher 1995; Barnes 2003), members of religious groups (Martineau 1977), and distant kin (Hofferth and Iceland 1998), among others.
While social ties in cities may not be as frequent or intense as those prevailing in rural areas, they can be more instrumental to achieving the resources needed for social mobility – including migration-related ones – than those found among individuals who have closer relationships to each other (Granovetter 1973). This argument is supported by Liu’s (2013) finding in the Senegalese context that international migrants draw on a variety of social ties (both close and distant) to reduce the costs and risks associated with migration.
Some of the literature on international migration from large metropolitan areas in Mexico (Fussell and Massey 2004; Hernandez-Leon 2008) suggests that the role of social ties in migration from these areas is limited or nonexistent. Hernandez-Leon (2008), in a study of US-bound migration from a metropolitan neighborhood in northern Mexico, argues that while social ties play a role in facilitating migration from cities, the lower intensity of these ties precludes the setting into motion of cumulative causation processes. The author argues that metropolitan ties tend to involve fewer mutual obligations than rural ones, meaning that urban migrants who refuse to assist other people from the same area of origin are less likely to be sanctioned by the community at large (Hernandez-Leon 2008). Moreover, metropolitan areas have more developed labor markets than rural areas, making it less likely for urbanites to experience the feeling of relative deprivation that sustains outmigration from rural areas (Hernandez-Leon 2008; see also Fussell and Massey 2004).
Hernandez-Leon (2008) argues that migration from the metropolitan area he studied is explained by Mexico’s transition from an import-substitution economy to an export-oriented economy in the last few decades. Since export-oriented industries require different skills compared to those that are geared toward the internal market, the reorientation of the economy toward exports displaced many metropolitan Mexicans from manufacturing jobs. Migration to the United States was therefore viewed as a viable option for urbanites who were faced with the lack of economic opportunities in their places of origin. Hernandez-Leon concludes that economic transformations in Mexican urban areas explain the continuation of international migration better than urban social ties.
cumulative causation – such as relative deprivation and cultural changes that create pressures for people to migrate – develop as well. While agreeing that decades of economic crisis and deindustrialization in Mexico have led many urban Mexicans to migrate to the United States, Flores-Yeffal (2013) also finds evidence that migration in large urban areas is likely to create feelings of relative deprivation and perpetuate cultural pressures to migrate, similar to the case of rural localities.
Other studies on migration from metropolitan areas in Mexico (Roberts, Frank, and Lozano-Ascencio 1999; Arias and Woo 2004; Rivera 2008) highlight how rural‒ urban migration has given rise to communities within metropolitan areas where people are related to each other by having originated from the same rural village or town. These rural-origin ties are different from the ‘weak’ urban social ties described previously in that they are often simultaneously based on kinship and shared place of origin and therefore involve a stronger sense of obligation than the weak ties that characterize metropolitan areas (Arias and Woo 2004). These strong ties can in turn facilitate international migration from metropolitan areas in Mexico to the United States (Rivera 2008). If the cumulative causation process occurs in metropolitan areas, it might be driven exclusively by the ‘weak’ urban ties described previously. Alternately, the ‘strong’ ties stemming from rural‒urban migration might also play a role.
3. Present study
To determine whether cumulative causation processes contribute to the reproduction of migration flows from large cities in Mexico, I use data from the Mexican Migration Project (MMP), which has a much larger geographic and temporal coverage than other data sources. Findings made using the MMP data have more external validity than those relying on data from case studies (Durand et al. 2016).
Question 1: Does community social capital have a weaker effect on the likelihood of migrating to the United States from large urban areas compared to rural areas?
If the effect is the same or stronger for large urban areas, it would necessitate an update of Fussell and Massey’s (2004) claim that origin community social capital is less important in explaining the likelihood of migrating to the United States for people of urban origin.
Question 2: Do large urban areas surveyed before 1998 show evidence of cumulative causation of migration?
If found, such a difference would provide the first evidence of changes in how social capital operates to produce cumulative causation in large urban areas. Answering this question will involve looking separately at those communities surveyed from 1982 to 1998 (which were used in Fussell and Massey’s study).
4. Data, methods, and analytic strategy
4.1 Data
Data for this study comes from the Mexican Migration Project (MMP). The MMP collects data on the prevalence of US migration in selected Mexican communities, as well as the migration history, life events, and assets of a sample of household heads collected in each study site. The MMP data collection started with four communities in 1982 and has continued from 1987 onward. The MMP aims to capture changes in the demographic, social, and economic factors surrounding migration by incorporating data from new communities on a regular basis. The community selection process includes areas with a long-standing migratory tradition, as well as areas in which migration is an emerging phenomenon (Durand et al. 2016).
The continuous process of data collection that characterizes the MMP makes it especially well suited for comparing different periods of Mexico‒US migration (Durand et al. 2016). By comparing communities surveyed in different years, it is possible to determine how the factors influencing migration change from one time period to another (Durand et al. 2016). Comparing findings from different releases of the MMP data is similar to using repeated surveys to study how a phenomenon changes in a given population. To date, however, few researchers have taken advantage of this feature of the MMP to contrast previous findings. One of the aims of the present analysis is to contrast previous findings (such as those of Fussell and Massey 2004; Hernandez-Leon 2008; Flores-Yeffal 2013) with those derived from the current MMP database, which includes coverage of more recent time periods as well as additional areas that have not been included in the aforementioned studies.
One limitation faced when using the MMP dataset concerns the size of the sample of metropolitan communities relative to changes in the regions where migrant flows originate. In recent decades, the origins of Mexico‒US migration have diversified from the traditional sending regions in western Mexico to new sending areas, mainly in the southern and eastern regions of the country (Riosmena and Massey 2012; Masferrer and Roberts 2012; Torre and Giorguli 2015). While the present analysis includes a considerable number of metropolitan communities, the sample is not large enough to compare the operation of migrant networks across traditional and emerging sending areas.
The final MMP dataset, which includes 154 origin communities, contains information on 25,452 household heads, of which 87% are male.
4.2 Dependent and independent variables
The occurrence of the first and last trip to the United States are used as dependent variables. Each of these variables takes a value of one if the individual has taken a trip to the United States and a value of zero otherwise. Since less than 4% of person-years in the metropolitan sample correspond to individuals who have taken more than two trips to the United States, this study does not take into account intervening trips between the first and last. In addition to the occurrence of a first trip to the United States (initiation of migration), I also model the last trip in the United States to test whether migrants who have taken more than one trip rely on social capital to reduce the costs and risks of migrating or whether the experience and knowledge acquired during earlier trips make them less dependent on social capital to migrate (Massey and Espinosa 1997; Fussell and Massey 2004).
capital (number of parents and siblings with migration experience to the United States and US migration prevalence in the sending community), occupational category, migratory capital (including previous internal migration experience, number of US trips, months spent in the United States, and documentation), physical capital, and a set of variables used to control for changes in the economic and policy context of Mexico‒ US migration (Massey and Espinosa 1997; Hernandez-Leon 2008). Since data on documentation is only available for those who have taken a first trip to the United States, this variable is only used in the analysis of the likelihood of taking a last trip.
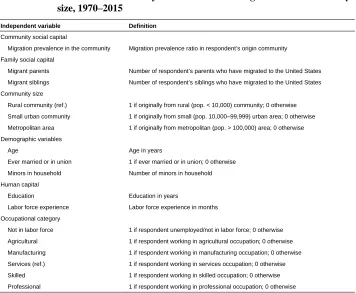
Table 1: Variables used in analysis of international migration and community size, 1970‒2015
Independent variable Definition
Community social capital
Migration prevalence in the community Migration prevalence ratio in respondent’s origin community
Family social capital
Migrant parents Number of respondent’s parents who have migrated to the United States
Migrant siblings Number of respondent’s siblings who have migrated to the United States
Community size
Rural community (ref.) 1 if originally from rural (pop. < 10,000) community; 0 otherwise
Small urban community 1 if originally from small (pop. 10,000‒99,999) urban area; 0 otherwise
Metropolitan area 1 if originally from metropolitan (pop. > 100,000) area; 0 otherwise
Demographic variables
Age Age in years
Ever married or in union 1 if ever married or in union; 0 otherwise
Minors in household Number of minors in household
Human capital
Education Education in years
Labor force experience Labor force experience in months
Occupational category
Not in labor force 1 if respondent unemployed/not in labor force; 0 otherwise
Agricultural 1 if respondent working in agricultural occupation; 0 otherwise
Manufacturing 1 if respondent working in manufacturing occupation; 0 otherwise
Services (ref.) 1 if respondent working in services occupation; 0 otherwise
Skilled 1 if respondent working in skilled occupation; 0 otherwise
Table 1: (Continued)
Independent variable Definition
Migratory capital
Border migration experience 1 if respondent has previously migrated to a US border state within Mexico;
0 otherwise
Non-border migration experience 1 if respondent has previously migrated to a non-US border state within Mexico; 0 otherwise
Number of US trips1 Number of trips to the United States
Time spent in United States1 Time spent in United States in months
Documentation1 1 if respondent possesses documents to stay legally in the United States;
0 otherwise
Physical capital
Hectares of land owned Hectares of land owned (logged)
Properties owned Number of properties owned
Businesses owned Number of businesses owned
Economic and policy context
US wages Minimum wage in United States (in 2015 dollars)
Inflation in Mexico Inflation rate in Mexico (consumer price index)
US employment growth Rate of change in total employment in United States
Foreign direct investment in Mexico Rate of change in direct foreign investment in Mexico
Exports as percentage of Mexican GDP Proportion of Mexican gross domestic product consisting of exports of goods and services
Availability of visas Visa availability ratio
Migration period
1970‒1981 (ref.) 1 if current year is between 1970 and 1981; 0 otherwise
1982‒1993 1 if current year is between 1982 and 1993; 0 otherwise
1994‒2000 1 if current year is between 1994 and 2000; 0 otherwise
2001‒2007 1 if current year is between 2001 and 2007; 0 otherwise
2008‒2015 1 if current year is between 2008 and 2015; 0 otherwise
1
Specified for respondents who have taken at least one trip to the United States.
I divide origin communities into three categories by size: rural areas (less than 10,000 inhabitants), small cities (10,000‒99,999 inhabitants), and metropolitan areas (100,000 inhabitants or more). While this classification is different from those used by Mexican government agencies to characterize rural and urban areas (CONAPO 2012; INEGI 2010), similar criteria have proven useful to study differences in the operation of social capital at different urbanization levels in Mexico (Fussell and Massey 2004; Flores-Yeffal and Aysa-Lastra 2011). The main objective of this study is to compare large metropolitan areas with smaller sending localities; nonetheless, I also compare smaller urban areas with other types of settings. By interacting community size with the other variables in the model, I am able to analyze differences in how community social capital and other factors operate in different types of communities.
Espinosa 1997; Fussell and Massey 2004; Massey and Aysa-Lastra 2011). The MMP defines migration prevalence as the number of persons (males and females) age 15 and older who have made at least one trip to the United States divided by the total number of persons age 15 and older in a given year. I use a continuous variable to model migration prevalence in contrast to a categorical measurement scheme (e.g., Fussell and Massey (2004) to avoid estimation error (e.g., if the cutoff points chosen for each category do not reflect real differences in the association between the independent and dependent variables or if these cutoff points are not the same for all the subgroups included (Harrell 2001)).
It is not clear whether the relationship between migration prevalence and the likelihood of migration is linear or inverse curvilinear. Akaike Information Criterion (AIC) and Bayesian Information Criterion (BIC) goodness-of-fit tests are used to compare the model that includes a linear term for migration prevalence with the model that also includes a quadratic term for the same variable. If the quadratic model is found to have a better fit for the data, it will support the notion that migration networks follow a ‘hump’ pattern of gradual erosion over time.
Fussell and Massey (2004) emphasize the importance of close family ties in facilitating the migration of urban Mexicans. The number of migrant parents and siblings is therefore used as a measure of migratory social capital available through close family ties. Experience obtained by migrating within Mexico may be another asset that facilitates migration to the United States. Migration to states located along the Mexico‒US border has long been speculated to reduce the costs of migrating to the United States as migrants work, collect information, and develop social ties on the Mexican side of the border (Lozano-Ascencio, Roberts, and Bean 1996; Anguiano 1998). For this reason, internal migration to states located along the Mexico‒US border is operationalized as a separate variable from migration to all other states within Mexico.
4.3 Analytic strategy
The likelihood of migrating to the United States is estimated using event history models covering the period from 1970 to 2015. Individuals are observed between the ages of 15 and 65 and removed from the sample whenever they take a trip to the United States. To increase the validity, the effect of the independent variables is estimated with a one year lag. Since the determinants of male and female migration are considerably different (Kanaiaupuni 2000), in the following analysis I focus on only male household heads. In each stage of the analysis, a single model is fitted to include a main equation plus interactions between community size (where rural is the reference category, and small urban and metropolitan are the interacting categories) and all other independent variables.
In addition to models including all 154 MMP communities, separate models are fitted for the communities surveyed between 1982 and 1998 (71 total). Fussell and Massey (2004) include 70 of the first 71 communities in their study, except one for which they did not have complete data at the time. The objective of this step is to compare patterns across community sets to determine if there are any differences and, if so, what is driving the differences.
The analytic strategy consists of two steps: (1) fit an event history model that interacts community size with migration prevalence to determine whether cumulative causation processes operate in metropolitan areas (research question 1), and (2) fit event history models for the communities surveyed before 1998 to determine whether the methodology used in this study gives different results to those of Fussell and Massey (2004) (research question 2).
To contrast Fussell and Massey’s (2004) finding that a limited number of metropolitan communities with high levels of migration prevalence obscure the differences between rural and metropolitan communities as a whole, the aforementioned models will also be fit to exclude the five metropolitan communities with the highest levels of migration prevalence.
5. Results
5.1 Descriptive analysis
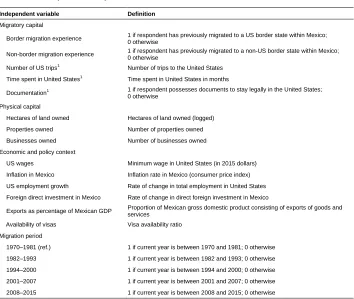
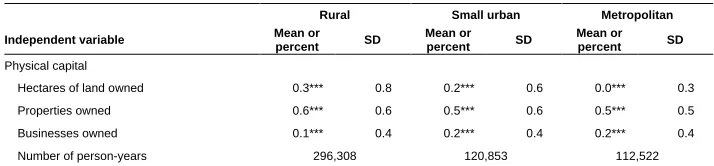
Descriptive results are presented in Table 2. For each variable, either an ANOVA or a chi-square test of independence is conducted across the three community sizes (rural, small urban, and metropolitan). Individuals in metropolitan areas (the main focus of this study) have considerably less access to community social capital on average than people in rural or small urban areas, as measured by the lower migration prevalence ratio (10.9% in metropolitan areas versus 23.8% in rural areas and 27.9% in small cities).
Table 2: Descriptive analysis of variables used in analysis of international migration and community size, 1970‒2015
Rural Small urban Metropolitan
Independent variable Mean or
percent SD
Mean or percent SD
Mean or
percent SD
Community social capital
Migration prevalence in the community 23.8%*** 19.7 27.9%*** 15.7 10.9%*** 7.7
Family social capital
Migrant parents 0.1*** 0.3 0.1*** 0.4 0.1*** 0.3
Migrant siblings 0.4*** 1.1 0.6*** 1.2 0.3*** 0.9
Demographic variables
Age 35.6*** 13.0 35.0*** 12.8 35.0*** 12.8
Ever married or in union 77.0% ‒ 77.0% ‒ 76.7% ‒
Minors in household 2.2*** 2.3 2.2*** 2.3 1.9*** 2.0
Human capital
Education 5.5*** 4.2 6.2*** 4.5 7.8*** 4.6
Labor force experience 276.4*** 187.0 269.6*** 180.9 254.9*** 179.8
Occupational category
Not in labor force 8.2%*** ‒ 7.8%*** ‒ 14.0%*** ‒
Agricultural 43.7%*** ‒ 26.8%*** ‒ 2.1%*** ‒
Manufacturing 6.9%*** ‒ 7.8%*** ‒ 8.0%*** ‒
Services 27.2%*** ‒ 39.5%*** ‒ 52.2%*** ‒
Skilled 18.6%*** ‒ 25.2%*** ‒ 35.3%*** ‒
Professional 8.8%*** ‒ 11.2%*** ‒ 16.1%*** ‒
Migratory capital
Border migration experience 3.5%*** ‒ 3.7%*** ‒ 9.7%*** ‒
Non-border migration experience 19.6%*** ‒ 19.7%*** ‒ 19.2%*** ‒
Number of US trips1 2.8*** 3.3 2.9*** 3.4 1.6*** 1.2
Time spent in United States1 32.6*** 52.9 33.2*** 52.8 30.4*** 52.1
Table 2: (Continued)
Rural Small urban Metropolitan
Independent variable Mean or
percent SD
Mean or percent SD
Mean or
percent SD
Physical capital
Hectares of land owned 0.3*** 0.8 0.2*** 0.6 0.0*** 0.3
Properties owned 0.6*** 0.6 0.5*** 0.6 0.5*** 0.5
Businesses owned 0.1*** 0.4 0.2*** 0.4 0.2*** 0.4
Number of person-years 296,308 120,853 112,522
Source: MMP 1–154.
Notes: ANOVA test used when the variable is continuous; chi-square test used when variable is categorical. The tests compare rural, small urban, and metropolitan areas simultaneously.
+p<.1 *p<.05 **p<.01 ***p<.001
1
Specified for respondents who have taken at least one trip to the United States.
5.2 Analysis of first trip to the United States (all communities)
Results from the interaction model estimating the association between the key independent variables and the probability of taking a first trip to the United States demonstrate that migration prevalence is positively and significantly associated with taking a first US trip, even when controlling for all other variables (Table 3, first column). A comparison of AIC and BIC coefficients suggests that the model including both a linear and a squared migration prevalence term fits the data better than the model that includes only a linear term. The squared migration prevalence term is negative and significant, suggesting that the ‘migration hump’ model appropriately captures the relationship between community social capital and migration in the general sample of MMP communities surveyed over the period. In initial stages of the community migration process, increases in the number of migrants have a positive effect on individual likelihood of taking a first trip. As migration in the sending communities reaches mature stages (i.e., the proportion of migrants becomes higher), an individual’s likelihood of taking a first migratory trip declines.
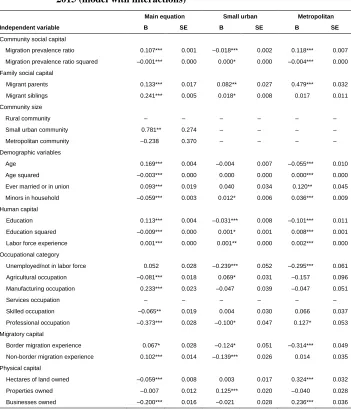
Table 3: Discrete-time event history analysis predicting first US trip, 1970‒ 2015 (model with interactions)
Main equation Small urban Metropolitan
Independent variable B SE B SE B SE
Community social capital
Migration prevalence ratio 0.107*** 0.001 ‒0.018*** 0.002 0.118*** 0.007
Migration prevalence ratio squared –0.001*** 0.000 0.000* 0.000 ‒0.004*** 0.000
Family social capital
Migrant parents 0.133*** 0.017 0.082** 0.027 0.479*** 0.032
Migrant siblings 0.241*** 0.005 0.018* 0.008 0.017 0.011
Community size
Rural community ‒ ‒ ‒ ‒ ‒ ‒
Small urban community 0.781** 0.274 ‒ ‒ ‒ ‒
Metropolitan community –0.238 0.370 ‒ ‒ ‒ ‒
Demographic variables
Age 0.169*** 0.004 ‒0.004 0.007 ‒0.055*** 0.010
Age squared ‒0.003*** 0.000 0.000 0.000 0.000*** 0.000
Ever married or in union 0.093*** 0.019 0.040 0.034 0.120** 0.045
Minors in household ‒0.059*** 0.003 0.012* 0.006 0.036*** 0.009
Human capital
Education 0.113*** 0.004 ‒0.031*** 0.008 ‒0.101*** 0.011
Education squared ‒0.009*** 0.000 0.001* 0.001 0.008*** 0.001
Labor force experience 0.001*** 0.000 0.001** 0.000 0.002*** 0.000
Occupational category
Unemployed/not in labor force 0.052 0.028 ‒0.239*** 0.052 ‒0.295*** 0.061
Agricultural occupation ‒0.081*** 0.018 0.069* 0.031 ‒0.157 0.096
Manufacturing occupation 0.233*** 0.023 ‒0.047 0.039 ‒0.047 0.051
Services occupation ‒ ‒ ‒ ‒ ‒ ‒
Skilled occupation ‒0.065** 0.019 0.004 0.030 0.066 0.037
Professional occupation ‒0.373*** 0.028 ‒0.100* 0.047 0.127* 0.053
Migratory capital
Border migration experience 0.067* 0.028 ‒0.124* 0.051 ‒0.314*** 0.049
Non-border migration experience 0.102*** 0.014 ‒0.139*** 0.026 0.014 0.035
Physical capital
Hectares of land owned ‒0.059*** 0.008 0.003 0.017 0.324*** 0.032
Properties owned ‒0.007 0.012 0.125*** 0.020 ‒0.040 0.028
Table 3: (Continued)
Main equation Small urban Metropolitan
Independent variable B SE B SE B SE
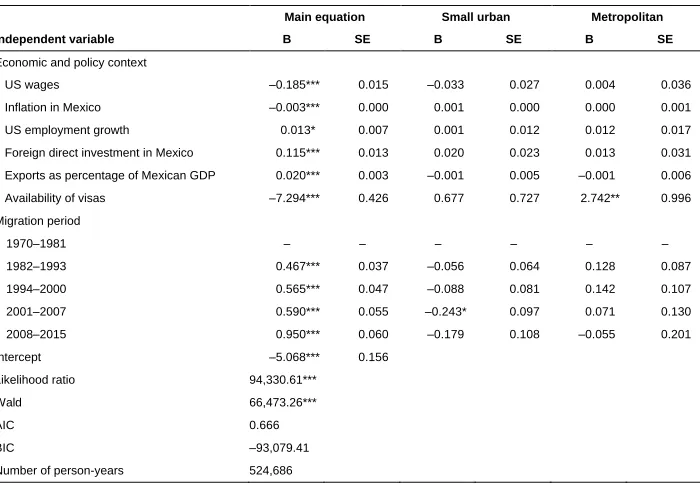
Economic and policy context
US wages ‒0.185*** 0.015 ‒0.033 0.027 0.004 0.036
Inflation in Mexico ‒0.003*** 0.000 0.001 0.000 0.000 0.001
US employment growth 0.013* 0.007 0.001 0.012 0.012 0.017
Foreign direct investment in Mexico 0.115*** 0.013 0.020 0.023 0.013 0.031
Exports as percentage of Mexican GDP 0.020*** 0.003 ‒0.001 0.005 ‒0.001 0.006
Availability of visas ‒7.294*** 0.426 0.677 0.727 2.742** 0.996
Migration period
1970‒1981 ‒ ‒ ‒ ‒ ‒ ‒
1982‒1993 0.467*** 0.037 ‒0.056 0.064 0.128 0.087
1994‒2000 0.565*** 0.047 ‒0.088 0.081 0.142 0.107
2001‒2007 0.590*** 0.055 ‒0.243* 0.097 0.071 0.130
2008‒2015 0.950*** 0.060 ‒0.179 0.108 ‒0.055 0.201
Intercept ‒5.068*** 0.156
Likelihood ratio 94,330.61***
Wald 66,473.26***
AIC 0.666
BIC ‒93,079.41
Number of person-years 524,686
Source: MMP1–154.
Note: +p<.1 *p<.05 **p<.01 ***p<.001.
Other factors that contribute significantly to migration from cities include being married or in a union (for metropolitan areas), number of minors in the household, education (though at only high levels and significantly more for people from metropolitan areas), labor force experience, agricultural occupation (for those migrating from small cities), professional occupation, and physical assets (number of properties owned for those from small cities and land and number of businesses owned for those from metropolitan areas). Border migration experience has a negative influence on taking a first US trip from a metropolitan area, while the coefficient for non-border migration experience is not significant.
Most of the economic and policy context variables (including exports as a percentage of the GDP) have significant effects for the sample as a whole, but these effects are not significantly different for small urban or metropolitan areas. The only exception is availability of visas, which has a negative effect for the sample as a whole but a positive effect for metropolitan areas.
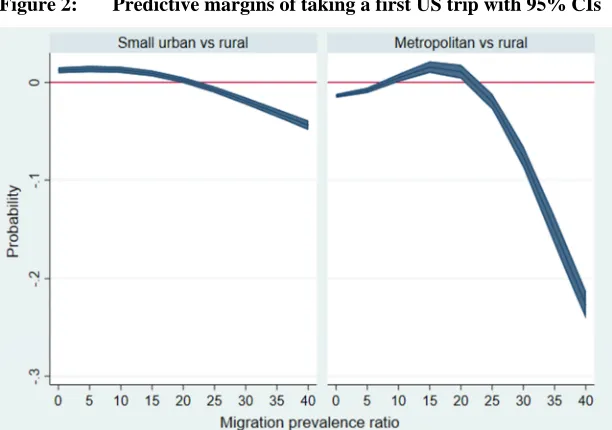
prevalence levels in metropolitan communities range from 0% to less than 40%, the figure includes only this range of values.
Figure 2: Predictive margins of taking a first US trip with 95% CIs
Source: MMP 1-154.
The mean probabilities of taking a first trip to the United States in small cities are higher than those in rural communities when migration prevalence levels are between 0% and 20%. For metropolitan areas this difference is observed when migration prevalence is between 10% and 23%. While migration prevalence in rural areas produces an increase in the likelihood of migrating at levels much higher than those in urban areas, urban migrant networks contribute significantly to increasing the likelihood of migration up through the point where at least one out of every five adult residents in urban communities has migrated. These results are clearly suggestive of the presence of a self-reproducing process of migration in urban areas.
The mean probabilities and their confidence intervals suggest that in metropolitan areas the probability of taking a first US trip is statistically higher than in rural areas when migration prevalence is between 10% and 23% (about 35% of person-years in the total sample are exposed to these prevalence levels). Compatible with a cumulative causation model, once migration has gained a significant foothold in metropolitan communities, the likelihood of further migration increases.
migration prevalence levels are present in only 6 out of the 30 metropolitan communities included in the sample, 4 of which are located in the same metropolitan area. The decreasing probability of migration observed could be the result of specific characteristics of this area. This notion is supported by the fact that if the interaction model is fit without the five communities with the highest migration prevalence levels, the decline observed in Figure 1 disappears (results not shown).
In contrast, the negative probabilities at migration prevalence levels higher than 20% are observed for 84% of the small urban communities in the sample. Therefore, in small cities the evidence is less supportive of a cumulative causation process.
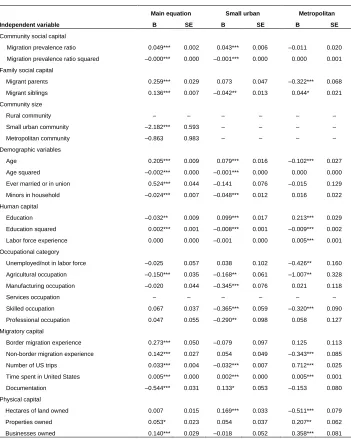
5.3 Analysis of last trip to the United States (all communities)
The interaction model predicting the likelihood of taking a last trip to the United States suggests that migration prevalence is positively and significantly associated with migrating (Table 4, first column). The comparison of AIC and BIC models suggests that the model including both the linear and squared migration prevalence terms fits the data better compared to the one including only a linear term. The coefficient for the squared migration prevalence term is negative and significant, suggesting that the maturing of the migration process influences negatively not only the individual likelihood of taking a first trip but also that of taking additional trips.
Table 4: Discrete-time event history analysis predicting last US trip, 1970‒ 2015 (model with interactions)
Main equation Small urban Metropolitan
Independent variable B SE B SE B SE
Community social capital
Migration prevalence ratio 0.049*** 0.002 0.043*** 0.006 ‒0.011 0.020
Migration prevalence ratio squared ‒0.000*** 0.000 ‒0.001*** 0.000 0.000 0.001
Family social capital
Migrant parents 0.259*** 0.029 0.073 0.047 ‒0.322*** 0.068
Migrant siblings 0.136*** 0.007 ‒0.042** 0.013 0.044* 0.021
Community size
Rural community ‒ ‒ ‒ ‒ ‒ ‒
Small urban community ‒2.182*** 0.593 ‒ ‒ ‒ ‒
Metropolitan community ‒0.863 0.983 ‒ ‒ ‒ ‒
Demographic variables
Age 0.205*** 0.009 0.079*** 0.016 ‒0.102*** 0.027
Age squared ‒0.002*** 0.000 ‒0.001*** 0.000 0.000 0.000
Ever married or in union 0.524*** 0.044 ‒0.141 0.076 ‒0.015 0.129
Minors in household ‒0.024*** 0.007 ‒0.048*** 0.012 0.016 0.022
Human capital
Education ‒0.032** 0.009 0.099*** 0.017 0.213*** 0.029
Education squared 0.002*** 0.001 ‒0.008*** 0.001 ‒0.009*** 0.002
Labor force experience 0.000 0.000 ‒0.001 0.000 0.005*** 0.001
Occupational category
Unemployed/not in labor force ‒0.025 0.057 0.038 0.102 ‒0.426** 0.160
Agricultural occupation ‒0.150*** 0.035 ‒0.168** 0.061 ‒1.007** 0.328
Manufacturing occupation ‒0.020 0.044 ‒0.345*** 0.076 0.021 0.118
Services occupation ‒ ‒ ‒ ‒ ‒ ‒
Skilled occupation 0.067 0.037 ‒0.365*** 0.059 ‒0.320*** 0.090
Professional occupation 0.047 0.055 ‒0.290** 0.098 0.058 0.127
Migratory capital
Border migration experience 0.273*** 0.050 ‒0.079 0.097 0.125 0.113
Non-border migration experience 0.142*** 0.027 0.054 0.049 ‒0.343*** 0.085
Number of US trips 0.033*** 0.004 ‒0.032*** 0.007 0.712*** 0.025
Time spent in United States 0.005*** 0.000 0.002*** 0.000 0.005*** 0.001
Documentation ‒0.544*** 0.031 0.133* 0.053 ‒0.153 0.080
Physical capital
Hectares of land owned 0.007 0.015 0.169*** 0.033 ‒0.511*** 0.079
Properties owned 0.053* 0.023 0.054 0.037 0.207** 0.062
Table 4: (Continued)
Main equation Small urban Metropolitan
Independent variable B SE B SE B SE
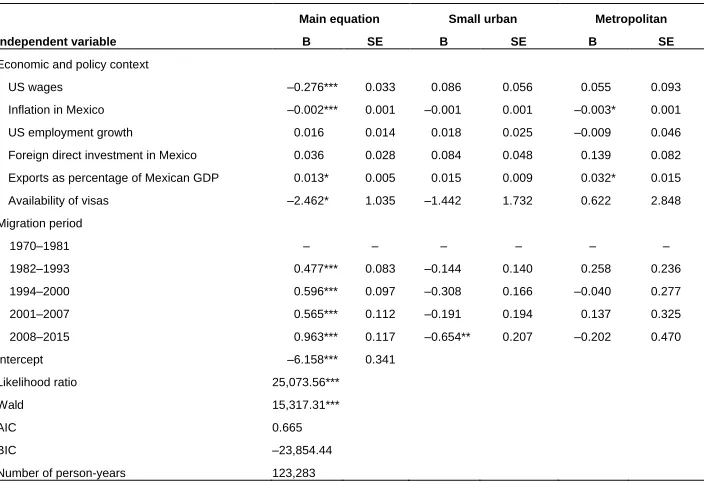
Economic and policy context
US wages ‒0.276*** 0.033 0.086 0.056 0.055 0.093
Inflation in Mexico ‒0.002*** 0.001 ‒0.001 0.001 ‒0.003* 0.001
US employment growth 0.016 0.014 0.018 0.025 ‒0.009 0.046
Foreign direct investment in Mexico 0.036 0.028 0.084 0.048 0.139 0.082
Exports as percentage of Mexican GDP 0.013* 0.005 0.015 0.009 0.032* 0.015
Availability of visas ‒2.462* 1.035 ‒1.442 1.732 0.622 2.848
Migration period
1970‒1981 ‒ ‒ ‒ ‒ ‒ ‒
1982‒1993 0.477*** 0.083 ‒0.144 0.140 0.258 0.236
1994‒2000 0.596*** 0.097 ‒0.308 0.166 ‒0.040 0.277
2001‒2007 0.565*** 0.112 ‒0.191 0.194 0.137 0.325
2008‒2015 0.963*** 0.117 ‒0.654** 0.207 ‒0.202 0.470
Intercept ‒6.158*** 0.341
Likelihood ratio 25,073.56***
Wald 15,317.31***
AIC 0.665
BIC ‒23,854.44
Number of person-years 123,283
Source: MMP1–154.
Note: +p<.1 *p<.05 **p<.01 ***p<.001.
Compared to the first trip model, the contribution of close family ties to repeat migration from cities is more nuanced. The coefficients for migrant parents (in metropolitan areas) and migrant siblings (in small cities) are negative and significant, whereas in the first trip model they were both positive. The coefficient for migrant siblings in metropolitan areas is positive and significant but only at the .05 level. Together with the nonsignificant coefficient for migrant siblings in the first trip model, this finding suggests that having migrant siblings exerts only moderate influence on migration from metropolitan areas.
the .05 level. Inflation in Mexico, which is thought to make households more likely to send members to work in the United States as a form of economic insurance against crisis, is negatively associated with taking a last trip from metropolitan areas, though the significance of this coefficient is also small.
5.4 Analysis of first trip to the United States (communities surveyed before 1998)
To determine whether cumulative causation is present in communities surveyed before 1998, I fit the same interaction model as in the previous sections, including only those MMP communities surveyed before 1998 (1 through 71). To maintain comparability with Fussell and Massey (2004), the model is fit without including the five metropolitan communities with the highest average levels of migration prevalence. Results are presented in Figure 3.
Figure 3: Predictive margins of taking a first US trip with 95% CIs
Source: MMP 1-71.
period is self-reproducing. Overall, the results are similar to those obtained using the full sample of metropolitan communities.
5.5 Analysis of last trip to the United States (communities surveyed before 1998)
The results for communities surveyed before 1998 are presented in Figure 4. The interaction model is fit without including the five communities with the highest levels of migration prevalence. The probability of taking a last trip for metropolitan communities surveyed before 1998 is higher than that for rural areas at the majority of migration prevalence levels. This difference increases as migration prevalence increases, therefore providing evidence of a self-reproducing process of migration. Since in the model for the full sample no significant differences were found in the coefficients for migration prevalence, it can be concluded that for the communities surveyed more recently, the influence of community social capital on the likelihood of taking a last trip is somewhat weaker. The findings for small cities are similar.
Figure 4: Predictive margins of taking a last US trip with 95% CIs
6. Discussion and conclusion
The results suggest that migration prevalence has a significant effect on the likelihood of US migration in both small urban and metropolitan areas in Mexico. In the full MMP sample, the likelihood of taking a first US trip from a metropolitan area is higher than that for rural areas once migration prevalence surpasses 10%. The likelihood of taking a last US trip from a metropolitan area is not statistically different from that of rural areas. Therefore, the evidence supports the presence of cumulative causation processes in large Mexican urban areas. The social process of migration appears to explain the continuation of international migration not only in rural and small urban areas but also in metropolitan areas. The influence of this process is significant after controlling for other factors that have been proposed as explanations for the metropolitan-origin flow to the United States, such as the reorientation of the Mexican economy toward exports. Contrary to what Fussell and Massey (2004) and Hernandez-Leon (2008) have argued, neither the more developed labor markets nor the presumed weaker solidarity norms in metropolitan areas seem to prevent the emergence of a self-reproducing migration process per se, even though these factors may ultimately explain the lower prevalence of migration in large urban contexts.
While previous studies have suggested that metropolitan Mexicans use close family ties instead of community-level social ties to migrate to the United States, the evidence from the MMP offers only partial support for this notion. For metropolitan residents, only the number of migrant parents has a significant influence on the likelihood of taking a first US trip, while the influence of this variable is negative for those taking a last trip. The number of migrant siblings has no significant influence on the likelihood of taking a first trip and a moderately significant one on taking a last trip. The influence of family social capital on migration from small urban communities is also ambiguous. Contrary to what previous literature has suggested, migrants from both small and large urban areas seem to combine both community-level social ties and close family ties to reduce the costs and risks of migrating to the United States.
The results for the MMP communities surveyed before 1998 diverge from those obtained by Fussell and Massey (2004) using the same dataset. Using adjusted mean probabilities rather than a categorical measure of migration prevalence to estimate the effect of metropolitan social capital on migration reveals positive associations that support a cumulative causation model of migration in metropolitan areas. The analysis of the full sample (including the small urban and metropolitan communities surveyed after 1998) suggests a somewhat weaker association between community social capital and US migration than was present before 1998. One possible explanation for this is that more recently surveyed communities include more areas without a strong migratory tradition, meaning that solidarity ties are weaker compared to those in metropolitan areas surveyed in the past. Notwithstanding this more muted association, the findings demonstrate that metropolitan migrants from more recently surveyed communities continue to use community ties to reduce the costs and risks of migration.
The findings of this study support those of Flores-Yeffal’s (2013) qualitative work concerning the presence of a cumulative causation process in large urban areas in Mexico. The social ties present in metropolitan areas reproduce the migration process to the United States. Examples of potential urban social ties include those among neighbors, coworkers, friends and acquaintances, members of clubs and associations, members of religious organizations, and distant kin. The contribution of social ties originating in rural areas and carried into metropolitan contexts also cannot be dismissed, although the lack of positive associations between internal and international migration in the regression models suggest that their importance may be limited.
While much of the previous literature on international migration has emphasized the role of strong rural ties as facilitators of the migration process, this study supports the notion that the strength of weak ties can also be an important element to understand the continuation of international migration. In fact, the evidence presented here suggests that metropolitan Mexicans combine both strong family ties and weak community ties to obtain the assistance they need to migrate. This study therefore contributes to the literature that characterizes international migrants as relying on multiple types of social ties.
Despite metropolitan communities having the lowest average migration prevalence levels, social ties in these areas have an even stronger influence on the probability of taking a first US trip than do ties in rural areas once migration prevalence has risen above a certain threshold. On the other hand, while small urban communities have higher migration prevalence levels, their probability of taking a first trip decreases below that of rural areas as migration prevalence increases. The finding that weak metropolitan ties may actually have a facilitating effect on migration while the presumably stronger small urban ties have a debilitating effect merits further investigation.
idea is that migration of metropolitan Mexicans would be strongly dependent on the evolution of the Mexican economy. Contrary to this notion, the results presented in this study suggest that urban-origin migration has a social dynamic of its own that contributes to the continuation of migration even as economic conditions change. Since metropolitan Mexicans have higher education levels compared to people from smaller localities, the self-reproduction of metropolitan migration contributes to a significant drain of human capital from Mexico. This drain is likely to have negative effects on the Mexican economy, even if migrant remittances and savings partially compensate for it.
One important limitation of this study is that the data source used does not allow us to determine the specific mechanisms (other than social ties) that drive the cumulative causation process in metropolitan areas. Previous literature has emphasized relative deprivation, cultural pressures to migrate, and the effect of migrant investment on the demand for labor as factors that, together with community ties, explain the self-reproduction of migration from rural areas. While it is unlikely that all these factors account for the continuation of urban-origin migration to the same extent as they do in rural areas, it is possible that some of them also explain the reproduction of international migration from large cities. Answering this question will require a qualitative study of the factors that drive the international migration process from metropolitan Mexico.
7. Acknowledgements
The author would like to thank Reanne Frank, Jenna Nobles, Brian Rich, Fernando Riosmena, Andres Villarreal, and two anonymous reviewers for their helpful comments on earlier drafts of this article.
Correction:
On February 21, 2020, some minor changes in wording in Tables 1 through 4 were made at the author’s request.
References
Angelucci, M. (2012). U.S. border enforcement and the net flow of Mexican illegal migration. Economic Development and Cultural Change 60(2): 311‒357.
doi:10.1086/662575.
Anguiano Tellez, M.E. (1998). Migración a la frontera norte de Mexico y su relación con el mercado de trabajo regional.Papeles de Poblacion 4(17): 63‒79.
Arias, P. and Woo Morales, O. (2004). La migración urbana hacia Estados Unidos: Tres ejemplos de la Zona Metropolitana de Guadalajara. Papeles de Poblacion 10(42): 37‒72.
Barnes, S.L. (2003). Determinants of individual neighborhood ties and social resources in poor urban neighborhoods. Sociological Spectrum 23(4): 463‒497.
doi:10.1080/02732170309218.
Beggs, J.J., Haines, V.A., and Hurlbert, J.S. (1996). Revisiting the rural‒urban contrast: Personal networks in nonmetropolitan and metropolitan settings. Rural Sociology 61(2): 306‒325.doi:10.1111/j.1549-0831.1996.tb00622.x.
Berry, W.D. and Feldman, S. (1985).Multiple regression in practice. Thousand Oaks: Sage Publications.doi:10.4135/9781412985208.
Cohen, J.H. (2004).The culture of migration in southern Mexico. Austin: University of Texas Press.
CONAPO (2011). Situacion de la emigración mexicana y la migración de transito irregular en México. In: La situacion demografica de Mexico 2011. Mexico City: Consejo Nacional de Población: 225‒240.
CONAPO (2012).Catalogo sistema urbano nacional. Mexico City: Consejo Nacional de Poblacion.
Cruz Pineiro, R. and Silva Quiroz, Y. (2014). Dos decadas de cambios y continuidades de la migracion hacia la Frontera Norte de Mexico. In: CONAPO.20 años de la Encuesta sobre Migracion en la Frontera Norte de Mexico. Mexico City: Consejo Nacional de Poblacion: 37‒55.
Curtis White, K.J. and Guest, A.M. (2003). Community lost or transformed? Urbanization and social ties. City and Community 2(3): 239‒259.
doi:10.1111/1540-6040.00053.
Durand, J., Massey, D.S., Pren, K., Giorguli, S.E., and Lindstrom, D. (2016). El proyecto de migracion Mexicana (Mexican Migration Project, MMP). Monitoreo y analisis del proceso migratorio entre Mexico y Estados Unidos. Coyuntura Demografica 10: 105‒113.
EL COLEF (2018). Tabulados EMIF NORTE. Serie anualizada 1995‒2016 [electronic resource]. Tijuana: EL COLEF. http://www.colef.mx. https://www.colef.mx/emif/resultados/tabulados/tabnte/tabulados/series_2016/P DS_Serie_95a16.xlsx
Faist, T. (2000).The volume and dynamics of international migration and transnational social spaces. Oxford: Clarendon Press. doi:10.1093/acprof:oso/978019829391 0.001.0001.
Fischer, C.S. (1972). ‘Urbanism as a way of life:’ A review and an agenda. Sociological Methods and Research1(2): 187‒242.doi:10.1177/004912417200100203.
Fischer, C.S. (1975). Toward a subcultural theory of urbanism. American Journal of Sociology80(6): 1319–1341.doi:10.1086/225993.
Fischer, C.S. (1995). The subcultural theory of urbanism: A twentieth-year assessment. American Journal of Sociology 101(3): 543‒577.doi:10.1086/230753.
Flores-Yeffal, N. (2013). Migration-trust networks: Social cohesion in Mexican US-bound emigration. College Station: Texas A&M University Press.
Flores-Yeffal, N.Y. and Aysa-Lastra, M. (2011). Place of origin, types of ties, and support networks in Mexico‒U.S. migration. Rural Sociology 76(4): 481‒510.
doi:10.1111/j.1549-0831.2011.00060.x.
Fussell, E. (2004). Sources of Mexico’s migration stream: Rural, urban, and border migrants to the United States. Social Forces 82(3): 937‒967. doi:10.1353/ sof.2004.0039.
Fussell, E. (2010). The cumulative causation of international migration in Latin America.The ANNALS of the American Academy of Political and Social Science 630(1): 162‒177.doi:10.1177/0002716210368108.
Fussell, E. and Massey, D.S. (2004). The limits to cumulative causation: International migration from Mexican urban areas.Demography 41(1): 151‒171.doi:10.1353/ dem.2004.0003.
Garip, F. and Asad, A.L. (2013). Network effects in Mexico‒U.S. migration: Disentangling the underlying social mechanisms.American Behavioral Scientist 60(10): 1168‒1193.doi:10.1177/0002764216643131.
Granovetter, M.S. (1973). The strength of weak ties. American Journal of Sociology 78(6): 1360‒1380.doi:10.1086/225469.
Haas, de H. (2010). The internal dynamics of migration processes: A theoretical inquiry. Journal of Ethnic and Migration Studies 36(10): 1587‒1617.
doi:10.1080/1369183X.2010.489361.
Harrell, F.E. (2001).Regression modeling strategies. New York: Springer.doi:10.1007/ 978-1-4757-3462-1.
Heer, D.M. (2002). When cumulative causation conflicts with relative economic opportunity: Recent change in the Hispanic population in the United States. Migraciones Internacionales 1(3): 32‒53.
Hernandez-Leon, R. (2008).Metropolitan migrants: The migration of urban Mexicans to the United States. Berkeley: University of California Press.
Hofferth, S.L. and Iceland, J. (1998). Social capital in rural and urban communities. Rural Sociology 63(4): 574‒598.doi:10.1111/j.1549-0831.1998.tb00693.x.
INEGI (2010). Compendio de criterios. Marco Geoestadistico Nacional. Aguascalientes: Instituto Nacional de Estadistica y Geografia.
Kalter, F. (2011). Social capital and the dynamics of temporary labour migration from Poland to Germany. European Sociological Review 27(5): 555‒569.
doi:10.1093/esr/jcq025.
Kanaiaupuni, S.M. (2000). Reframing the migration question: An analysis of men, women, and gender in Mexico.Social Forces 78(4): 1311‒1347.doi:10.1093/sf/ 78.4.1311.
Kandel, W. and Massey, D.S. (2002). The culture of Mexican migration: A theoretical and empirical analysis. Social Forces 80(3): 981‒1004. doi:10.1353/sof. 2002.0009.
Kubal, A. and Dekker, R. (2014). Exploring the role of interwave dynamics in stagnating migration flows: Ukrainian migration to the United Kingdom and the Netherlands. Journal of Immigrant and Refugee Studies 12(3): 274‒292.
doi:10.1080/15562948.2013.839068.
Liang, Z., Chunyu, M.D., Zhuang, G., and Ye, W. (2008). Cumulative causation, market transition, and emigration from China. American Journal of Sociology 114(3): 706‒737.doi:10.1086/592860.
Liu, M.M. (2013). Migrant networks and international migration: Testing weak ties. Demography 50(4): 1243‒1277.doi:10.1007/s13524-013-0213-5.
Lozano-Ascencio, F., Roberts, B.R., and Bean, F.D. (1996). The interconnectedness of internal and international migration: The case of the United States and Mexico. Austin: University of Texas at Austin (Texas Population Research Center Paper; 96-97-02).
Martin, P.L. and Taylor, J.E. (1996). The anatomy of a migration hump. In: Taylor, J.E. (ed.).Development strategy, employment, and migration: Insights from models. Paris: OECD: 43‒62.
Martineau, W.H. (1977). Informal social ties among urban black Americans: Some new data and a review of the problem. Journal of Black Studies 8(1): 83‒104.
doi:10.1177/002193477700800106.
Masferrer, C. and Roberts, B.R. (2012). Going back home? Changing demography and geography of Mexican return migration.Population Research and Policy Review 31(4): 465‒496.doi:10.1007/s11113-012-9243-8.
Massey, D.S., Alarcon, R., Durand, J., and Gonzalez, H. (1987).Return to Aztlan: The social process of international migration from western Mexico. Berkeley: University of California Press.
Massey, D.S., Arango, J., Hugo, G., Kouaouci, A., Pellegrino, A., and Taylor, J.E. (1993). Theories of international migration: A review and appraisal.Population and Development Review 19(3): 431‒466.doi:10.2307/2938462.
Massey, D.S., Arango, J., Hugo, G., Kouaouci, A., Pellegrino, A., and Taylor, J.E. (1998).Worlds in motion: Understanding international migration at the end of the millennium. Oxford: Clarendon Press.
Massey, D.S. and Aysa-Lastra, M. (2011). Social capital and international migration from Latin America.International Journal of Population Research 1(1): 50‒67.
doi:10.1155/2011/834145.
Massey, D.S., Goldring, L., and Durand, J. (1994). Continuities in transnational migration: An analysis of nineteen Mexican communities.American Journal of Sociology99(6): 1492‒1533.doi:10.1086/230452.
Mines, R. and Janvry, A. (1982). Migration to the United States and Mexican rural development: A case study.American Journal of Agricultural Economics 64(3): 444‒454.doi:10.2307/1240636.
Morawska, E. (2007). International migration: Its various mechanisms and different theories that try to explain it. Malmo: Malmo University (Willy Brandt Series of Working Papers).
Quinn, M.A. (2006). Relative deprivation, wage differentials and Mexican migration. Review of Development Economics 10(1): 135‒153. doi:10.1111/j.1467-9361. 2005.00306.x.
Riosmena, F. and Massey, D.S. (2012). Pathways to El Norte: Origins, destinations, and characteristics of Mexican migrants to the United States. International Migration Review 46(1): 3‒36.doi:10.1111/j.1747-7379.2012.00879.x.
Rivera Sanchez, L. (2008). El eslabón urbano en el trayecto interno del circuito migratorio Mixteca-Nueva York-Mixteca: Los migrantes de Nezahualcóyotl, Estado de Mexico. In: Levine, E. (ed.). La migración y los latinos en Estados Unidos: Visiones y conexiones. Mexico City: Universidad Nacional Autonoma de Mexico: 53‒73.
Roberts, B. and Hamilton, E. (2005). La nueva geografía de la emigracion: Zonas emergentes de atracción y expulsión, continuidad y cambio. In: Ariza, M. and Portes, A. (eds.).El país transnacional: Migracion mexicana y cambio social a través de la frontera. Mexico City: Universidad Nacional Autonoma de Mexico: 83‒118.
Roberts, B.R., Frank, R., and Lozano-Ascencio, F. (1999). Transnational migrant communities and Mexican migration to the U.S. Ethnic and Racial Studies 22(2): 238‒266.doi:10.1080/014198799329477.
Stark, O. and Taylor, J.E. (1991). Migration incentives, migration types: The role of relative deprivation.The Economic Journal 101(408): 1163‒1178.doi:10.2307/ 2234433.
Torre Cantalapiedra, E. and Giorguli, S.E. (2015). Las movilidades interna y de retorno de los varones migrantes mexicanos a Estados Unidos en perspectiva longitudinal (1942‒2011). Estudios Demograficos y Urbanos 30(1): 7‒43.
VanWey, L.K. (2005). Land ownership as a determinant of international and internal migration in Mexico and internal migration in Thailand.International Migration Review 39(1): 141‒172.doi:10.1111/j.1747-7379.2005.tb00258.x.
Villarreal, A. (2014). Explaining the decline in Mexico‒U.S. migration: The effect of the Great Recession.Demography 51(6): 2203‒2228. doi:10.1007/s13524-014-0351-4.
Wasserman, I.M. (1982). Size of place in relation to community attachment and satisfaction with community services. Social Indicators Research 11(4): 421‒ 436.doi:10.1007/BF00323190.
Wellman, B. (1979). The community question: The intimate networks of East Yorkers. American Journal of Sociology 84(5): 1201‒1231.doi:10.1086/226906.