VOLUME 41, ARTICLE 52, PAGES 1453
-
1478
PUBLISHED 20 DECEMBER 2019
https://www.demographic-research.org/Volumes/Vol41/52/ DOI: 10.4054/DemRes.2019.41.52
Research Article
Capturing trends in Canadian divorce in an era
without vital statistics
Rachel Margolis
Youjin Choi
Feng Hou
Michael Haan
© 2019 Rachel Margolis, Youjin Choi, Feng Hou & Michael Haan.
This open-access work is published under the terms of the Creative Commons Attribution 3.0 Germany (CC BY 3.0 DE), which permits use, reproduction, and distribution in any medium, provided the original author(s) and source are given credit.
1 Introduction 1454
2 The Canadian data landscape 1455
3 Data and methods 1456
4 Results 1459
5 Discussion 1467
6 Acknowledgments 1470
References 1472
Capturing trends in Canadian divorce in an era without vital
statistics
Rachel Margolis1 Youjin Choi2
Feng Hou3 Michael Haan2
Abstract
BACKGROUND
Statistics Canada ceased publishing vital statistics on marriage and divorce in 2008, leaving a knowledge gap in these important demographic indicators.
OBJECTIVE
This paper makes the methodological contribution of examining how best to operationalize divorce with tax data, and the substantive contribution of presenting recent trends in divorce in Canada.
METHODS
We examine trends in divorce using both vital statistics and administrative tax data and compare them during the period for which they are available (through 2008). Then, using administrative tax data, we update trends in divorce through 2016. We examine overall, age-specific, and age-standardized trends in divorce.
RESULTS
We document “gray divorce” from the 1990s through 2008 and then flat divorce rates for older adults and a continued decline in divorce for younger adults through 2016.
CONCLUSIONS
Tax data show a recent decline in divorce trends in Canada. However, there are important limitations to estimating divorce with tax data. We discuss data gaps and make suggestions for more accurate measures of union dissolution.
1 Corresponding author. Associate Professor, Department of Sociology, University of Western Ontario,
CONTRIBUTION
Divorce is important for demographers to measure well, and this paper carefully examines recent trends and critically evaluates administrative data’s ability to fill the void left by the termination of vital statistics.
1. Introduction
Measures of marriage and divorce are key indicators of formal unions, which are also important for understanding the family context where most fertility takes place, as well as wealth accumulation, housing, and caregiving. Vital statistics are the key source of marriage and divorce information in most countries, although some countries have recently moved away from this mode of data collection into alternate strategies of estimation. For example, the United States stopped collecting detailed divorce data in 1996, arguing that similar data could be collected more easily and inexpensively through surveys (such as the American Community Survey and the Survey of Income and Program Participation) (Elliott, Simmons, and Lewis 2010; Kennedy and Ruggles 2014). In Canada, Statistics Canada ceased publishing estimates of marriage and divorce in 2008, with no alternative data source in place. This decision was made in the face of fiscal constraints, challenges of data comparability across jurisdictions, and low usage of these data online (McKinnon 2018). The chair of the Advisory Committee on Demographic Statistics and Studies from that time noted that the committee strongly recommended adding new questions to estimate marriage and divorce into the census or a very large survey (Beaujot 2009). However, this did not occur, and the divorce data gap remains to this day.
This paper seeks to fill four important gaps. First, it is unknown how well we can measure divorce with administrative data. It is important to measure divorce itself well. It is also important to understand the quality of marital status information in tax data more generally, as it has been used in much other policy-informing research. Some recent research has used administrative tax data in Canada to study the consequences of divorce for income trajectories, but without assessing the quality of the divorce measures (e.g.,Corak 2001; LaRochelle-Côté, Myles, and Picot 2012; Le Bourdais et al. 2016). Understanding how well administrative data capture trends in divorce can help put these findings in perspective.
updated estimates of divorce rates are from tax data. This is the first paper to use this data source for this purpose. Note that we focus on formal divorce, not dissolution of cohabiting unions.
Third, we do not know how the age pattern of divorce has changed in Canada since the early 1990s. Canada’s southern neighbor, the United States, had a relatively flat overall divorce rate in the 1990s and 2000s that masked dramatic changes in the age pattern of divorce, with reductions at younger ages and increases in “gray divorce” (Kennedy and Ruggles 2014; Brown and Lin 2012). The factors leading to increased selectivity into marriage for younger adults (Kennedy and Ruggles 2014) and higher risk of divorce for older adults are likely similar in Canada. Baby boomers in Canada are also experiencing a decreased stigma around divorce (Uhlenberg and Myers 1981); increased prevalence of older adults in higher-order marriages, which are associated with higher risks of divorce (Brown and Lin 2012); increased financial independence of female baby boomers (Schoen et al. 2002); and increasing life expectancy, combined with high expectations about marital relationships and the increased social acceptability of being unpartnered (Cherlin 2004; Wu and Schimmele 2007). We examine how divorce has changed among both younger and older Canadians and whether the gray divorce revolution has occurred in Canada.
Last, we examine how sensitive the divorce trend is to changes in age composition by examining both unstandardized and age-standardized divorce rates. Recent work by Kennedy and Ruggles (2014) finds that the age-standardized divorce rate increased in the United States in the 1990s and 2000s, even though the unstandardized divorce rate declined. This was due to profound changes in the composition of the married population, with younger people being less likely to be married, and recent increases in divorce are seen at age 40 and above. We provide similar analysis for Canada.
This paper first makes the methodological contribution of examining how best to operationalize divorce with tax data. Second, we make the substantive contribution of presenting recent trends in divorce in Canada. We examine trends and the age pattern of divorce from administrative tax records and compare them with vital statistics during the period for which they are all available (1991‒2008). Then, using administrative tax data, we update trends in divorce through 2016. Last, we discuss the implications of these data gaps and make suggestions for improving the measurement of marital dissolution in Canada.
2. The Canadian data landscape
the Labour Force Survey, and many other surveys include a question about current marital status but do not include questions on marriages or divorces in the last year or about length of current marriage. The General Social Survey (GSS) cycles on the family (1990, 1995, 2001, 2006, 2011, and 2017) include respondents’ partnership histories, including their current marital status, number of total marriages, and the start and end dates of two to four marriages (depending on the wave). We used several cycles of the GSS to test whether we could estimate trends in divorce from these data, and although these are large population surveys, we found that the number of divorces estimated in the year before each survey wave was not large enough to provide robust estimates of divorce overall, let alone measures by length of marriage or various demographic characteristics. The results of this analysis are available in Appendix 1. Apart from surveys, Canada does not have a population register system or a national identity system. Statistics Canada is moving toward a greater reliance on administrative data (such as health data or vital statistics linked with tax data) (Statistics Canada, https://www.statcan.gc.ca/eng/sdle/overview).
3. Data and methods
The first data source we use is a vital statistics database available from 1969 to 2008. To estimate divorce rates from vital statistics (divorces per 1,000 legally married women), the numerator is the number of divorces granted to women in the vital statistics divorce database and the denominator is the number of legally married women from Statistics Canada’s population estimates. To count the number of divorces granted in a given year, we used all records in the given year of the vital statistics divorce database file. This matches the trend of divorces at the national level reported inAnnual Demographic Statistics, published by Statistics Canada. Data on the number of legally married women come from Demographic Estimates Compendium, also published by Statistics Canada. For the years 1971 to 2007, the source is the CD-ROMDemographic Estimates Compendium, 2007 (2008b). This data source for the denominator allows us to replicate divorce rate trends published in Annual Demographic Statistics for the entire time series since 1971. This data source doesn’t include population estimates for 2008, so for that year, we use the population estimates for July 1, 2008, available here: https://www150.statcan.gc.ca/t1/tbl1/en/tv.action?pid=1710006001 (Statistics Canada 2019, Table 17-10-0060-01).
were combined in population estimates that form the denominator for divorce rates (Statistics Canada 1992). Starting in 1991, the married and common-law relationships (nonmarital cohabitation)4 can be distinguished. Another issue to note is that starting in 2006, same-sex marriages and divorces entered vital statistics; therefore, our estimates for 2006‒2008 include events for same-sex couples twice and include both women in the denominator. Due to these issues of data comparability, we can show numbers of divorces for 1969‒2008 and then compute divorce rates for the period 1991‒2008.
The second data source is administrative data from the T1 Family File tax form (T1FF) from 1993 to 2016. This source includes tax data for all individuals who filed taxes in Canada in a given year. (The T1 is the primary Canadian tax form.)5 Most Canadians file taxes. For example, in 2014 about 75% of the Canadian population (all ages) filed a tax return. Statistics Canada’s T1 Family File includes not only those who file taxes but also their non-filing family members, such as partners/spouses and children, whose information can be inferred from information about dependents and benefits on the tax forms. (For example, information about children is relevant on tax forms for benefits such as the child benefit.) By combining family data across multiple years, the completed T1FF sample is approximately 96% of the population (Statistics Canada 2016). The tax data are not designed to measure marriage and divorce. In fact, eligibility for most benefits does not differ for married or unmarried cohabiting couples. There are no questions about the date of a marriage or divorce. However, the data do include a question about one’s self-reported marital status as of December 31 of the tax year, and this information may be used to measure changes in marital status across years.
Respondents can choose one of six options: married, common law, widowed, divorced, separated, or single. Legally married individuals are those who report being married or separated; the others count as unmarried. We use year-to-year changes in individuals’ marital status to identify divorces in a given year. To do so, we link the same individual in the two consecutive tax years with the longitudinal person ID and estimate divorce rates using individuals observed over subsequent years. We exclude those who are not a tax filer, a deceased filer, or a living tax filer matched to a deceased filer in either year. This restriction reduces our sample size by less than 5%. Estimated divorce rates without this restriction are similar to results with the restriction.
We estimate three measures of divorce to examine how well these measures estimated on tax data fit the vital statistics trends. Note that all three measures have
4 Note that “common law” is a Canadian term for nonmarital cohabitation.
numerators and denominators from the tax data, and all women counted in the numerators are also in the denominators as legally married in yeart-1.6
The first way we operationalize the divorce rate is with the number of women reporting a marital status of divorced on December 31 of yeart divided by the number ofthose women who report being legally married on December 31 of yeart-1. This is the most straightforward measure and should capture marriages that span the end of a calendar year, although we likely miss short-lived marriages that begin and end within the same calendar (tax) year with this measure.
The next two operationalizations of divorce include women with a broader set of marital status categories at the end of year t in the numerator. This is designed to capture divorces that have already taken place but that never showed up in the tax data because women went from being legally married in one year to another marital status by the end of the next tax year. For example, a woman could have been legally married in year t-1, gotten divorced in yeart, and be cohabiting with or married to a new partner on December 31 of yeart. Each measure below includes a more expansive numerator and the same denominator (legally married women on December 31 of yeart-1). The second operationalization includes women in the numerator who report their marital status as either divorced or living common law with someone other than the person they were legally married to in the previous year. The third operationalization includes women who report being divorced, living common law with a different partner than in the previous year, or being married to a new spouse in yeart.
Our analysis aims to understand changes in the overall trend and age pattern of divorce in Canada and compares trends and levels across our two data sources to assess our ability to capture divorce with tax data. First, we chart the annual number of divorces estimated with vital statistics and tax data (1994‒2016) and examine divorce counts by age to determine which age groups are responsible for discrepancies in divorce counts (Figure 1). Second, using both data sources (vital statistics 1969‒2008, tax data 1994‒2016), we plot the number of divorces by age (Figure 2). Next, we use tax data to first see whether we can capture the overall trend in divorces per 1,000 married women using various measures (Figure 3). We chart age-specific divorce rates (Figure 4). Next, we examine the unstandardized and age-standardized divorce rates estimated with both vital statistics and tax data to examine whether the trend is sensitive to changes in the age composition of the population (Figure 5).7 For vital statistics, age-standardized rates use a standard population of married women in 2008. For tax data,
6 All measures of divorce are based on the reported marital status of tax filers. We do not consider having the
same mailing address as a precondition to being considered married. Legally married couples living at separate addresses would be considered married according to our analysis.
7 Note that the standardization is done by the respondent’s age, not by the age of the marriage. (Data on the
age-standardized rates use the tax population standard for 2008. Finally, we compare the trends in Canada to the US data (Figure 6).
4. Results
Figure 1a presents the annual number of divorces captured with vital statistics and tax data. In 1994, the first year where we have comparable data, and in 2001, the counts from tax data are just 3% lower than estimates from vital statistics. However, over most years, the undercount of divorce in tax data relative to vital statistics is much greater. The average undercount across all the years in the chart is 9,558 divorces, or 14%. Also, the gap is greatest in the last three years of vital statistics (2006‒2008), where 22% of vital statistics divorces are missing in the tax data. The variation in the counts of divorce captured by the tax data relative to vital statistics likely relates to the coverage of tax filers and changes in tax regulations. For example, the increase in coverage in 2001 may relate to an increase in the tax filing rate between 2000 and 2001 (from 72% to 73%), and if the increase was concentrated among the divorced, this could explain the lower difference in this year. Another factor could be that 2001 was the first year that cohabiting couples had the same tax benefits as married couples. A third factor was that 2001 was the first year that the Canadian Revenue Agency allowed same-sex couples to file taxes as couples. Another year that had a smaller gap between the two data sources was 2005. This was the first year that same-sex marriage was legalized at the federal level. This year also saw an increase in the tax filing rate of half of a percentage point.
Figure 1a: Annual number of divorces estimated with vital statistics and tax data
Note: Divorces measured with tax data are the number of women who were legally married on December 31 of yeart-1 and divorced on December 31 of yeart.
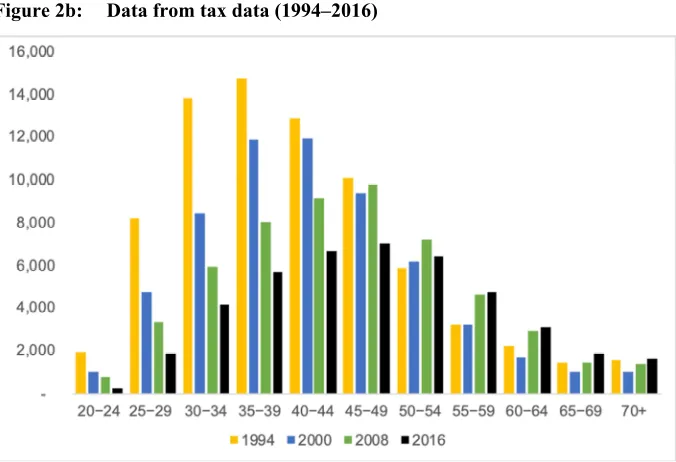
We also examine the number of divorces in Canada over time for women by age group, showing a huge change in the age pattern of divorce. Figures 2a and 2b both show that the age at which the most divorces were granted has increased over time. In the 1980s and 1990s, women in their 20s and 30s were granted the most divorces. In 2000, the most divorces were granted to women in their late 30s and 40s, and by 2008 and 2016, the most divorces occurred among women in their 40s.
Figure 2: Number of divorces in Canada among women aged 20 and above by age group
Figure 2b: Data from tax data (1994‒2016)
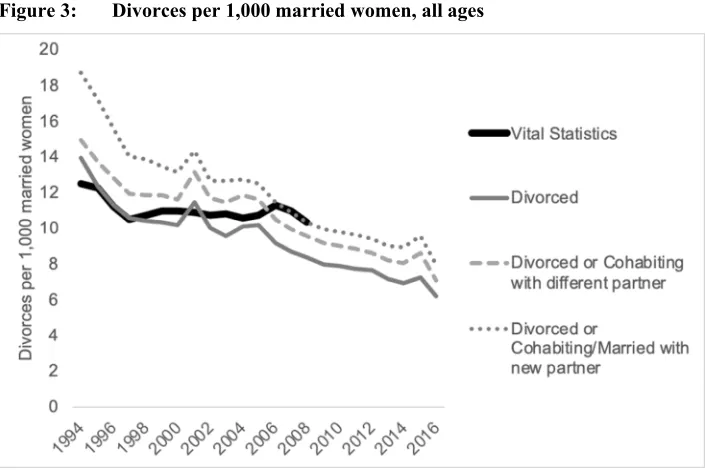
Figure 3: Divorces per 1,000 married women, all ages
Note: Each line is a different definition, with the self-reported marital status variable in the tax data compared with vital statistics.
Figure 4: Age-specific divorce rates, women Figure 4a: Vital statistics (1991‒2008)
Next, we examine to what extent declines in the divorce rate are due to the changing age distribution versus changes in the rates. We show unstandardized and age-standardized rates from both vital statistics and tax data (Figure 5). Vital statistics show a steady decline in the unstandardized divorce rate over this period, from 12.3 divorces per 1,000 married women to 10.3 divorces per 1,000 married women. However, the age-standardized pattern differs, showing a small increase over the period, from 9.8 in 1991 to 10.3 in 2008. Here we use the 2008 age distribution as the standard; however, the same results hold with another choice of standard. This finding is similar to that of Kennedy and Ruggles (2014; Figure 3); they find that age-standardized rates from vital statistics in the United States show an upward trend in divorce but that the unstandardized rates from vital statistics show a downward trend starting in the 1980s. Trends from tax data show that both unstandardized and standardized rates show a decline in divorce between 2008 and 2016.
Figure 5: Comparison of unstandardized and age-standardized divorces per 1,000 married women using vital statistics (1991‒2008), tax data (1994‒2015)
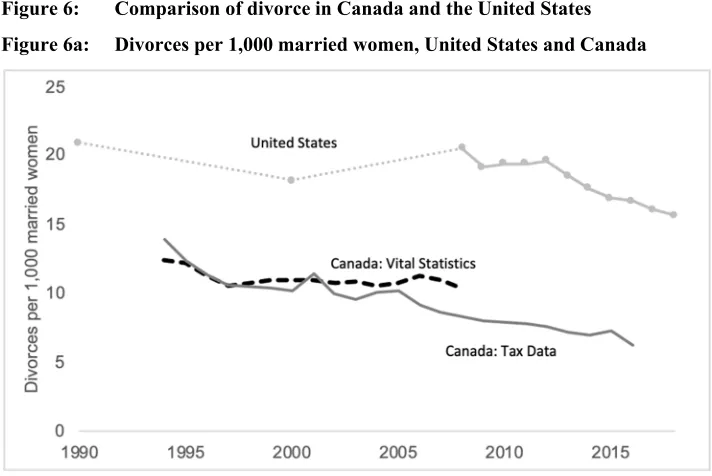
Last, we compare the level of divorce and recent trends to those in the United States. Figure 6a compares the divorce rate from our two data sources with that from the United States. From this figure, we can see that the overall trends in divorce rates over this period are similar in the United States and Canada. However, from the late 1990s onward, the divorce rate in Canada is about half as high as in the United States. Figure 6b examines Canadian age-specific divorce rates and those published by Brown and Lin (2012) on the “gray divorce revolution.” Their paper finds that divorce rates for the 50-plus population doubled in size, from 4.87 to 10.05 per 1,000 married persons. Our results, which also include both men and women, find that the comparable increase in Canada is from 4.02 to 5.17 divorces per 1,000 married persons. We document a much more modest increase in divorce among older adults of about 25% between 1991 and 2008. Moreover, our results from Figure 4b, which examines age-specific divorce rates for the period 2007‒2016, find no further increases in divorce for middle-aged or older adults.
Figure 6: Comparison of divorce in Canada and the United States Figure 6a: Divorces per 1,000 married women, United States and Canada
Figure 6b: Divorce rates for adults aged 50 and above in the United States and Canada (“gray divorce”)
Data: Canadian vital statistics; US data are from Brown and Lin (2012). Note: Estimates for both countries include both sexes.
5. Discussion
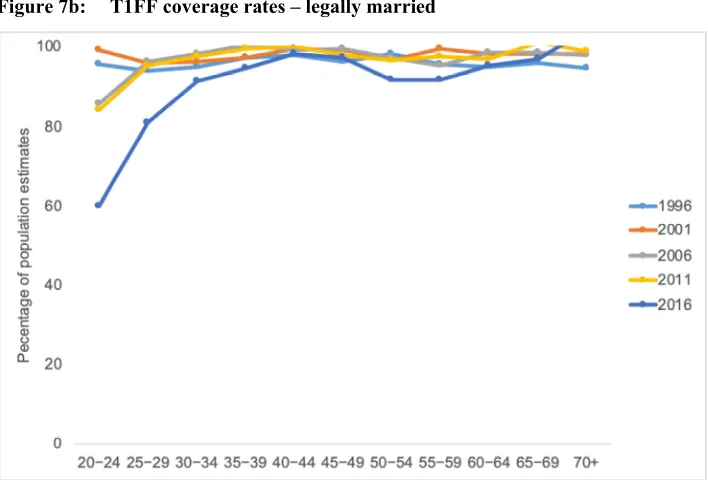
censuses since 1996 (1996, 2001, 2006, 2011, and 2016) by age to examine whether the concordance of self-reported marital status is comparable over time (Figures 7a and 7b). We found that coverage rates of divorced people in the tax data compared to the census are declining over time for all age groups below age 70 and that coverage rates for divorced people are lowest for younger adults. For example, for adults aged 20 or older, the tax data captured 90% of divorced people in the census in 1996, but in 2016 that number had declined to 66%. For adults aged 25‒29 and 35‒39, the tax data captured 79% and 94% of divorced people in the 1996 census; this fell to 35% and 45% in 2016. This is potentially very problematic because we may increasingly underestimate divorce in the tax data over time. Also, it becomes unclear how much of the decline in divorce in recent years is due to a decline in data quality.
Figure 7a: T1FF coverage rates – divorced (not living common law)
Figure 7b: T1FF coverage rates – legally married
Notes: Population estimates come from Statistics Canada’s estimates of population as of July 1, by marital status or legal marital status, age, and sex; retrieved fromhttps://www150.statcan.gc.ca/t1/tbl1/en/tv.action?pid=1710006001. For population estimates, “legally married” is defined as the sum of those married and those separated (not living common law).
There are some limitations of this analysis that leave room for future work. This paper did not examine all aspects of union dissolution. Nonmarital cohabitation has become more common and more similar to marriage, especially in the province of Quebec. However, even with the rise of cohabitation, it is still important to measure formal unions and their dissolution. The tax data do offer the opportunity to study trends in the formation and dissolution of cohabitation, and the characteristics of persons in those unions. One limitation is that the tax data capture only unions that span the end of a tax year. This is, of course, also a limitation of tax data for marriage and divorce, but it is likely that there are more short-lived cohabitations than marriages. Second, our analysis focused on national trends in divorce. A full analysis for each of Canada’s ten provinces and three territories is beyond the scope of the paper. However, we did conduct additional analysis for the province of Quebec and the rest of Canada, since Quebec stands out as the most different in terms of the high proportion of cohabiting unions and the fact that most fertility in Quebec takes place in nonmarital unions while the rest of Canada looks much different. In Part 2 of the Appendix, we plot divorce rates measured with tax data and vital statistics for the province of Quebec and the rest of Canada, and we find that levels and trends across the two data sources are quite similar overall. In the mid-1990s, the two data sources are more similar for the rest of Canada than for Quebec, but from the late 1990s onward, the two data sources actually match better in Quebec than in the rest of the country. Last, we did not present comparable analysis for men here. However, that can be done in a separate analysis.
Where do we go next to estimate divorce in Canada? There are important limitations in relying on tax data for the estimation of divorce – issues regarding data quality and its potential decline in recent years. We recommend adding questions about marriage and divorce in the last year to a large annual survey with a high response rate, such as the Labour Force Survey. Similar recommendations were also made in a recent op-ed in theGlobe and Mail (Globe and Mail 2019). Accurately measuring divorce is an important task in an era where changes in marital status have important implications for poverty and income trajectories, physical and mental health, living arrangements, and need for services. Given the important changes occurring within family life and the increasing number of divorced older adults, data on formal union dissolution is necessary.
6. Acknowledgments
References
Allred, C. (2019). Divorce rate in the U.S.: Geographic variation, 2018.Family Profiles
23(201). Bowling Green, OH: National Center for Family and Marriage Research (NCFMR).doi:10.25035/ncfmr/fp-19-23.
Beaujot, R. (2009). Notes from committee meeting. (November 12‒13, 2009)
Bérard-Chagnon, J., Laflamme, N., and Ménard, F. (2018). Étude de la correspondance de l’état matrimonial de fait entre les données administratives et les données censitaires. Statistics Canada Report.
Brown, S.L. and Lin, I.F. (2012). The gray divorce revolution: Rising divorce among middle-aged and older adults, 1990–2010.The Journals of Gerontology: Series B67(6): 731‒741.doi:10.1093/geronb/gbs089.
Cherlin, A.J. (2004). The deinstitutionalization of American marriage. Journal of Marriage and Family66(4): 848‒861.doi:10.1111/j.0022-2445.2004.00058.x. Corak, M. (2001). Death and divorce: The long-term consequences of parental loss on
adolescents.Journal of Labor Economics 19(3): 682‒715.doi:10.1086/322078.
Elliott, D.B., Simmons, T., and Lewis, J.M. (2010). Evaluation of the marital events items on the ACS (U.S. Census Technical and Analytic Reports on the American Community Survey). Washington, D.C.: U.S. Census Bureau.
Globe and Mail (2019). Marriage, divorce data missing from Canada’s social picture. January 29, 2019.
Kennedy, S. and Ruggles, S. (2014). Breaking up is hard to count: The rise of divorce
in the United States, 1980‒2010. Demography 51(2): 587‒598.
doi:10.1007/s13524-013-0270-9.
LaRochelle-Côté, S., Myles, J., and Picot, G. (2012) Income replacement rates among Canadian seniors: The effect of widowhood and divorce. (Statistics Canada Catalogue 11F0019M. Ottawa: Analytical Studies Branch Research Paper Series 343).doi:10.2139/ssrn.2094457.
Le Bourdais, C., Jeon, S.H., Clark, S., and Lapierre-Adamcyk, É. (2016). Impact of conjugal separation on women’s income in Canada: Does the type of union matter?Demographic Research35(50): 1489‒1522.doi:10.4054/DemRes.2016. 35.50.
Milan, A.M. (2013). Marital status: overview, 2011: Report on the Demographic Situation in Canada. Ottawa: Statistics Canada. (Component of Statistics Canada Catalogue 91-209-X)
Schoen, R., Astone, N.M., Kim, Y.J., Rothert, K., and Standish, N.J. (2002). Women’s employment, marital happiness, and divorce. Social Forces 81(2): 643‒662.
doi:10.1353/sof.2003.0019.
Statistics Canada (1992). 1991 Census dictionary. Ottawa: Statistics Canada. (Catalogue 92-301E).
Statistics Canada (1998a). Report on the demographic situation in Canada, 1996.
Ottawa: Statistics Canada. (Catalogue 91-209-XIE).
Statistics Canada (1998b). Report on the demographic situation in Canada, 1997.
Ottawa: Statistics Canada. (Catalogue 91-209-XIE).
Statistics Canada (1999). Report on the demographic situation in Canada, 1998 and 1999.Ottawa: Statistics Canada. (Catalogue 91-209-XIE).
Statistics Canada (2001). Report on the demographic situation in Canada, 2000.
Ottawa: Statistics Canada. (Catalogue 91-209-XIE).
Statistics Canada (2005). Annual demographic statistics. Ottawa: Statistics Canada. (Catalogue 91-213-XIB).
Statistics Canada (2006). Report on the demographic situation in Canada, 2003 and 2004.Ottawa: Statistics Canada. (Catalogue 91-209-XIE).
Statistics Canada (2008a).Report on the Demographic Situation in Canada, 2005 and 2006.Ottawa: Statistics Canada. (Catalogue 91-209-XIE).
Statistics Canada (2008b). Demographic estimates compendium, 2007. Ottawa: Statistics Canada. (Catalogue 91-213-SCB).
Statistics Canada (2016). Annual income estimates for census families and individuals (T1 Family File): Family data: user’s guide. Ottawa: Statistics Canada. Retrieved from http://www23.statcan.gc.ca/imdb-bmdi/document/4105_D5_T1 _V13-eng.pdf.
Statistics Canada (2018). T1 Personal Master File (T1PMF)/T1 Historical (T1 H) SAMD Analytical Files (2018 Vintage), User Guide and Data Dictionary.
Ottawa: Statistics Canada.
Uhlenberg, P. and Myers, M.A.P. (1981). Divorce and the elderly. The Gerontologist
21(3): 276‒282.doi:10.1093/geront/21.3.276.
Appendix
Part 1: Measuring trends in divorces using the Canadian General
Social Survey
Here we document trends in divorce in Canada using data from the General Social Survey (GSS) cycles on the family and compare them with vital statistics during the period for which they are available. We then discuss the limitations of using the GSS for measuring marital dissolution in Canada.
The GSS is a potential data source to estimate divorce in Canada after published vital statistics stopped including divorce and marriage in 2008. The GSS family cycles include partnership histories of respondents, including their current marital status, number of total marriages, and the start and end dates of two to four marriages, depending on the wave. The GSS is a large-scale data set that is representative of Canada’s ten provinces but not its territories or residents of institutions. We used four cycles of the GSS (1990, 2001, 2011, and 2017). Sample sizes for these waves vary from 13,495 to 24,310.
Using these surveys, we estimated divorce rates for the calendar year before the survey. The divorce rate in calendar year t is measured as the number of divorces granted in yeart divided by the number of legally married women in July of yeart. A divorce in a given year was counted if the divorce or annulment of the marriage occurred during that year. If the year of divorce was missing, then we estimated the date of divorce based on the respondent’s age at divorce and age at the time of the survey. The denominator for the divorce rate is the number of legally married women midyear. We use person weights provided in the GSS data set to calculate population estimates.
Table A-1: Estimated number of divorces, number of legally married women, and divorce rates from the General Social Survey and vital statistics for women aged 20 and older
Data Sources and Years
Statistics Data Source
1989 Estimates from 1990 GSS and 1991 Vital Statistics
2000 Estimates from 2001 GSS and 2000 Vital Statistics
2010 Estimates from 2011 GSS and 2008 Vital Statistics
2016 Estimates from 2017 GSS
Number of divorces [a]
GSS‒ raw 52 77 58 40
GSS‒ weighted 66,071 53,160 47,379 36,833
vital statistics 76,363 70,826 70,378
Number of legally married females [b]
GSS‒ weighted 5,885,551 6,633,658 7,362,379 7,513,933
population
estimates 6,217,212 6,448,796 6,819,179
Divorce rates [a/b*1000] GSS‒ weighted 11.2 8.0 6.4 4.9
vital statistics 12.3 11.0 10.3
Notes: Estimates from both data sources are available for the year 2000, but for GSS cycles from 1989 and 2010, we compare the closest year where vital statistics data are available (1991 and 2008).
Table 2 presents estimates for the number of divorces and divorce rates by age group. The small sample sizes of divorces measured in a given year mean that we cannot generate robust estimates of age-specific divorce rates. Note that estimates are unavailable for older populations (aged 60 and above in 1990 and aged 70 and above in 2011). Moreover, with the small counts, the weights become very important and make the estimates vary greatly. This means that small numbers of divorces in certain age groups can change estimates greatly.
Table A-2: Age-specific divorce rates, in 1990 and 2011 GSS and vital statistics in 1991 and 2008
1989 Estimates from 1990 GSS and 1991 Vital Statistics
Description Data Sources 20‒29 30‒39 40‒49 50‒59 60‒69 70‒79 80+ Number of divorces vital statistics 18,980 31,462 18,386 5,494 1,700 290 51
GSS 15,262 26,479 14,580 9,892 ‒ ‒ ‒
Divorce rates vital statistics 21.9 18.1 12.8 5.6 2.2 0.8 0.7
GSS 17.0 16.2 11.4 10.1 ‒ ‒ ‒
2010 Estimates from 2011 GSS and 2008 Vital Statistics
Description data sources 20‒29 30‒39 40‒49 50‒59 60‒69 70‒79 80+ Number of divorces vital statistics 9,416 21,791 23,654 11,985 2,833 416 283 GSS 7,392 13,917 10,983 10,752 4,218 ‒ ‒
Divorce rates vital statistics 20.6 16.6 13.7 7.6 2.7 0.8 1.7
Conclusions
Part 2
Figure A-1: Comparison of divorce rates (divorces per 1,000 married women), Quebec versus the rest of Canada, with data from vital statistics and tax data