Through User Testing and Iterative
Design
Melissa A. Smith George Mason University 4400 University Drive, MSN 3F5 Fairfax, VA 22030-4422 USA
[email protected] Samuel S. Monfort George Mason University 4400 University Drive, MSN 3F5 Fairfax, VA 22030-4422 USA
[email protected] Eric J. Blumberg George Mason University 4400 University Drive, MSN 3F5 Fairfax, VA 22030-4422 USA
Abstract
The principal focus of this report was to identify practical and correctable problems with the voting process and to mitigate those problems through careful application of human factors techniques. We developed a survey questionnaire to identify issues with the voting process and found that respondents consistently reported that wait times and lines were the greatest barriers to efficient and enjoyable voting. In contrast, few respondents reported difficulty with the voting interfaces themselves. We therefore developed a system to support improved voter organization, specifically focused on conveying relevant logistical information to voters: polling station data, including amenities (e.g., benches, parking) and estimated wait times. We also created an easy-to-use administrator portal for poll workers to update wait-time estimates. We believe that our approach represents a strong example for how usability testing and design can positively affect relevant societal issues.
Keywords
117
Introduction
“Every election is determined by the people who show up.” – Larry J. Sabato, an American political scientist and political analyst
Voting is a fundamental part of American political life, and it is crucial that the voting process progresses with the times. To this end, core components of the voting process have changed in recent years, with many districts moving away from paper ballots and toward gathering votes electronically. Between 2000 and 2012, the number of Americans voting by direct recording electronic (DRE) machines has more than tripled, now accounting for around 40% of the total votes cast (Report of the Commission on Federal Election Reform, 2005). A parallel increase in optical ballot scanning (accounting for 56% of votes) means that the way ballots are being completed and tallied has almost completely changed within only a few decades. As a
consequence, researchers and designers have emphasized ballot design and have made tangible improvements to the user experience of ballots and voting booths.
Although the methods to submit a ballot have changed (potentially improved), a number of aspects of the voting experience have not. These include the logistical aspects of voting: finding a good time to vote, driving to polling stations, and waiting in lines, for example. Notably, the aspects of the voting process preceding the actual ballot-casting represent an area of significant untapped potential for improving the voter experience. Particularly because the number of voters in major elections has increased annually (and is projected to continue increasing relative to population growth; File, 2014), efforts to improve the voter experience will need to look beyond the polling station itself to keep pace with greater numbers of voters. We therefore believe that considering the logistical aspects of the voting experience—with the goal of decreasing wait times in particular—represents an important area for improvement. It is worth noting that some research has proposed Internet-based voting as a potential solution for the long lines involved with in-person voting, either through mobile devices or by home computing. However, a number of critical issues have been identified regarding the security of remote voting, its legality, and potential hurdles facing implementation (Balzarotti et al., 2010; Rubin, 2002; Simons & Jones, 2012). Remote voting procedures may eventually allow us to circumvent current logistical problems (Campbell, Tossell, Byrne, & Kortum, 2014), but it does not stand to provide practical short-term benefits to the process. For this reason, we believe that addressing shortcomings inherent to “in-person” voting stands to yield near-term benefits for efficiency and effectiveness of the voting experience.
We conducted a multi-level usability study to find out more information about pain points within the voting process. We developed a survey (Part I) to gather data from the voting public regarding their perceptions of the voting experience. Results from this survey informed a design process (Part II) aimed at creating a more efficient system to address the logistical aspects of the voting experience, with the final product presented in Part III.
Part I: Survey
This section describes our process for developing a survey to gather data from voters. We wanted to better understand the mindset of users preparing to go through the voting process, their experiences during the process, and how the process itself influences the overall voting experience.
Methods
The following is the list of survey questions. Questions were developed to be open-ended, face valid, and non-leading.
Open-ended questions
o What actions do you take to prepare to vote? (Examples: researching candidates, researching online, etc.)
o What aspects do you enjoy about the voting process? (Specific about the voting process itself.)
o What problems do you encounter? (Specific to the voting process itself.) o How would you fix the voting process?
o What method did you use to vote most recently? (Absentee? Booth? Electronically?)
o In the booth, do you bring anything with you (from home or otherwise) to assist with the voting process?
o Do you receive assistance at any point during the voting process? If so, in what way? (Examples: transportation to voting venue, translation, etc.)
7-point Likert scale questions
o The voting process is convenient.
o Before voting, I am aware of all the issues on the ballot.
o Before voting, I know who/what I am voting for on every question. o I vote on all the issues on the ballot.
Demographics o Age o Gender o Race
o Number of times voted (0, 1-3, 4-6, 7+)
119
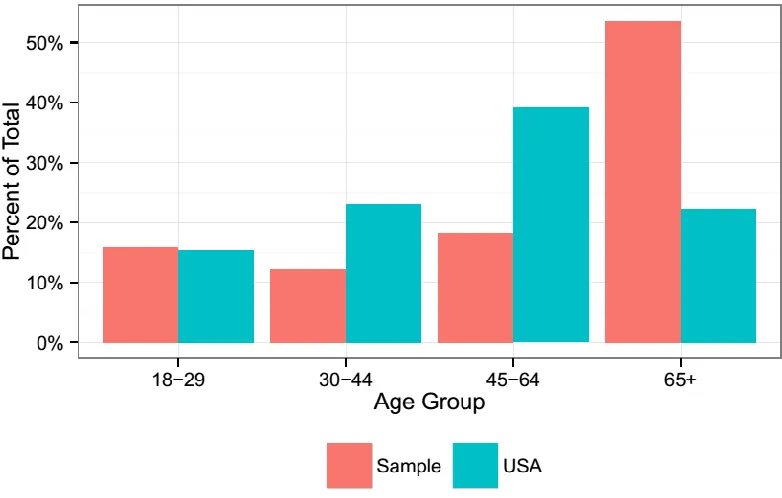
Figure 1. Age groups in our sample compared to population norms.
Results
The survey results indicated that long wait times are the most common source of voter frustration. Almost half (49%; 37/76) of respondents indicated some level of frustration with congestion-related problems (mostly long lines, but also some parking complaints).
Interestingly, only two voters (3%) indicated any frustration with the ballots, and both of these complaints stemmed from perceived slowness of the electronic voting machines. Slow voting machines could be a computing power issue rather than a human factors or design issue. Nevertheless, our participants were significantly more likely to mention wait times as a source of frustration than anything related to ballot functionality, χ2(1,N = 81) = 39.9, p < .001.
Part II: Initial Design
Given the frequency of negative responses pertaining to long lines and wait times (and the nearly complete absence of discontent over ballot design), we focused our efforts on improving the voting experience preceding the casting of the ballot. A focus on reducing wait times is also supported by a large body of existing research. A report released after the 2012 presidential election described some voters who reported waiting in line for more than five hours (Smith, Mulder, & Goodman, 2012). This report also suggested that many jurisdictions were “one equipment failure away from an unacceptably long line” (Willis et al., 2014, p. 38). The threat of long lines does more than simply delay ballots: Some reports suggest that long wait times prevented over 2 million people from voting (Ansolabehere, 2009).
reported changing their voting time by more than two hours between the 2008 and 2012 elections, suggesting that a sizable proportion of individuals are both willing and able to alter the times at which they vote (Willis, et al, 2014). Redistributing 26% of voters (approximately 34 million people) from congested times to less congested ones would have a sizable impact on wait times. Indeed, research suggests that if arrivals of voters were evenly distributed
throughout the day, wait times greater than a few minutes would be “virtually non-existent” (Willis et al., 2014, p. 37). Thus it seems clear that wait times at the polling station are largely attributable to human factors failings in logistics rather than in ballot design.
Given widespread frustration with long wait times, we propose that a central repository for voting line and wait time information could significantly improve the voter experience. We believe that a database that includes peak hours, current estimated wait times, and historical data would facilitate an even redistribution of ballot-casting throughout the day. A system like this could also increase voter turnout by removing the “waiting” barrier to voting. Older adults who are more affected by longer wait times due to physical limitations (e.g., difficulty standing in line) might particularly benefit from such a repository. Importantly, design accommodations for special populations, such as older adults, almost always involve changes that are compatible to the general population as well (Fisk, Rogers, Charness, Czaja, & Sharit, 2012). We therefore began our investigation with an eye toward making changes that would improve voter
experience in general (e.g., reducing voter wait time) as well as making special
accommodations for older voters. We also sought to design an intuitive system that would be easy to use for poll administrators. The iterative design process undertaken for this system is detailed below.
Methods
Based on the results from the survey, we determined that a reliable source of information about voting locations—including information about waiting times—would be a simple, easily
implemented, and practical improvement to the voting experience. To this end, we developed a mockup for an online interface to be the central repository for information regarding wait times, polling station amenities (e.g., wait line seating), historical trends in voting wait times, and polling station parking. Using this repository, voters would be able to find their polling station and obtain relevant information about it.
User Portal: Development
121
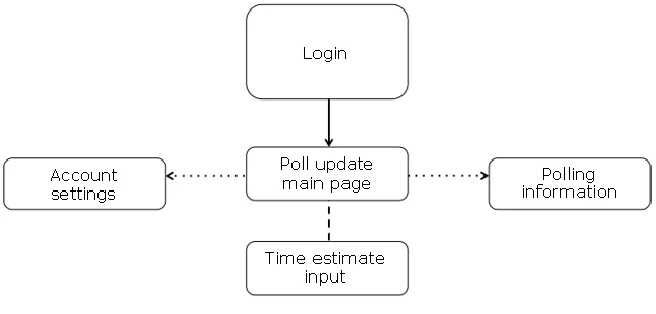
Figure 2. User portal user workflow.
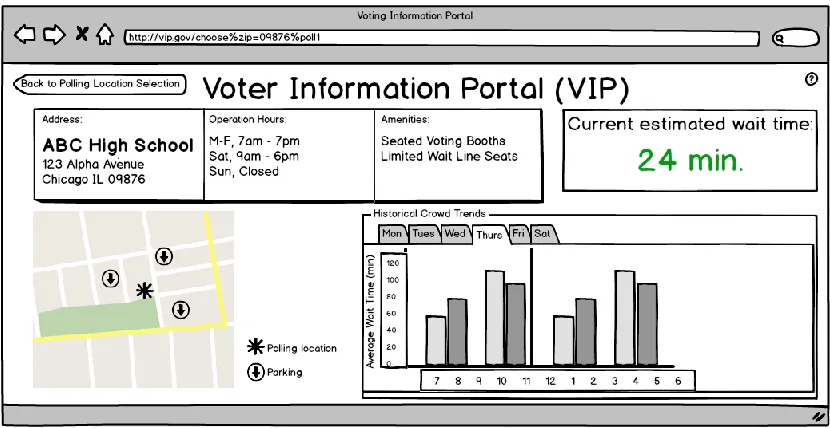
A representative image is shown below (Figure 3). The mockup was created using Balsamiq Wireframing software (www.balsamiq.com). We included certain design and usability elements to meet the needs of the diverse user group that would be accessing this system. For example, fonts were clean (no serifs) and their sizes were no smaller than 12 point, features were scalable, contrast ratio was high, and colors distinct. According to Fisk et al. (2012), such considerations are necessary when designing for older adults, who tend to be the most populous voting demographic.
Figure 3. Example of a poll information page in the tested mockup.
location and to obtain important parking information. There is also a historical trends feature that would detail average wait times by hour and day for previous years’ elections.
User Portal: User Testing
During user testing, we wanted to get feedback about key features such as the current
estimated wait time, the use of color to denote the length of those wait times (green, yellow, or red), the inclusion of amenities, and perceptions of historical crowd trend data. We asked participants to complete representative tasks (e.g., “Please tell me the current waiting time at ABC High School,” or “Does XYZ Library have seated voting booths listed as an amenity?”) while tracking their clicking behavior. After each task we asked for their comments. We also asked people to rate how they felt about the site on a 7-point Likert scale (1 being strongly dislike to 7 being strongly like) and how they believed having access to the site would influence their voting experience (1 being a strong negative influence to 7 being a strong positive influence).
Participants included students from the undergraduate research participant pool, as well as a few faculty members. In all, we recruited 20 participants (16 females, Mage = 21.5 years). User
testing took place over the course of one week and was done in 10-minute, one-on-one sessions.
Administrator Portal: Development
We also created an administrator portal featuring an easy method to input polling location information (e.g., address, hours of operation, number of voting booths) and wait time estimates. This design was again supported by a workflow diagram (Figure 4).
Figure 4. Admin portal user workflow.
123
Figure 5. Administrator portal main interface.
After developing the original administrator portal, we realized that requiring individual administrators to estimate wait times without uniform guidelines might yield wildly varying and/or inaccurate estimates. Therefore, we developed a tool to accurately estimate wait times. This tool is detailed below.
Administrator Portal: User Testing
Willis et al. (2014) found that the average voter takes approximately five minutes to cast a ballot. A line of voters would therefore take five minutes multiplied by the number of voters in that line. We determined through a practical exercise that a 10-foot line segment can contain approximately five voters (see Figure 6 below). Before polls open, workers would simply need to place numbered tape markers on the ground at 10-foot intervals. As voters line up, the poll worker would simply have to note the lowest numbered tape segment visible (uncovered by voters) and enter that into the administrator portal, which would automatically multiply the entered number by 5 minutes (5 minutes x 5 voters = 25 minute wait time).
Figure 6. Determining how many people can fit inside a 10-foot line segment.
Because having more than a single voting booth would decrease the amount of wait time, the formula would take into account the number of available booths. However, a voter simulation conducted by Willis et al. (2014) found diminishing returns for the number of polling stations on voter wait time. For this reason, we tempered the input for the number of stations by
Figure 7. Depiction of the estimated wait time function by number of available waiting booths.
125
After developing the voter and administrator portals, we recruited participants to provide us with hypothetical user feedback. Participants were asked to provide concurrent verbal feedback while executing a series of tasks, including (a) finding their polling station, (b) evaluating wait-time estimates, and (c) checking the station for special amenities. Afterwards, participants were asked to provide open-ended feedback as well as their impression of the system's usability and usefulness (7-point scales).
Results
Overall, the response to the voter information portal mockup site was positive. The mean usability rating of the site was 5.4 (out of a possible 7; SD = .94). The mean rating for
usefulness of the site on the voting experience was 5.9 (again out of 7; SD = 1.2). Additionally, 95% (19/20) of the users completed the sample task in exactly two clicks, which was the minimum number required. Lastly, open-ended feedback elicited from participants often contained references to the site being “clear,” “simple,” and “easy to navigate” (35%, 7/20). That being said, although many people produced positive statements regarding the historical voting trend data (50%, 10/20), a few people were confused by it (10%, 2/20), and some did not even see the need for that feature (25%, 5/20). Some of this may be due to participant fixation on the mockup elements (like the different colored bars), though the feedback gave us good information about how to redesign that feature.
Other useful feedback included commentary about the red, yellow, or green coloring scheme for the estimated wait times. While some people (20%, 4/20) loved the green highlighting on the ABC High School poll page (Figure 3), some people found the red coloring for a time estimate to be discouraging. Although we understand the utility of having wait time estimates displayed in the color range, confusion about what the ideal red, yellow, or green time cutoffs should be and the possibly discouraging impact of seeing a red estimated waiting time made us decide to remove it for the next iteration.
Part III. Final Design
To continue the iterative design process, we incorporated the results from our user testing into a final prototype created in Axure prototyping software (http://www.axure.com/).
User Portal
Figure 9. Poll information page in the final mockup.
Administrator Portal
The administrator portal was designed to be simple and easy to use. Therefore the second iteration required few changes. The primary change was a revision to better incorporate the time estimation formula. Figure 10 is a representative screenshot of the final administrator portal mockup, created using the Axure software.
127
settings to determine if the poll workers will understand the time-estimation procedure and if the system could realistically deal with the varied crowd usage of voting times.
Conclusion
The principal focus of this report was to identify practical and correctable issues within the voting process and to mitigate these problems through an iterative design process. This report also represents a concrete example of how various usability techniques can be harnessed to address pressing societal issues. Through the use of various usability techniques, we determined the key problem areas, namely uncertainty about wait times and long lines, and created a system that would help convey such information to voters, as well as being easy to use and to keep up-to-date for poll workers. Though this was more of an exploratory exercise, we believe that our designs stand to inform how simple changes to the existing voting process can have a significant positive impact on the voting experience.
More information, as well as complete images of the mockups, can be found online at
https://sites.google.com/site/votinginformationportal/home.
Tips for Usability Practitioners
The following tips are for usability practitioners:
Start the design process holistically; don’t eliminate aspects of the problem until you have convincing evidence to do so. For example, polling your user base to identify pertinent needs before beginning the design can shape your focus in potentially unexpected ways. Our survey helped us identify that wait times, not voting booth design, were the area of chief concern.
Make sure to sample the correct population for research and design questions. For instance, people over the age of 45 represent the largest proportion of voters, which is why we made sure to survey people from that demographic in our exploratory survey. Investigate low-tech solutions to problems. We incorporated a practical exercise to
identify how many people would naturally fit lined up within a set space.
Consider how practical the implementation of your designs will be. For example, our study focused on overcoming concrete, realistic problems pertaining to long wait-times. An ideal solution to the frustrations of voting might involve a form of mobile voting platform, but substantial technological and legislative barriers exist to prevent such a solution from being immediately useful.
References
Ansolabehere, S. (2009). Effects of identification requirements on voting: Evidence from the experiences of voters on Election Day. PS: Political Science & Politics, 42(01), 127–130. Balzarotti, D., Banks, G., Cova, M., Felmetsger, V., Kemmerer, R. A., Robertson, W., & Vigna,
G. (2010). An experience in testing the security of real-world electronic voting systems. Software Engineering, IEEE Transactions on, 36(4), 453–473.
Campbell, B. A., Tossell, C. C., Byrne, M. D., & Kortum, P. (2014). Toward more usable electronic voting testing the usability of a smartphone voting system. Human Factors: The Journal of the Human Factors and Ergonomics Society, doi: 10.1177/0018720813519266. Chaparro, A., Wood, J. M., & Carberry, T. (2004, September). Effects of age and auditory and visual dual-tasks on closed road driving performance. In Proceedings of the Human Factors and Ergonomics Society Annual Meeting (Vol. 48, No. 19, pp. 2319–2322). SAGE
Publications.
File, T. (2014). Young-adult voting: An analysis of presidential elections, 1964-2012. U.S. Department of Commerce, Economics and Statistics Administration. Retrieved from
Fisk, A. D., Rogers, W. A., Charness, N., Czaja, S. J., & Sharit, J. (2012). Designing for older adults: Principles and creative human factors approaches. Boca Raton, Florida: CRC press, Taylor & Francis Group.
Report of the Commission on Federal Election Reform. (2005). Building confidence in U.S. elections. Retrieved from http://www.eac.gov/assets/1/AssetManager/Exhibit%20M.PDF Rubin, A. D. (2002). Security considerations for remote electronic voting. Communications of
the ACM, 45(12), 39–44.
Simons, B., & Jones, D. W. (2012). Internet voting in the US. Communications of the ACM, 55(10), 68–77.
Smith, P., Mulder, M., & Goodman, S. (2012). Counting votes 2012: A state by state look at voting technology preparedness. Verified Voting Foundation. Available at
http://countingvotes.org/
Spencer, D. M., & Markovits, Z. S. (2010). Long lines at polling stations? Observations from an election day field study. Election Law Journal, 9(1), 3–17.
The United States Election Assistance Commission. (2005). A summary of the 2004 election day survey, how we voted: People, ballots, & polling stations. Retrieved from
http://www.eac.gov/assets/1/AssetManager/2004%20EAVS%20Executive%20Summary.pdf Willis, J. T., Murphy, B., Cotten, A., Lovegrove, M., McGrath, D., Wells, W., Whiteford, E. M.,
Ford, K. (2014). Voting and the administration of elections in Maryland. Maryland State Board of Elections.
http://www.elections.state.md.us/press_room/documents/Schaefer%20Center%20Final%2
0Report.pdf .
About the Authors
Melissa A. Smith Ms. Smith is a 4th year Human Factors & Applied Cognition PhD candidate at George Mason University. She earned her MA from GMU in 2012 and her BS Psychology degree from the University of Central Florida in 2011. Her research interests include human trust in
automation, eye-tracking, and HCI/product
development.
Samuel S. Monfort
Mr. Monfort is a 2nd year PhD student at George Mason University's Human Factors & Applied Cognition program. He received his MA in Psychology from Wake Forest University and his BS in Psychology from The College of William and Mary. His research interests pertain to human performance in high-stress and dangerous environments, data analysis, and research design.