© 2018, IRJET | Impact Factor value: 6.171 | ISO 9001:2008 Certified Journal | Page 2391
COMPARING THE OPTIMIZIED PROCESS PARAMETERS OF ALUMINIUM
ALLOYS IN DRILLING OPERATION
SHAIK NOOR AHAMED
1, SAKE SUDHAKAR
2, S RAHAMATHULLAH
31,2,3
Assistant Professor, Department of Mechanical Engineering, Gates Institute of Technology, Andhra Pradesh,
India.
---***---Abstract
- Aluminium Metal alloys are the recent trends in the Engineering Materials. Al alloy’s, has major applications such as aviation, automotive, construction etc because of their properties like high strength to weight ratio, hardness, stiffness and corrosion resistance. Here this paper presents an investigation on machining (Drilling) of Al (6082) and Al (7075). Taguchi’s L9 orthogonal array experimentation was used to optimize the parameters of Al-alloy’s. The effect of parameters such as spindle Speed & Drill diameters on Metal Removal Rate and overcut in drilling was calculated. Signal to Noise ratio and ANOVA was used for finding significant parameter. Required comparisons are done between two Al alloy’s. The experiments are conducted using HSS tools under dry condition. A Taguchi analysis is carried out. The effect of parameters is studied and presented.Key Words: strength to weight ratio, spindle speed, drill diameters, Taguchi, ANOVA,
1. INTRODUCTION
Modern materials for in the present scenario for the specific applications, made clear that a quality product at the end is necessary, after performing the machining operations on the work piece. Therefore quality is an important part of production. Machining operations are performed in the process to achieve the required output, so now product’s quality depends on the operations performed on the product. Drilling is the operation performed for hole formation in most applications, as it can give a good surface finish. Volume of metal removed from a cylindrical work piece per unit time is called as metal removal rate. Drilling is a effective method so that it leads to reduced cost and highest production. The cutting tool feeds into the piece and cuts away material in the form of chips to create the desire hole. Problems associated with machining of alloys should be minimized, if these materials need to be used extensively. Here in this paper study of effects of process parameters such as speed and drill diameters on metal removal rate and overcut in turning of Al MMCs is calculated. Taguchi methods are statistical methods developed by Genichi Taguchi to improve the quality of manufactured goods and more recently also applied to engineering.
Design of experiments or Taguchi’s technique is used to complete the objective and generate the optimized value. Here L9 orthogonal array was used for conducting the experiments and ANOVA was employed to analyze the percentage contribution and influence of process
parameters. Taguchi’s technique was found using Minitab 17 software.
2. METHODOLOGY
In this paper, the machining parameters are determined by using Taguchi’s design method. Orthogonal arrays of Taguchi, the signal-to-noise (S/N) ratio, the analysis of variance (ANOVA), and regression analysis are used to get the optimal levels and to analyze the effect of the machining parameters on material removal rate & overcut.
2.1 TAGUCHI METHOD
Taguchi has developed a methodology for the application of factorial design experiments that has taken the design of experiments from the exclusive world of the statistician and brought it more fully into the world of manufacturing [1].Thus the marriage of design of experiments with optimization of control parameters to obtain best results is achieved in Taguchi method. Orthogonal arrays provide a set of well balanced experiments & desired output. [2]
Conventional procedures need more number of experiments to be performed, when more number of parameters increased, this issue is resolved by Taguhci method, it uses special design to study the parameters with small number of experiments. Saving time, cost and finding significant factors at more ease. Taguchi uses the S/N ratio to measure the quality characteristic deviating from the desired value. There are several S/N ratios available, depending on the type of characteristic; lower the better, nominal the best or higher the better.
The S/N ratio for the higher-the-better criterion is given by Taguchi as:
(1)
The S/N ratio for the lower-the-better criterion is given by Taguchi as:
(2)
© 2018, IRJET | Impact Factor value: 6.171 | ISO 9001:2008 Certified Journal | Page 2392 Regardless of the category of the performance
characteristics, a greater S/N value corresponds to a better performance. Therefore, the optimal level of the machining parameters is the level with the great S/N ratio value [10].
2.2 ANALYSIS OF VARIANCE (ANOVA)
ANOVA is a statistical process in which the existence of differences among several population means determined. While the aim of ANOVA is the detect differences among several populations means, the technique requires the analysis of different forms of variance associated with the random samples under study-hence the name analysis of variance. The relative influence of the parameters is measured by total sum of square value (SST) and is given by:
(3)
Where n is the number of experiments in the orthogonal array, ni is the mean S/N ratio for the ith experiment and nm is
the total mean S/N ratio of all experiments.
2.3 REGRESSION ANALYSIS
A statistical tool that allows you to examine how multiple independent variables are related to a dependent variable. Once you have identified how these multiple variables relate to your dependent variable, you can take information about all of the independent variables and use it to make much more powerful and accurate predictions about why things are the way they are. It is also used to understand which among the independent variables are related to the dependent variable and to explore the forms of these relationships. The general form of a multiple regression model is as follows:
Independent variable = b0 + b1 (Independent variable 1) + b2 (Independent variable 2) + … +ε. (4)
Where b1, b2 … are estimates of the independent variables 1, 2 … and ε is the error..
3. EXPERIMENTAL WORK
Sample plates (each 3 numbers) of Al Alloys i.e. 6082 and 7075 were taken with dimensions 6 cm × 6 cm × 1 cm for the experiment. Experiments were conducted on the Vertical Drilling machine, based on Taguchi’s Design of Experiments.
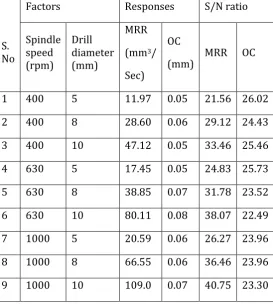
Factors which are controllable are taken as nominal without harming the machine. The factors to be studied and there levels are given in the Table 1. Tool used for machining is HSS. Responses are calculated by changing the factors such as Speed & Drill diameter. Figure 1 & 2 shows the work pieces used in the experiment. Table 2 & 3 shows the Taguchi’s L9 orthogonal array, the measured values of responses & S/N ratios of both Al Alloys.
Metal removal rate: MRR = (π/4) × D2 × F (5)
Where D = diameter of Drill
F = Feed
Over cut : OC = (D1 -D)/2 (6)
Where D = Diameter of Drill
D1= Diameter of hole
after machining
Table -1: Factors and there levels
Factors Level 1 Level 2 Level 3
Spindle speed (rpm) 400 630 1000
[image:2.595.307.581.317.623.2]Drill diameter (mm) 5 8 10
Table -2: L9 orthogonal array for Al-6082
S.
No
Factors
Responses
S/N ratio
Spindle
speed
(rpm)
Drill
diameter
(mm)
MRR
(mm
3/
Sec)
OC
(mm)
MRR OC
1
400
5
11.97
0.05
21.56 26.02
2
400
8
28.60
0.06
29.12 24.43
3
400
10
47.12
0.05
33.46 25.46
4
630
5
17.45
0.05
24.83 25.73
5
630
8
38.85
0.07
31.78 23.52
6
630
10
80.11
0.08
38.07 22.49
7
1000
5
20.59
0.06
26.27 23.96
8
1000
8
66.55
0.06
36.46 23.96
9
1000
10
109.0
0.07
40.75 23.30
Table -3: L9 orthogonal array for Al-7075
S.
No
Factors Responses S/N ratio
Spindle speed (rpm)
Drill diameter (mm)
MRR
(mm3/
Sec)
OC
(mm)
MRR OC
© 2018, IRJET | Impact Factor value: 6.171 | ISO 9001:2008 Certified Journal | Page 2393 2 400 8 27.847 0.07 28.895 23.09
3 400 10 36.521 0.06 31.250 24.43
4 630 5 13.136 0.06 22.369 24.43
5 630 8 46.747 0.07 33.395 21.93
6 630 10 54.742 0.09 34.766 20.91
7 1000 5 23.738 0.07 27.508 23.09
8 1000 8 71.88 0.08 37.132 23.09
[image:3.595.32.309.75.350.2]9 1000 10 102.80 0.08 40.240 21.93
Fig -1: Al-6082 Fig -2: Al 7075
4. ANALYSIS OF EXPERIMENTAL RESULTS
After conducting 9 experiments each on Al 6082 and Al 7075 alloys, the effects of process parameters on metal removal rate and overcut is studied
4.1 ANALYSIS OF SIGNAL TO NOISE RATIO
Metal removal rate and overcut values are calculated by the equations 5 & 6 respectively and there signal to noise ratio values are calculated by the equations 1 & 2 respectively.
4.1.1 METAL REMOVAL RATE
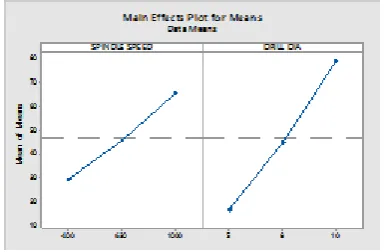
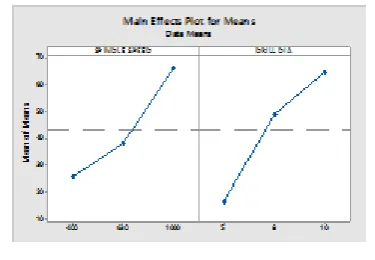
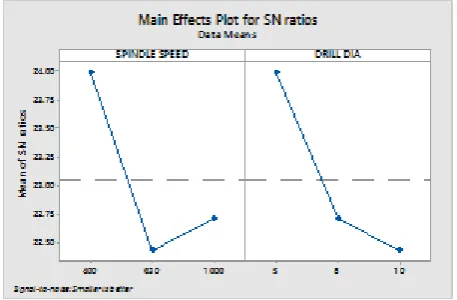
[image:3.595.348.519.279.417.2]The metal removal rate response table for each level of machining parameters (spindle speed & Drill diameters) is obtained and results are presented in Table 4 for Al 6082 and in Table 6 for Al 7075. Chart 2 and 4 shows the effect of process parameters on metal removal rates.
Table -4: Response Table for Signal to Noise Ratios for Al 6082
Level SPINDLE SPEED DRILL DIA
1 28.05 24.23
2 31.57 32.46
3 34.50 37.43
Delta 6.45 13.21
Rank 2 1
Chart-1: Main effects plot for SN ratios for Al 6082
Table -5: Response Table for Means for Al 6082
Level SPINDLE SPEED DRILL DIA
1 29.23 16.67
2 45.47 44.67
3 65.41 78.78
Delta 36.18 62.10
Rank 2 1
Chart-2: Main effects plot for means for Al 6082
Table -6: Response Table for Signal to Noise Ratios for Al 7075
Level SPINDLE SPEED DRILL DIA
1 27.36 23.94
2 30.18 33.14
3 34.96 35.42
Delta 7.60 11.48
[image:3.595.344.537.460.586.2]© 2018, IRJET | Impact Factor value: 6.171 | ISO 9001:2008 Certified Journal | Page 2394 Chart-3: Main effects plot for SN ratios for Al 7075
Table -7: Response Table for Means for Al 7075
Level SPINDLE SPEED DRILL DIA
1 25.63 16.46
2 38.21 48.82
3 66.14 64.69
Delta 40.52 48.23
Rank 2 1
Chart-4: Main effects plot for Means for Al 7075
4.1.2 OVERCUT
[image:4.595.319.550.190.342.2]The overcut response table for each level of machining parameters (Spindle speed & Drill dia) is obtained and results are presented in Table 8 for Al 6082 and in Table 10 for Al 7075. Chart 6 and 8 shows the effect of process parameters on overcut in Al Alloy’s.
Table -8: Response Table for Signal to Noise Ratios for Al 6082
Level SPINDLE SPEED DRILL DIA
1 25.31 25.24
2 23.92 23.98
3 23.75 23.76
Delta 1.56 1.49
Rank 1 2
Chart-5: Main effects plot for SN ratios for Al 6082
Table -9: Response Table for Means for Al 6082
Level SPINDLE SPEED DRILL DIA
1 0.05444 0.05500
2 0.06444 0.06333
3 0.06500 0.06556
Delta 0.01056 0.01056
Rank 2 1
[image:4.595.329.538.373.509.2]Chart-6: Main effects plot for Means for Al 6082
Table -10: Response Table for Signal to Noise Ratios for Al 7075
Level SPINDLE SPEED DRILL DIA
1 23.99 23.99
[image:4.595.66.254.440.570.2]© 2018, IRJET | Impact Factor value: 6.171 | ISO 9001:2008 Certified Journal | Page 2395
3 22.71 22.43
Delta 1.65 1.56
Rank 1 2
Chart-7: Main effects plot for SN ratios for Al 7075
Table -11: Response Table for means for Al 7075
Level SPINDLE SPEED DRILL DIA
1 0.06333 0.06333
2 0.07667 0.07333
3 0.07333 0.07667
Delta 0.01333 0.01333
Rank 1 2
Chart-8: Main effects plot for means for Al 7075
4.2 ANALYSIS OF VARIENCE
4.2.1 METAL REMOVAL RATE
[image:5.595.47.276.177.327.2]Table 12 and 13 shows the ANOVA results for MMR in Al 6082 & Al 7075 respectively. During machining of ALLOYS, each factor has its own significance on the MMR. Darkened values in tables show their respective effects in percentage wise. Results show Drill dia is the parameter which affects more in both Al Alloys.
Table-12: ANOVA for MMR for Al 6082
Source DF SS MS
F-valu e
Pr
(%)
Spindle
Speed 2 1970.5 985.3 5.18 29.80
Drill Dia 2 5803.5 2901.8 15.2 77.45
Error 4 761.1 190.3
[image:5.595.41.260.358.494.2]Total 8 8535.2
Table-13: ANOVA for MMR for Al 7075
Source DF SS MS
F-valu e
Pr
(%)
Spindl e Speed
2 2580.3 1290.2 5.18
27.15
Drill
Dia 2 3625.3 1812.7 15.2 72.85
Error 4 820.8 205.2
Total 8 7026.4
4.2.2 CUTTING FORCE
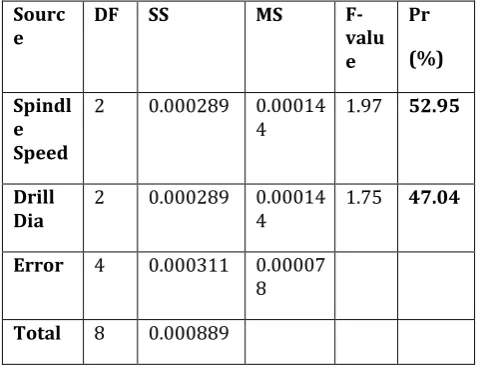
Table 14 and 15 shows the ANOVA results for overcut values in Al 6082 & Al 7075 respectively. During machining of alloys, each factor has its own significance on the overcut. Darkened values in tables show their respective effects in percentage wise. Results shows spindle speed is the effective parameter which effects in both alloys.
Table-14: ANOVA for over cut for Al 6082
Sourc
e DF SS MS F-valu
e
Pr
(%)
Spindl e Speed
2 0.000212 0.00010
© 2018, IRJET | Impact Factor value: 6.171 | ISO 9001:2008 Certified Journal | Page 2396 Drill
Dia 2 0.000186 0.000093 2.29 46.73
Error 4 0.000162 0.00004
1
Total 8 0.000560
Table-15: ANOVA for over cut for Al 7075
Sourc
e DF SS MS F-valu
e
Pr
(%)
Spindl e Speed
2 0.000289 0.00014
4 1.97 52.95
Drill
Dia 2 0.000289 0.000144 1.75 47.04
Error 4 0.000311 0.00007
8
Total 8 0.000889
4.3 REGRESSION ANALYSIS
A correlation between machining process parameters and machining criteria for machining of Al alloys are obtained by multiple linear regressions. MINITAB software package is used to develop these relations or models.
4.3.1 REGRESSION ANALYSIS FOR MMR
Equation below is for Al 6082
MRR = -87.0+ 0.0597 SPINDLE SPEED + 12.18 DRILL DIA (7)
Equation below is for Al 7075
MRR = -77.5 + 0.0683 SPINDLE SPEED + 9.74 DRILL DIA
(8)
4.3.2 REGRESSION ANALYSIS FOR OC
Equation below is for Al 6082
OVERCUT = 0.03383+ 0.000016 SPINDLE SPEED
+ 0.00216 DRILL DIA (9)
Equation below is for Al 7075
OVERCUT = 0.0406+ 0.000014 SPINDLE SPEED
+ 0.00272 DRILL DIA (10)
Table-16: Optimum sequence for MMR in Al 6082
Spindle
speed (rpm) Drill dia (mm)
MRR
mm3/s
1000 10 109.0
Table-17: Optimum sequence for MMR in Al 7075
Spindle
speed (rpm) Drill dia (mm)
MRR
mm3/s
[image:6.595.42.285.215.400.2]1000 10 102.80
Table-18: Optimum sequence for overcut in Al 6082
Spindle
speed (rpm) Drill dia (mm)
OC
(mm)
400 5 0.05
Table-19: Optimum sequence for overcut in Al 7075
Spindle
speed (rpm) Drill dia (mm)
OC
(mm)
400 5 0.06
5. COMPARING Al 6082 AND Al 7075
Comparison between Al alloys is done according to the results obtained in analysis of experiments in this study.
In analysis of SN ratios for MMR, Tables 4 & 6 shows the ranks allotted to the parameters according to their significant effect. A much alike similarity is observed in between them.
Chart 2 & 4 shows the behavior of MMR with respect to process parameters selected and it confirms that major similarity occurs between them.
In analysis of SN ratio for overcut, Tables 8 & 10 shows the ranks of parameters a much alike similarity is observed in between them.
© 2018, IRJET | Impact Factor value: 6.171 | ISO 9001:2008 Certified Journal | Page 2397 In analysis of variance for MMR, from Tables 12 & 13
shows same parameters from both alloys have same impact with some negotiable difference. Here Drill dia is the major parameter which has most impact on MMR.
In analysis of variance for overcut, from Tables 14 & 15 shows same parameters from each side shows same impact, with some negotiable difference. Here spindle speed is the major parameter which has most impact on OC
6. CONCLUSION
This study shows the usage of parameter design in optimization of metal removal rate and overcut of Al alloys in drilling and its application led to opt optimal values. To obtain accurate study, L9 orthogonal array is used in Taguchi method and ANOVA. ANOVA is used to know the accurate contribution of each factor and their percentage in operation. Study shows Taguchi method and ANOVA has same result in Al alloys machining, with minor difference.
Drill dia is the parameter with 77.45% and 72.85% in Al 6082 and Al 7075 respectively which affects the MMR and stood first in rank in Taguchi method. Spindle speed is the parameter with 53.26% and 52.95% in Al 6082 and Al 7075 respectively which affects the overcut and stood first in rank in Taguchi method. Optimal sequence in selected design for MMR and OC is found. Experiments shows that comparison of both Al alloys based on MMR and OC has mere difference and it proved that they can be used at common machining parameters. Taguchi can be used for analyzing similar problems as of this study.
NOMENCLATURE
D = Diameter of Drill
F = Feed
D1 = Diameter of hole after machining
MRR = Metal Removal Rate
OC = Overcut
S/N or SN ratio = Signal to Noise ratio
ACKNOWLEDGEMENT
We are thankful to all the staff and my friends who made our work to be done with more ease.
REFERENCES
[1] Das,S.R., NayakR.P., & Dhupa, D.(December 2012).International Journal of Lean Thinking,3(2).
[2] Mahendra K., & Neeraj A. (October 2012).Optimization of different machining parameters of En 24 alloy steel in
CNC turning by use of Taguchi method. International Journal of Engineering Research and Application, 2(5), 160-164.
[3] Yang, W. H. and Tarng, Y. S. 1998. Design optimization of cutting parameters for turning operations based on the Taguchi method. Journal of Materials Processing Technology, 84: 122-129.
[4] J.Sateesh et all .2003 Optimal Machining Conditions For Turning Of Al SiC Metal Matrix Composites Using ANOVA.
[5] Md. Maksudul Islam et all .2012 Optimization of Metal Removal Rate for ASTM A48 Grey Cast Iron using Taguchi Method.
[6] S. R. Rao and G. Padmanabha. 2014 Optimization of Machining Parameters in ECM of Al/B4C Composites Using Taguchi Method.
[7] Senthilkumar, et all. 2009. Study of electrochemical machining characteristics of Al/SiCp composites. International Journal of Advanced Manufacturing Technology.
[8] S.Noor Ahamed & K Rajesh , Comparing and Optimizing the Process Parameters of two types of Al-MMC’s in Turning, IRJET 2016.
[9] Fortana, M. G. 1986. “Corrosion Engineering”. McGraw-Hill, New York
[10] M. Ramulu, P. N. Rao, H. Kao, Drilling of Al2O3) p/6061 metal matrix composites, Journal of Materials Processing Technology, 124(2002)