REPRODUCIBILITY OF SOIL TEST VALUES OBTAINED BY DIFFERENT FIELD SAMPLING TECHNIQUES I /
G. E. Leggett, D. T. Westermann, and C. G. Painter2-/ ABSTRACT
Single-core soil samples were taken on a grid-pattern in nine fields in southern Idaho. Soil tests for sodium bicarbonate-soluble P and K, and DTPA-extractable Zn indicated wide variability of these elements in most fields. Analyses of composite samples taken from the same areas by two other persons and the single-core averages for each field agreed closely. The single-core average values and the values obtained from composite samples,
while highly reproducible, were not reliable indicators for predicting ferti-lizer needs of the fields because areas testing lor;.7 within the fields were not delineated. An initial intensive sampling, in which single-core samples are taken on a grid pattern and analyzed separately, is needed to determine the fertility variability of a field. Once the variability is established, areas may be selected to monitor soil test changes with time and cropping.
INTRODUCTION
Soil testing is widely used to determine fertilizer needs. Many thousands of samples are analyzed for several elements each year by state and private laboratories. Chemical procedures have been developed for deter-mining indexes related to the nutritional status of various crops grown on different soils. Some of these methods use sophisticated techniques and in-struments that allow rapid and routine determinations of several different elements. Unless the samples analyzed represent the fertility status of the field, however, extreme refinement of chemical procedures and determinations is of little value. Indeed, information derived from nonrepresentative samples may be misleading and result in excessive fertilizer costs, or less than maxi-mum crop yield or quality.
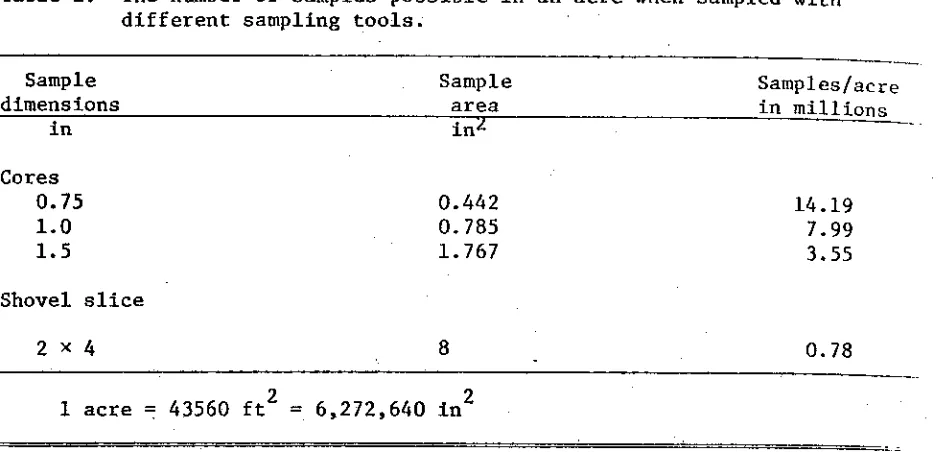
The relationships between soil tests and crop growth and yield are de-veloped on small areas having uniform soil test levels for the element under study. Results from several experimental sites having a range of uniform soil test levels are needed to determine a critical level. Thus, use of soil tests for diagnosis and prediction assumes that the sample to be analyzed came from an area having a uniform soil nutrient level, and that the sample anal-yzed represents the conditions prevailing throughout the field. The diffi-culty in obtaining a reliable composite soil sample becomes obvious from Table 1. For example, sampling a 20-acre field by taking 3/4-inch cores re-quires that 280 be taken to equal 1 ppm of the soil; 28 cores equal only 0.1 ppm of the soil. Rarely is sampling more intensive.
1/
Proceedings, Twenty-Ninth Annual Fertilizer Conference of the Pacific Northwest, Beaverton, Oregon, July 11-13, 1978.
2/
Table 1. The number of samples possible in an acre when sampled with different sampling tools.
Sample dimensions
in
Sample area in 2
Samples/acre in millions
Cores
0.75 0.442 14.19
1.0 0.785 7.99
1.5 1.767 3.55
Shovel slice
2 x 4 8 0.78
1 acre = 43560 ft2 = 6,272,640 in2
A sample usually becomes more representative of a field by taking a Inr,:&:
fraction of the soil volume in the sample, i.e., as more or larger cores an:
taken. Many composite samples, however, are not representative because of tn.
nonuniformity of the nutrient level within the field. When cores are com-posited from areas that range from.high to low in the element of interest, the soil test results reflect an average of all cores taken. Such an averdgc may be meaningless, or may reflect conditions over only a small part of the
field. The importance of good sampling cannot be overemphasized for the simple reason that good results, and hence, good fertilizer recommendations, cannot be made based on values of nonrepresentative samples.
Soil testing results are subject to three main sources of variation: laboratory, seasonal, and field. Of these, field variation is the only one
considered here; our experience and that of others (Cameron, et al., 1971;
James and Dow, 1972) indicate that errors associated with chemical methods
in a well run competent laboratory are minor compared to field sample vari-ation, and since the samples taken for this study were all taken at one time. we are not concerned with seasonal variation.
Our objectives in this study were (a) to determine if reproducible soil
test values could be obtained by different samplers, and (b) to determine tht
variability in nutrient levels among samples from fields that appeared unifor::. METHODS
Sampling Procedure and Sample Preparation
Nine fields ranging in size from 4 to 15 acres were sampled in southern Idaho during late March 1978. A grid pattern was established in each fiel d , and single cores were taken at 100- to 150-foot intervals. From 20 to 27
cores were taken, depending on field size. Composite samples of 10 and 20 cores each were taken from within the grid by two other persons. These
samples were taken according to the sampler's own ideas as to the best waY .
to sample each area. All cores were 3/4 inch in diameter and taken to a a°"'
The samples were dried rapidly in a forced draft drying chamber at 50° C and crushed to pass a 2-mm stainless steel sieve. The grinder was made of stainless steel and was designed to avoid crushing primary particles.
Chemical Determinations
The samples were analyzed for sodium bicarbonate-soluble P and K (Olsen, et al., 1954), and for DTPA-extractable Zn (Lindsay and Norvell, 1969).
RESULTS
The soil test results for the single-core samples, along with statisti-cal evaluation for each field, are given in Table 2. The fields were highly variable for all elements tested as indicated by the ranges, the coefficients of variation (CV), and the confidence limits (L95 ). All of the fields had been fertilized with Zn and K. Topsoil removal by erosion or cutting and filling in land leveling was probably the major factor contributing to the variation. The distribution of the single-core soil test levels is shown in Table 3. Critical levels of 10, 100, and 0.6 ppm were used for P, K, and Zn, respectively. Cores from four of the fields had P levels lower than 10 ppm. One field had K values lower than 100 ppm, and two fields had Zn values less than 0.6 ppm. Single-cores for two fields (E, F) showed soil
tests lower than the critical levels for more than one element. Field E had single-core soil tests that were low in P and K, but they were usually not for the same cores. Most cores in field F were low in P and Zn.
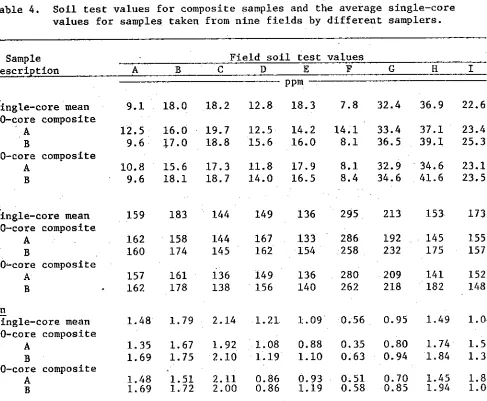
The mean values for the single-core samples are compared with the values for the 10- and 20-core composite samples in Table 4. If one assumes that the means of the single-core samples represent the field average, the com-posite samples estimated the average for the field reasonably well, although there were some discrepancies. Even the 10-core composite samples gave values that were surprisingly close to the single-core means. Only two high P values (fields D and F), and two high Zn values (field I) differ-ing from the sdiffer-ingle-core means by more than the 95 percent confidence in-terval (L95) are shown for the 10-core composite samples. All K values were within these limits. The confidence limits computed from the single-core values indicate that a composite sample taken similarly would give a soil test value within ± L95 of the field mean 95 percent of the time. The
20-core composite samples gave values within ± L 95 for P and K on all fields, but were somewhat less reliable for Zn. Although values for samples taken by different samplers differed somewhat, no consistent trend was evident for any of the elements determined. None of the differences between samplers noted were significant at the 5 percent probability level.
In Table 5, fertilizer recommendations based on the single-core samples and the composite samples are compared. The single-core samples indicated
fertilization was needed when any single-core value for that element was below the critical-level, even though it represented only a small area.
Re-sults of the composite samples agreed closely with the means of the
single-core samples for P. They failed, however, to predict small areas needing P and K in field E, and Zn in field G. Based on the single-core values,
only one-tenth of field E required K, but 30 percent of field G required Zn.
-156-Table 2. Soil test mean and variations in nine southern Idaho fields sampled by single cores on a grid pattern.
Field Size Nutrient core meanSingle Range variationCoef. of n-1/ L.95-2/
acres PPm PPm PPm
A 7 P 9.1 3.4- 16.6 48 21 4.2
K 159 120 -182 11 3 16
Zn 1.48 0.7- 2.4 34 28 0.48
B P 18.0 10.5- 23.8 21 16 3.6
K 183 135 -246 18 11 31
Zn 1.79 1.3- 2.3 5 9 0.27
C 4 P 18.2 13.0- 26.6 18 11 3.1
K 144 113 -197 14 4 19
Zn 2.14 1.3- 2.8 21 22 0.43
15 P 12.8 6.3- 18.3 26 11 2.7
K 149 115 -224 19 8 23
Zn 1.21 0.7- 2.1 30 14 0.30
E 7 18.3 6.6- 27.1 28 30 5.1
K 136 87 -220 22 10 29
Zn 1.09 0.7- 1.6 26 9 0.28
F 5 P 7.8 2.3- 20.4 39 10 2.9
K 295 200 -465 21 44 60
Zn 0.56 0.26- 1.7 62 13 0.33
G 10 P 32.4 14.4- 55.6 32 116 10.1
K 213 131 -300 26 33 53
Zn 0.76 0.46- 1.44 37 9 0.29
H 5 P 35.2 15.8- 49.9 28 109 9.8
K 152 104 -235 21 11 30
Zn 1.49 0.9- 2.3 26 16 0.37
I 5 P 22.6 16.8- 32.2 16 15 3.5
K 173 112 -231 18 11 30
Zn 1.04 0.6- 1.5 25 8 0.25
1/ n equals the number of cores required in future samplings for the values
to lie within 2, 20, or 0.2 ppm of the mean for P, K, or Zn, respectively.
2/
-157-Table 3. Distribution of single-core samples according to soil test for nine fields.
Soil test level
PPm
No. cores in fields having various soil test levels
A B C D E F G H
< 5 3 0 0 0 0 4 0 0 0
5-10 11 0 0 6 1 12 0 0 0
10-15 3 4 3 11 3 5 1 0 0
> 15 4 17 18 10 16 0 19 21 21
K
< 100 0 0 0 0 2 -0 0 0
100-125 2 0 3 4 6 0 0 2 1
125-150 3 3 11 12 7 0 5 10 2
150 16 . 18 7 11 5 21 15 9 18
Zn
< 0.6 0 0 0 0 0 16 6 0 0
0.6-1.0 4 0 0 8 9 3 9 9 11
> 1.0 17 21 21 19 11 2 5 12 10
Table 4. Soil test values for composite samples and the average single-core values for samples taken from nine fields by different samplers.
Sample description
Field soil test values
D E F
p PPm
Single-core mean 9.1 18.0 18.2 12.8 18.3 7.8 32.4 36.9 22.6
10-core composite
A 12.5 16.0 19.7 12.5 14.2 14.1 33.4 37.1 23.4
B 9.6 17.0 18.8 15.6 16.0 8.1 36.5 39.1 25.3
20-core composite
A 10.8 15.6 17.3 11.8 17.9 8.1 32.9 34.6 23.1
B 9.6 18.1 18.7 14.0 16.5 8.4 34.6 41.6 23.5
K
Single-core mean 159 183 144 149 136 295 213 153 173
10-core composite
A 162 158 144 167 133 286 192 145 155
B 160 174 145 162 154 258 232 175 157
20-core composite
A 157 161 136 149 136 280 209 141 152
B 162 178 138 156 140 262 218 182 148
Zn
Single-core mean 1.48 1.79 2.14 1.21 1.09 0.56 0.95 1.49 1.04
10-core composite
A 1.35 1.67 1.92 1.08 0.88 0.35 0.80 1.74 1.57
B 1.69 1.75 2.10 1.19 1.10 0.63 0.94 1.84 1.33
20-core composite
A 1.48 1.51 2.11 0.86 0.93 0.51 0.70 1.45 1.89
-158-Table 5. Fertilizer recommendation for P, K, and Zn based on different soil samples taken from nine fields in southern Idaho.
Soil 1/
samples-Fertilization as indicated from different soil samples Field sampled
A B C D E
Single cores
Single-core mean
Composite samples A10
A20 B10 B20
P - - P P, K P, Zn Zn
- P, Zn
_ _ _ _ Zn
_ - _ - P, Zn
P - - _ - P
P - _ _ P, Zn
11 Single cores: Chemical symbol indicates soil test for at least one core was below critical level.
Single-core mean: Chemical symbol indicates average soil test was below critical level.
Composite samples: Chemical symbol indicates soil test on 10- or 20-core samples taken by samplers A and B were below critical level.
future samplings to obtain soil tests that lie within prescribed limits of the initial mean value can be calculated. In the formula, n is the number of cores, t o is student's "t" value, s 2 is the variance calculated for the initial sampling, and D is the maximum difference desired between the soil tests for the initial and subsequent samplings. We used "t" at the 5 percent
probability level. Thus, n is the number of cores required in repetitive
sam-plings to obtain soil test values within the prescribed limits 95 percent of
the time. The concept of the formula was tested using the soil test values for the composite samples. As shown in Table 2, n is the number of cores needed for the soil tests for P, K, and Zn where the prescribed limits for D are 2, 20, and 0.2 ppm for P, K, and Zn, respectively. Of the nine fields sampled, 20 cores per field adequately reflected the field mean within the prescribed limits except for P on fields A, E, G, and 11; K on fields F and G; and Zn on fields A and C. Field D was the largest field sampled (15 acres); yet, based on the grid sampling, a composite of 20 cores adequately reflected the field mean for all three elements.
DISCUSSION
-159-It is surprising that relatively few cores, taken in a somewhat random fashion
or on a grid pattern from highly variable fields,yield soil samples that give reproducible soil test values. Cameron, et al. (1971) showed that the number of cores required to adequately measure the field mean did not increase dras-tically with field size. They sampled one 99-acre field taking 1040 single cores on a grid pattern and found the variation was no greater than on
20-to 30-acre fields. It seems that the main requirement for obtaining
repro-ducible composite samples from variable fields is to make sure that the sample contains cores that represent all kinds of variation in the field and in pro-portion to the areas involved.
Despite the reproducibility of tests run on composite samples from the same field, the major problem is that of using the test results to predict fertilizer needs. The soil variability in a field may vary so widely that an average soil test determined from a composite sample will not adequately indicate the fertility conditions. The P results for field D shown in Table 3 illustrate this point very well. The single-core mean for this field was 12.8 ppm P and the 20-core composites averaged 12.9 ppm P. All of
these values are above the critical level, thus indicating P fertilization was not needed. The single-core average as shown in Table 4, however, was made up of 6 values below 10 ppm P, 11 ranging from 10 to 15 ppm, and 10 greater than 15 ppm. The low values were not scattered at random, but occur-red together near the center of the field. Such fertility patterns are common
(James and Dow, 1972). If the variability in this field were not known, and no P fertilizer was applied, as indicated by the test on the composite samples, crops grown on 22 percent of the field would likely yield less than maximum. If, on the other hand, the field were known to be variable, but low P areas were not defined and it was arbitrarily decided to apply P uniformly to take care of the low P spots, most crops grown on 75 percent of the field would not have benefited from the added P. If such a decision as this were made, then why soil test?
Fields B, C, H, and I also showed a great. deal of variability for the three elements (Tables 2 and 3). Nothing practical can be done about the
variability in these fields because all values for all elements determined
are high. Determining the variability of fields such as this might not im-prove the present year's fertilization practices, but the information could be used in the future. Dow (1974) proposed a method for taking into account
the fertility variability in fields by first sampling the field on a grid
pattern and then, on the basis of the fertility pattern, establishing moni-toring sites whereby soil test levels could be followed in subsequent years without having to repeat the intensive sampling of the entire field. If areas that test low can be fertilized separately or given different rates, eventually uniformity can be attained. Such a soil testing scheme requires taking and analyzing a great many samples for the initial sampling. If such a scheme were adopted, soil testing fees would have to be adjusted to make it economically feasible for growers and laboratories. Dow and James (1973) have indicated such a fee schedule for Washington State University.
SUMMARY
-160-each field the average soil test values for the single-core samples and the values for the composite samples generally agreed closely, but that because of fertility variability in the fields, composite samples and single-core averages were not reliable for predicting fertilizer needs, except in some fields that tested high for all three elements.
The values for the single-core samples showed that fertility varied widely within all fields sampled. Similar nonuniformity probably exists in most fields of the area. Only by intensive sampling procedures can low or high fertility areas in fields be determined and fertilized separately. Once the variability pattern is determined, sampling sites can be selected for monitoring soil nutrient levels and determining fertilizer needs for future crops.
LITERATURE CITED
1. Cameron, D. R., M. Nyborg, J. A. Toogood, and D. H. Laverty. 1971.
Accuracy of field sampling for soil tests. Can. J. Soil Sci. 51:165-175.
2. Dow, A. I. 1974. Principles of soil sampling for Northwest agriculture. Proc. 25th Ann. Fert. Conf. Pac. N.W. 25:115-126.
3. Dow, A. I., and D. W. James. 1973. Intensive soil sampling. Wash.
Agr. Expt. Sta. Bull. 781.
4. James, D. W., and A. I. Dow. 1972. Source and degree of soil variation
in the field. Wash. Agr. Expt. Sp.' Bull. 749.
5. Lindsay, W. L., and W. A. Norvell. 1969. Development of a DTPA
micro-nutrient soil test. Agron. Abstr., p. 84.
6. Painter, C. G., F. P. Parks, and W. L. Thiessen. 1969. Variation of extractable nutrients within a field as measured by soil and plant analyses. Idaho Agr. Res. Frog. Rep. No. 144, 12 p.