Volume 2, Issue 6, June 2013
Page 142
ABSRACT
Heavy metals are in various industries due to technological importance and waste water from these industries include metal ions having a permanent toxic effect. Biotechnology has been investigated as an alternative method for treating the metal containing waste water of low concentration. The aim of the study is to examine the possibility of using green algae to biologically remove chromium of low concentration waste water. Preliminary investigations will be carried out to find out the range of process variables: contact time, adsorbent dosage, initial metal concentration, pH of the solution at which reasonable amount of metal will be adsorbed on the adsorbent. Kinetics and equilibrium studies will be carried out to find out the order of kinetics and the suitable adsorption isotherm, respectively.
Keywords: Biosorption, Chromium, Green algae, Kinetics, Adsorption Isotherms.
1. INTRODUCTION
Water pollution is by various toxic substances, chemicals, thermal pollution etc. It causes ecological imbalance. Water pollution because of heavy metals (chromium VI) is of major concern now-a-days, as it is affects the environment and leading to increase in environmental pollution[2]. It mainly affects the aquatic ecosystem. Aquatic system is under increasing stress because of increase in population, technological development, urbanization and economic growth. Aquatic organisms are under high risk of contamination. Increased urbanization and the drinking water demand in areas of industrial activity have increased the attention paid to this problem metal. Improper handling and or discharge into local sewers and the environment creates the potential for contamination of drinking water sources.
The presence of chrome in potable drinking water sources has the potential to cause damage to liver, kidney, circulatory and nerve tissues and skin irritation from long-term exposures at levels above the Maximum Contaminant Level (MCL).Chromium (VI) is more toxic than the other forms. It is toxic even if it is present in lower concentrations i.e. in the range of 0.1 – 10 mg/L. According to the Indian Standards[3], the permissible limit of Cr(VI) is 0.05 and 0.1 mg/L for portable and industrial discharge water respectively.
Various conventional techniques like reverse osmosis, electrodialysis, ultrafiltration, chemical precipitation etc. Various other techniques like ion-exchange, phytoremediation, chemical reduction, xanthate process [10], solvent extraction, membrane process, evaporators, cementation, and electrodeposition. The disadvantages of conventional processes are i) expensive ii) not eco-friendly iii) dependent on the concentration of waste. To overcome these disadvantages we have newer technologies like biosorption [8].
Biosorption processes, defined as the sorption of the metal ions by biomass, are being employed as an alternative technique for the decontamination of the industrial effluents and for the recovery of the retained metals [9].Different types of biomass have been used for the clean-up of industrial effluents, such as: algae, bacteria, fungi and yeasts[6] or even extracellular material as exopolysaccharides [7]. Modeling the equilibrium data in terms of adsorption isotherms is crucial for designing the industrial biosorption process equipment. To examine the relationship between sorbed metal concentration (qe) and aqueous concentration at equilibrium, isotherms like Langmuir and Freundlich are widely used
[4,5]. In this paper we have studied the capability of green algae as the biosorbent for the biosorption of chromium (VI) and optimized the process parameters like contact time, pH, adsorbent dosage, metal concentration.
2. MATERIALS AND METHODS BIOSORBENT PREPARATION:
The green colored marine algae was used in the present study. It was collected from the Visakhapatnam beach. The collected algae were was deionized water several times to remove impurities. The washing process continued till the wash water contained no dirt. The washed algae was then completely dried. The dried algae was then powdered using domestic mixer. In the present study the powdered materials of uniform particle size were then directly used as sorbents without any pre-treatment. The processed algae equivalent to 0.5g dry weight was added to 100ml of an aqueous solution of chromium (pH 2.0 adjusted with HCl) of required concentration. The concentration of the unabsorbed chromium was determined spectrophotometrically at 540nm using diphenylcarbazide reagent. The effect of several
Optimization Of Process Parameters For
Biosorption Of Chromium Using Green Algae
V.Gayatri Valli1, G.H.Rao2, V.Sridevi3, K.V.Keerthi4
1
M.Tech, Center for Biotechnology, Dept of Chemical Engineering, Andhra University, A.P, India,
2
Professor, Department of Chemical Engineering, ANITS
3
Associate professor, Dept of Chemical Engineering, Andhra University, A.P, India,
4
Volume 2, Issue 6, June 2013
Page 143
parameters such as contact time, pH, adsorbent dosage, metal concentrations on adsorbtion is studied. The pH of the chromium aqueous solution is adjusted using HCl/ NaOH.Preparation of metal solutions :
Metal concentrations are prepared by dissolving in potassium dichromate and in double distilled water to get metal concentrations of 5, 10, 15, 20, 25 mg/L. A stock solution of 1000 mg/L was prepared and all other concentrations were obtained from it. To the stock solution add 5ml of nitric acid(1:1).
BIOSORPTION EXPERIMENT:
Different concentrations of biomass were combined with 100ml of metal solution in 250ml conical flask. The flasks were placed on a shaker with a constant speed of 150 rpm and left to equilibrate. Samples were collected at predefined intervals, centrifuged at 5000g for 2min and the amount of metal in the supernatant was determined spectrophotometrically at 540nm using diphenylcarbazide reagent.
ANALYTICAL ESTIMATION OF CHROMIUM :
A 0.25% w/v solution of diphenylcarbazide was prepared in 50% acetone. 15ml each of the sample solutions, containing various concentrations of Cr (VI) were pipette out into 25ml standard flasks. To this 2ml of 3M H2SO4, was
added followed by 1ml of diphenylcarbazide and the total volume was made up to 25ml using deionized, double distilled water. Chromium concentration estimated by the intensity of colour complex formed was measured using UV-visible spectrophotometer. The absorbance was measured against a reagent blank at maximum wavelength of 540 nm. A linear plot was obtained indicating adherence to the beer Lambert’s law in the concentration range was studied.
3. RESULTS AND DISCUSSION
In the present study green algae was used for the biosorption of chromium. The parameters affecting the biosorption were studied. The effect of each parameter was discussed below
.
Effect of contact time:
The adsorption experiments of biosorption capacity increased with increase in time. The equilibrium time was 30 min.chromium were carried out for different contact times with fixed adsorbent dose of 5 g/L, initial metal concentration of 50 mg/L, pH at 2.0 and at a temperature of 37°C. The results were plotted in Figure1.
Figure 1 : Effect of time on % removal of Chromium
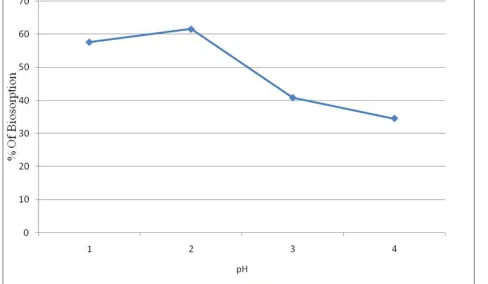
Effect of pH:
The pH value of the solution is an important factor that controls the biosorption of chromium. Figure 2 shows the pH of highest biosorption capacity at 2.0. with the increase in the pH there was gradual decrease in the pH was observed.
Volume 2, Issue 6, June 2013
Page 144
Effect of adsorbent dosage:As shown in Figure 3, to achieve maximum biosorption capacity for the biosorbent of chromium the adsorbent dosage was varied between 1 to 7 g/L and it was found that a concentration of 5 g/L was sufficient for the maximum biosorption of chromium.
Figure 3 : Effect of adsorbent dosage on % removal of Chromium
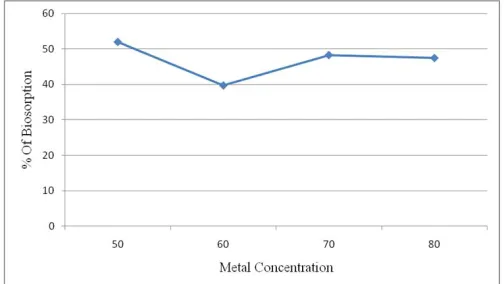
Effect of metal concentration :
As shown in Figure 4, the effect of metal concentration was studied by varying metal concentrations from 50 to 80 mg/L with fixed adsorbent dosage of 5 g/L, contact time of 30 minutes and pH at 2.0. it was found that with increase in the metal concentration there was increase in the biosorption capacity. The biosorption capacity was increased up to 52% .
Figure 4 : Effect of metal concentration on % removal of Chromium
Adsorption kinetics :
Pseudo first order and pseudo second order models are tested to investigate the kinetic mechanism. Kinetic data were obtained at intervals of 2, 5, 10, 15, 20, 25, 30 minutes starting with initial metal concentration 50mg/L, biosorbent dosage 5g/L and pH value of 2. Equilibriumwas obtained at 30 minutes.
Pseudo first order is expressed as dq/dt = K1(qe – q) …………(4.1)
whereqe is the amount of chromium adsorbed at equilibrium (mg/g of adsorbate) , q is the amount of metal adsorbed at
various times and K1 is the first order adsorption rate constant (min-1). After applying the limits q = 0 at t = 0; q = qe at t = t; the integrated form of equation (4.1) becomes
log(qe –q) = log (qe) – K1t……..(4.2)
and the corresponding plot is presented in Figure 5. As the straight line is not passing through all the experimental data it is concluded that the rate of chromium removal by green algae adsorbate does not follow the pseudo first order equation. From the linear regression the following coefficients are obtained :
qe = 8.4152 K1 = 0.16247
the non-linear form of integrated equation for first order kinetics is given by q = qe (1 – exp (-K1t)) ………..(4.3)
Volume 2, Issue 6, June 2013
Page 145
5 10 15 20 25
-2.5 -2 -1.5 -1 -0.5 0 0.5 1 1.5
time in minutes
lo g (D y e a d s . a t e q u il - D y e a d s o rb e d )
I Order Plot
Figure 5 : First order kinetics
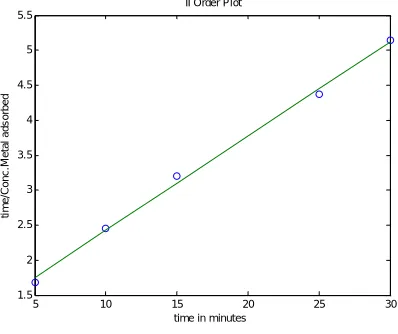
Pseudo second order model:
It predicts the sorption capacity of the solid phase over the entire range of data. Furthermore, it is in agreement with chemisorptions being the rate controlling step and is expresses as
dq/dt = K2 (qe – q)2……….(4.4)
where K2 is the second order rate constant with units of g/mg.min. with the integration limits of same as in the previous
case, the integrated linear form of equation (4.4) becomes t/q = 1/k2qe2 + t/qe ………..(4.5)
The plot of equation 5 resulted in a good straight line as shown in Figure 6. From the linear fit, the following coefficients are obtained :
qe = 7.408 K2 = 0.016965
the non-linear form of integrated equation for second order kinetics is given by q = qe2 K2t /(1+qe2K2t) …..(4.6)
and the non-linear regression of equation(5.6) gave the following values qe = 7.3706 K2 = 0.017258
‘q’ values as estimated by equations (4.3) and (4.6) at various time intervals for I order and II order kinetics respectively, are compared with the experimental values . Second order kinetics gave a reasonable fit with coefficient of determination R2 being equal to 0.98287.
5 10 15 20 25 30
1.5 2 2.5 3 3.5 4 4.5 5 5.5
time in minutes
ti m e /C o n c .M e ta l a d s o rb e d
II Order Plot
Figure 6: II order kinetics
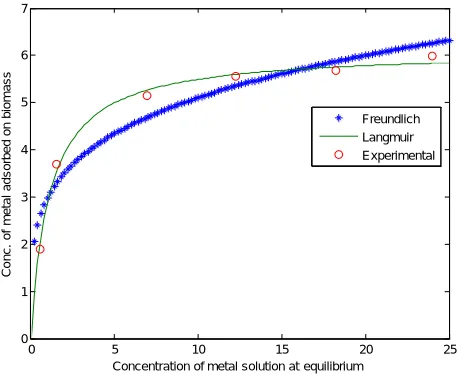
Adsorption isotherms :
To examine the relationship between sorbed metal concentration (qe) and aqueous concentration at equilibrium,
Volume 2, Issue 6, June 2013
Page 146
results are shown in Table 1. Two different isotherms are fitted to the data and the resulting equations with their estimated coefficients are shown in Figure 7.Table 1 : Adsorption isotherms
s.no.
Co
Ce
q
(expt.)
q
(Freundlich)
q
(Langmuir)
1
10
0.54
1.8920 2.5816
1.9950
2
20
1.54
3.6920 3.2974
3.5447
3
40
6.62
5.0560 4.6834
5.2601
4
50
12.22
5.5570 5.3485
5.5963
5
60
18.21
5.6700 5.8707
5.7543
6
70
24.02
5.9960 6.2628
5.8356
0 5 10 15 20 25
0 1 2 3 4 5 6 7
Concentration of metal solution at equilibrium
C o n c . o f m e ta l a d s o rb e d o n b io m a s s Freundlich Langmuir Experimental
Figure 7 : comparison of adsorption isotherms
CONCLUSION:
The biomass of green algae was found to be a potential low-cost adsorbent for the removal of chromium from water with a biosorption removal capacity of 75%.The sorption of chromium on green algae was found to follow Langmuir adsorption isotherm. The sorption of chromium followed the second –order kinetic model which is based on the assumption of biosorption as the rate limiting step.
REFERENCES:
[1.]N.Ahalaya , T.V.Ramachandra , R.D.Kanamdi, “Biosorption of chromium (VI) from aqueous solutions by the husk of Bengal gram (Cicer arientinum),” Electric journal of biotechnology, pp. 1-3,2006.
[2.]T.Angelidis, K.Fytianos, G.Vasilikiotics, “Lead removal from wastewater by cementation utilising a fixed bed of iron spheres”,Environmental Pollution,(50), pp.243-251,1988.
[3.]S.S.Baral, S.N.Das, P.Rath, “Hexavalent Chromium removal from aqueous solution by adsorption on treated sawdust,” Biochem.Eng. J,(13), pp.216-222,2006.
[4.]Erhan Demirbas, K.Mehmet, S. Elif, O.Tuncay, “Adsorption kinetics for the removal of chromium (VI) from aqueous solutions on the activated carbons prepared from agricultural wastes,” 30 ( 4), pp. 533-539,2004.
[5.]G.M.Gadd, “Bioremedial potential of microbial mechanisims of metal mobilization and immobilization,” Current Opinion in Biotechnology, (11), pp. 271-279,1999.
Volume 2, Issue 6, June 2013
Page 147
[7.]M.Loaecm, R.Oliver, J. Guezennece, “Uptake of lead, cadmium and zinc by a noble bacterial exopolisaccharide,”Water Research, (31), pp. 1171-1179,1997.
[8.]Tarangini, “Biosorption of heavy metals using individual and mixed cultures of Pseudomonas aeruginosa and
Bacillus subtilis,”pp.1-77,2009.
[9.]B.Volesky, Sorption and Biosorption. BV Sorbex, Inc., Montreal St. Lambert, Quebec, Canada.2003.