326 Copyright © 2011-15. Vandana Publications. All Rights Reserved.
Volume-5, Issue-1, February-2015
International Journal of Engineering and Management Research
Page Number: 326-332
Optimization of PV Array with DC Converter using Simulink/Matlab
Lokesh1, Somit Dheer2 1
M.Tech (Student), Department of Electrical Engineering, GTBKIET Chhapianwali, Malout, INDIA 2
Assistant Professor, Department of Electrical Engineering, GTBKIET Chhapianwali, Malout, INDIA Punjab Technical University Jalandhar, INDIA
ABSTRACT
With increasing the demand of PV systems is due to the fact that they produce electric power without hampering the environment by directly converting the solar radiation into electric power. However the solar radiation never remains constant. It keeps on varying throughout the day. The need of the hour is to deliver a constant voltage to the grid irrespective of the variation in temperatures and solar insolation. We have designed a circuit such that it delivers constant and stepped down dc voltage to the load. We have studied the open loop characteristics of the PV array with variation in temperature and irradiation levels. Then we coupled the PV array with the buck converter in such a way that with variation in load, the varying input current and voltage to the converter follows the open circuit characteristic of the PV array closely.
Keywords--- Photovoltaic (PV), Pulse width modulation (PWM)
I. INTRODUCTION
With the world economic development and growing demand for energy, the conventional energy sources have become increasingly unable to meet the world demand for the energy. Thus, it is important to explore more and better means of alternative energy sources like sunlight, wind and biomass. Photovoltaic energy is a source of interesting energy; it is renewable, inexhaustible and non-polluting, and it is more and more intensively used as energy sources in various applications [1]. In regard to endless importance of solar energy, it is worth saying that solar energy is a unique perspective solution for energy crisis. Meanwhile, despite all these advantages of solar energy, they do not present desirable efficiency [2], [3]. Renewable energy is
gaining tremendous attention in both academia and industry in an effort to reduce greenhouse emissions. The main renewable sources are biomass, geothermal, hydro, photovoltaic, and wind. Photovoltaic (PV) power is expected to have the fastest annual growth rate having already shown a top growth rate of more than 50% in 2006 and 2007 [4]. PV power systems have the advantage that their installation is static (i.e. no moving parts), simple and quickly compared to other renewable sources. Thus, they have a longer lifetime span, (typically more than 20 years) [5]. Moreover, due to their low operational cost and maintenance, they provide a significant solution for powering remote areas.
In Section I about photovoltaic system discussed, this includes the concept of Cell, Module, PV Panel, and PV Array. In Section II Model and Characteristics curve of PV Array are discussed. In Section III PV array using BUCK converter explained and in Section IV simulation Results are optimized using MATLAB using buck converter.
II.
PHOTOVOLTAIC SYSTEM
327 Copyright © 2011-15. Vandana Publications. All Rights Reserved. The photovoltaic cell output voltage is basically a
function of the photocurrent which is mainly determined
by load current depending on the solar irradiation level during the operation.
Figure 1: Photovoltaic cells, modules, panels and arrays.
The performance of PV modules and arrays are generally rated according to their maximum DC power output (watts) under Standard Test Conditions (STC). Standard Test Conditions are defined by a module (cell) operating temperature of 25o C (77o F), and incident solar irradiance level of 1000 W/m2 and under Air Mass 1.5 spectral distribution. Since these conditions are not always typical of how PV modules and arrays operate in the field, actual performance is usually 85 to 90 percent of the STC Solar panel refers either to a photovoltaic module, a solar thermal energy panel, or to a set of solar photovoltaic (PV) modules electrically connected and mounted on a supporting structure. A PV module is a packaged, connected assembly of solar cells. Solar panels can be used as a component of a larger photovoltaic system to generate and supply electricity in commercial and residential applications. Each module is rated by its DC output power under standard test conditions (STC), and typically ranges from 100 to 320 watts. The efficiency of a module determines the area of a module given the same rated output - an 8% efficient 230 watt module will have twice the area of a 16% efficient 230 watt module. There are a few solar panels available that are exceeding 19% efficiency. A single solar module can produce only a limited amount of power; most installations contain multiple modules.
III.
SIMPLIFIED MODEL OF PV CELL
AND ITS PV ARRAY CHARACTERSTICS
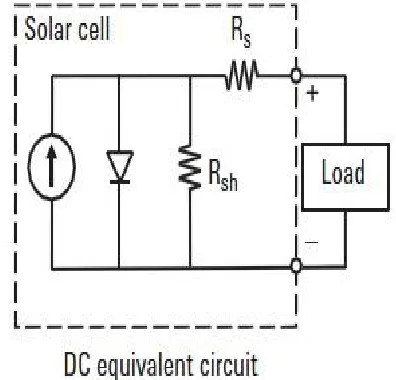
Figure 2: Simplified circuit diagram of a solar PV cell
The voltage equation for solar cell for the given simplified circuit becomes as in equation
:-Vc = (A*k*Tc/e)ln ((Iph+I0-Ic)/I0) - Rs*Ic The symbols used are
Vc: cell output voltage, V.
Tc: reference cell operating temperature (20 °C).
Rs: series resistance of cell (0.001 Ω).
Iph: photocurrent, function of irradiation level and junction temperature (5 A).
I0: reverse saturation current of the diode (2*10-4 A). Ic: cell output current, A.
k: Boltzmann constant (1.38 × 10⁻²³ J/K). e: electron charge (1.602 × 10^-19 C).
For accurate modeling of the solar panel, two diode circuits could have been used. [13]
(A) PV ARRAY CHARACTERISTIC CURVES
328 Copyright © 2011-15. Vandana Publications. All Rights Reserved. temperature.
Figure 3: PV Array characteristics
The characteristic I-V curve tells that there are two regions in the curve: one is the current source region and another is the voltage source region. In the voltage source region (in the right side of the curve), the internal impedance is low and in the current source region (in the left side of the curve),the impedance is high. Irradiance temperature plays an important role in predicting the I-V characteristic, and effects of both factors have to be considered while designing the PV system. Whereas the irradiance affects the output, temperature mainly affects the terminal voltage.
.
IV.
BUCK CONVERTER
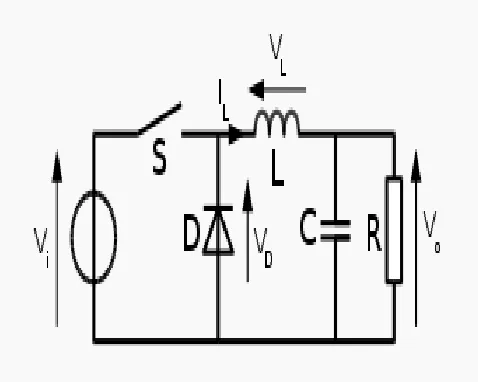
In this section we discussed about the working of buck converter. A buck converter falls in to the category of switch-mode DC-DC converters. These switch-mode DC-DC converters convert one DC voltage level to another level by temporarily storing the input energy and then releasing that energy to the output at a different voltage level. The preferred storage element can be either a magnetic field Storage component (inductors) or electric field storage components (capacitors).This conversion methodology has greater power efficiency (often 75 to 98 percent) than linear voltage regulation (which dissipates unwanted power as heat).
The conceptual model of the buck converter is best understood in terms of the relation between current and voltage of the inductor. Beginning with the switch open (in the "off" position), the current in the circuit is 0. When the switch is first closed, the current will begin to increase, and the inductor will produce an opposing voltage across
its terminals in response to the changing current. This voltage drop counteracts the voltage of the source and therefore reduces the net voltage across the load.
Over time, the rate of change of current decreases, and the voltage across the inductor also then decreases, increasing the voltage at the load. During this time, the inductor is storing energy in the form of a magnetic field. If the switch is opened while the current is still changing, then there will always be a voltage drop across the inductor, so the net voltage at the load will always be less than the input voltage source.
When the switch is opened again, the voltage source will be removed from the circuit, and the current will decrease. The changing current will produce a change in voltage across the inductor, now aiding the source voltage. The stored energy in the inductor's magnetic field supports current flow through the load. During this time, the inductor is discharging its stored energy into the rest of the circuit. If the switch is closed again before the inductor fully discharges, the voltage at the load will always be greater than zero.
.
Figure 4: Naming conventions of the components, voltages and current of the buck converter.
329 Copyright © 2011-15. Vandana Publications. All Rights Reserved.
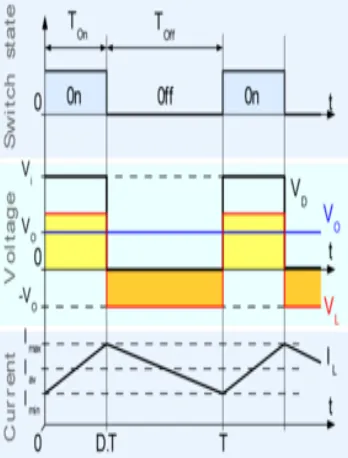
Figure 5: Evolution of the voltages and currents with
time in an ideal buck converter operating in continuous mode.
V.
OPTIMIZED RESULT
(A) OUTPUT WAVEFORMS OF MATLAB CODING
PV Array output is not constant because it depends upon the temperature and solar radiations because temperature and solar radiations varies in the whole day, it means it’s not constant so our output also varies. The effect of temperature and solar radiation understand by using MATLAB coding.
1.
Keeping Temperature constant and Solar radiation variable0 1 2 3 4 5 6 7 8 9 10
0 1 2 3 4 5 6 7 8 9 10
Voltage in volt
C
ur
r
ent
i
n am
p
Figure 6: V-I plot
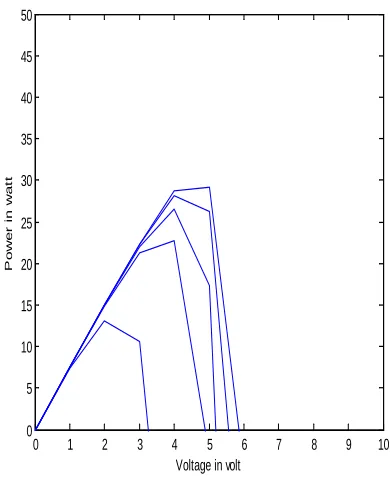
0 1 2 3 4 5 6 7 8 9 10
0 5 10 15 20 25 30 35 40 45 50
Voltage in volt
P
ow
er
i
n w
at
t
330 Copyright © 2011-15. Vandana Publications. All Rights Reserved.
0 1 2 3 4 5 6 7 8 9 10 0
5 10 15 20 25 30 35 40 45 50
Current in amp
P
ow
er
i
n w
at
t
Figure 8: Current-Power Plot
2.
Keeping Temperature variable and Solar radiationconstant
0 1 2 3 4 5 6 7 8 9 10 0
1 2 3 4 5 6 7 8 9 10
Voltage in volt
C
ur
rent
i
n am
p
Figure 9: Voltage-Current Plot
0 1 2 3 4 5 6 7 8 9 10
0 5 10 15 20 25 30 35 40 45 50
Voltage in volt
P
ow
er
i
n w
at
t
Figure 10: Power-Voltage Plot
0 1 2 3 4 5 6 7 8 9 10
0 5 10 15 20 25 30 35 40 45 50
Current in amp
P
ow
er
i
n w
at
t
Figure 11: Power- Current Plot
(B) SIMULATION RESULTS USING
CONVERTER
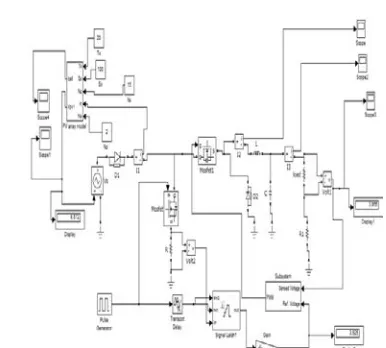
331 Copyright © 2011-15. Vandana Publications. All Rights Reserved. The modeling and the simulation of the whole system has
been done in MATLAB – SIMULINK environment.
Figure 12: Model Of PV Array With Buck Converter In Matlab
(C) OUTPUT WAVEFORMS OF SIMULATION:-
The photovoltaic output shown in wave form below:
Figure 13: Photovoltaic Output Current Ipv
Figure 14: Photovoltaic Output Voltage Vpv
Figure 15: Buck Converter Current Output
Figure 16: Buck Converter Voltage Output
332 Copyright © 2011-15. Vandana Publications. All Rights Reserved.
VI.
CONCLUSION
From the observations made above, we conclude that the system developed is capable of extracting
maximum power from the photovoltaic module at the same time providing a regulated DC supply.
The ambient temperature of the system is assumed not to change for a reasonably long time (about 5 minutes). But practically, his may not be the case. The insolation may change in two to three minutes. In such cases, we need to derive the reference voltage from the short circuit current of the PV panel. The value obtained can be latched as the reference voltage and Maximum power point tracking can be obtained automatically without any manual intervention.
REFERENCES
[1] L.A.C Lopes and Lienhardt. A.-M. A simplified nonlinear power source for simulating PV panels,
Power Electronics Specialist, 2003. PESC’03. IEEE
34th Annual Conference on, 1(4), 1729- 1734.15-19
(2003)
[2] Calais M., Myrzik J., Spooner T. and Agelidis V. G., Inverters for single-phase grid connected photovoltaic systems-an overview, in Power Electronics Specialists
Conference, (2002)
[3] Myrzik J.M.A. and Calais M., String and module integrated inverters for single-phase grid connected photovoltaic systems - a review, in Power Tech
Conference Proceedings, (2003)
[4] Xue Y., Chang L., Kjaer S.B., Bordonau J. and Shimizu T., Topologies of single-phase inverters for small distributed power generators: an overview, IEEE
Trans. Power Electronics, 19, 1305-1314 (2004)
[5] Kjaer S.B., Pedersen J.K. and F. Blaabjerg., A review of single- phase grid-connected inverters for photovoltaic modules, IEEE Trans. Industry Applications,
41, pp. 1292-1306, (2005)
[6] E. Matagne, R. Chenni, and R. El Bachtiri., A Photovoltaic cell model based on nominal data only, In Proc. International Conference on Power Engineering,
Energyand Electrical Drives, POWERENG, 562–565,
(2007)
[7] Mummadi Veerachary, ―Improved Maximum Power
Point Tracking Algorithm For Photovoltaic Sources,‘‘IEEE International Conference on Sub stainable Energy Technologies (ICSET).,pp.301- 305, Nov.2008 [8] R. Erickson and D. Maksimovic, Fundamentals of Power Electronics, vol. 1,2nd Ed: Kluwer academic, 1956. [9] Saxena, A.R and Veerachary, M. (2012) ‘Design of Robust Digital Stabilizing Controller for Fourth-Order Boost DC–DC Converter: A Quantitative Feedback Theory Approach‘, IEEE Transactions on Industrial Electronics, vol. 59, no. 2, pp. 952-963.
[10] Saxena, A.R. and Veerachary, M. (2010) ‗QFT based robust controller design for fourth-order boost dc-dc switching power converter‘, Joint International Conference on Power Electronics, Drives and Energy Systems (PEDES), pp.1-6.
[11] H. Atlas and A.M. Sharaf, “A Photovoltaic Array Simulation for Matlab-Simulink GUI Environment”, Proce. of IEEE International Conference on Clean
Electrical Power, ICCEP 2007, Capri, Italy.
[12] Roberto F. Coelho, Filipe Concer, Denizar C. Martins, “A Study of Basic DC-DC Converters Applied in Maximum Power Point Tracking”, Proceedings of IEEE 2009 Conference, ISBN: 978-1-4244-3370-4, pp. 673-677. [13] Weidong Xiao, William G. Dunford and Antoine Capel,” A Novel Modeling Method for Photovoltaic Cells”
2004 35th Annual IEEE Power Electronics Specialists
Conference
[14] K.H. Hussein, I. Muta, T. Hoshino and M. Osakada, “Maximum photovoltaic power tracking: an algorithm for rapidly changing atmospheric conditions”, IEE proC.-Gener. Transa Distrib., Vol. 142, NO. I , jonUnry 1995
[15] “Application of Non-Conventional & Renewable Energy Sources” Bureau of Energy Efficiency