Reprinted from the Journal of Environmental Quality
Vol. 13, no. 1, January-March 1984. Copyright 0 1984, ASA, CSSA, SSSA 677 South Segoe Road, Madison. WI 53711 USA
Nitrogen Availability from Potato-Processing Wastewater for Growing Corn'
J. H. SMITH AND C. W. HAYDEN'ABSTRACT
A line source sprinkler was used to irrigate corn (Zen ?nays L.) plots with potato (Soianum tuberosum L.)-processing wastewater in 1979, 1980, and 1981. Nitrogen applications ranged from about 4 to 600 kg/ha. Corn yields were measured for each row, the grain and stalks were analyzed for total N, and N uptake was calculated. The plots were split by years, one-third of the area was fertilized with waste-water 3 y, one-third 2 y, and one-third 1 y. This allowed evaluation of current and residual value of wastewater fertilisation. Corn responded well to wastewater fertilization, with N applications in the wastewater increasing corn yields with increasing increments of N up to about 200 to 250 kg/ha annually, and corn grain yields ranged up to about 12 Mg/ha. Yield comparisons were made with plots fertilized with am-monium nitrate fertilizer. We determined that potato-processing wastewater N was almost equal to ammonium nitrate N for growing corn. Wastewater applications that will apply approximately 200 to 250 kg Nibs annually should be optimum for growing corn on this soil. Wastewater N from potato processing has good residual and carry-over for 1 y but under conditions of this experiment did not carry over for more than 1 y. Whether the excess N was lost from de-nitrification or leaching was not determined.
Additional Index Words: line source sprinkler, residual nitrogen,
corn grain.
Smith, J. H., and C. W. Hayden. 1984. Nitrogen availability from potato-processing wastewater for growing corn. J. Environ. Qual. 13: 151-156.
Irrigating with food-processing wastewater for growing crops is an established practice used by a large segment of the food processing industry (2, 4, 5, 6, 7, 8, and 1 I). In many existing systems, emphasis has been placed on disposing of wastewater with maximum applications of both the wastewater and included plant nutrients. Large amounts of wastewater and nutrients from potato
(Solanum tuberosum
L.)-processing operations have been applied to land with up to 550 cm of water and 2550 kg N/ha in 1 y (10). These seemingly excessive applications have not always created groundwater pollution problems, but in some cases have promoted almost total denitrification because of the anaerobic conditions in the soil related to the high water applica-tions and the high energy content of the organic con-stituents of the wastewater (9). Well-managed wastewater irrigation fields growing grass for hay or forage look good and yield well because of the heavy fertilization with wastewater nutrients. Consequently, there has been interest from farmers in obtaining waste-water for crop irrigation and fertilization in areas adja-cent to fields already irrigated with wastewater. With this developing interest in utilizing wastewater for its nutrient value, a need was seen for evaluating potato-processing wastewater and determining its potential nutrient value for growing crops.' Contribution from the USDA-ARS Snake River Conserv. Res. Center, Kimberly, ID 83341, in cooperation with the Idaho Potato Commission and the .1. R. Simplot Co. Food Div., Caldwell, ID. Re-ceived 29 Apr. 1983.
'Soil Scientist and Biological Technician (Soils), retired, respective-ly,
The objectives of this research were to compare potato-processing wastewater and NH4N0,-N sources for corn
(tea mays
L.) production and thereby evaluate the wastewater as a N source.MATERIALS AND METHODS
A field plot area was selected where both potato-processing waste-water and irrigation waste-water were available. The wastewaste-water was pumped to the plot area through a pipeline from a potato-processing plant nearby. An area 30.5 m wide by 183 m long containing 40 rows of corn of Moulton fine sandy loam soil (mixed mesic Typic Haplaquoil) near Caldwell, Idaho was irrigated with wastewater using a line source sprinkler in the center of the plot running the length of the plot. Sprinkler nozzles were spaced at 6-m intervals. Sixty rain gauges were installed in three rows of 20 across the plot in alternate corn rows to measure wastewater applications and the water was sampled during each irrigation to determine the N and chemical oxy-gen demand (COD) contents of the wastewaters. The total N content of the wastewater averaged 76 mg/L with < 2 mg/L NO,-N. Nitrogen in the wastewater applied to the plots ranged from 4 to 600 kg/ha (Table 1). Wastewater was applied five times in 1979 during the grow-ing season and twice each year before plantgrow-ing corn in 1980 and 1981. During the first year the entire plot area was irrigated with waste-water; in the second year 122 m of length was irrigated and the 61 m remaining was left without wastewater irrigation for residual fertiliza-tion evaluafertiliza-tion; in the third year 61 m of the plot was irrigated with wastewater, 61 m was evaluated for residual following 2 y of waste-water irrigation, and 61 m was evaluated for residual fertility value following .I y of irrigation with wastewater. Each 61 m plot area was divided into three areas of 20 m each for sampling. These served as replications for statistical analyses. An adjoining set of plots with the same soil and cropping history, 10 by 23 m each, was fertilized with NI-14NO, to provide 100, 200, or 300 kg N/ha annually. Each plot was split to fertilize one-third of the area with one, one-third with two, and one-third with three annual applications of fertilizer during the ex-periment for residual N evaluation. These plots were arranged in a randomized block design replicated three times.
All of the experimental area was irrigated in the furrows between rows with Boise River water to meet the water requirements of the corn crop and to remove the water variable imposed by the wastewater irrigation. In 1979 the wastewater was applied in the early spring be-fore planting and during the growing season to apply the desired amount of N. The following 2 y one irrigation was applied in the fall following harvest and another in the spring before planting. The ex-cess water applied by wastewater irrigation in the center of the plots caused some extra leaching. Previous research (10) showed that the or-ganic constituents of wastewater were removed from the water almost quantitatively in 60 cm of soil and would not leach. Therefore, the relatively uniform irrigations with river water were considered to elim-inate the water variable for this experiment.
The plots were treated with Atrex and Dual postemergence at recommended rates for weed control. Corn was grown on the plot areas for 3 y, harvested at maturity, and yields of corn grain and stalks were determined separately. At harvest, three 3-m row sections were cut by hand from each of 40 rows for each wastewater irrigation treatment, weighed, the ears removed, bagged, and weighed. The stalks were run through a forage chopper and sampled for moisture and chemical analysis. The stalk samples and ears were dried in an oven at 60°C, the corn shelled, and both corn and stalks were ground and analyzed for total N by a Kjeldahl procedure (1). The cobs were discarded. The corn rows were numbered from 1 to 20, starting at the center of the plot and going to the outside row, which was number 20, on each side of the plot. Corn varieties grown on the plots and ad-jacent area were `Greenway 55' in 1979 and 'Pioneer 3901' in 1980 and 1981. Plot preparation, planting, cultivation, irrigation, and harvest after plot samples were removed were performed by the cooperator.
Table I-Wastewater and N applied to plot area through a line source sprinkler.
1979 1980 1981
Corn row
Waste-water
Waste
water N
Waste-water
cm kg/ha CM kg/ha cm kg/ha
1 71.8 600 45.7 434 50.4 407
2
3 56.0 468 49.4 439 51.5 412
4
5 55.2 447 47.6 425 49.6 396
6
7 47.7 404 38.8 346 43.0 343
8
9 45.0 378 33.2 298 40.2 319
10
11 35.8 303 28.1 251 32.9 262
12
13 26.6 229 19.5 174 23.8 189
14
15 13.8 120 12.1 106 14.5 115
16
17 6.2 46 4.5 39 5.8 45
18
19 0.4 4 0.7 6 0.6 4
20
Table 2-Corn grain yield from potato•processing wastewater irrigation field in 1979, 1980, and 1981 at Caldwell, Idaho.
Harvest year
1979 1980 1981
Years fertilized
1979-Corn 1979- 1980-
1979-row 1979 1980 1979 1981 1980 1979
Corn yield
Mg/ha
1 9.73 cd' 11.36 fgh 11.86 der 7.411 4.901 4.461 2 10.29 cd 14.00 12.37 f 5.90 5.06 3.83 3 9.35 cd 12.24 gh 11.61 of 6.09 4.90 4.46 4 10.73 cd 12.87 hi 10.36 clef 6.15 4.83 4.58 5 8.79 bed 12.98 hi 11.74 of 6.15 5.52 5.52 6 11.61 d 11.55 fgh 10.48 ode 6.97 5.27 5.65 7 8.79 bed 12.62 hi 11.05 def 7.85 5.21 5.02 8 8.35 bed 11.55 fgh 10.73 de 7.28 4.96 5.08 9 10.48 cd 13.06 hi 10.17 cde 7.34 5.52 5.08 10 7.97 be 12.48 ghi 10.86 clef 7.66 5.40 4.83 II 11.11 cd 11.42 fgh 11.05 def 6.21 4.83 3.14 12 10.98 ed 10.92 efg 10.48 cde 6.63 4.52 4.71 18 10.36 ed 10.42 clef 10.73 de 5.59 3.61 4.64 14 9.79 cd 9.60 cde 10.48 ede 4.52 3.14 4.21 15 7.91 be 9.16 bed 9.67 cd 5.52 3.83 4.64 16 7.66 be 7.97 abc 8.98 be 3.20 2.20 2.84 17 5.52 ab 9.10 bed 7.97 ab 5.21 3.89 4.52 18 5.96 ab 7.78 ab 8.10 ab 4.77 3.89 4.64 19 4.02 ab 7.16 a 6.90 a 4.27 3.64 4.27 20 3.89 a 8.66 abc 7.53 ab 4.02 3.77 4.64 Mean 8.10 10.88 b 10.17 a 5.90 b 4.46 a 4.52 a
n Numbers in columns followed by different letters are different at the 95% probability level. Means were compared by harvest years. t No statistical differences were observed in these columns.
The wastewater N applications shown in Table 1 were calculated from the N concentration and amount of wastewater collected in the rain gauges. The gauges were placed in alternate rows; therefore, the application rates for N were calculated for every other row. The appli-cations to both sides of the sprinkler line were averaged for inclusion
in the tables. The data were analyzed by analyses of variance and
compared by Duncan Multiple Range Tests (3). Phosphorus and potassium analyses of potato-processing wastewater as reported by Smith et al. (10) averaged 13 and 135 mg/L.
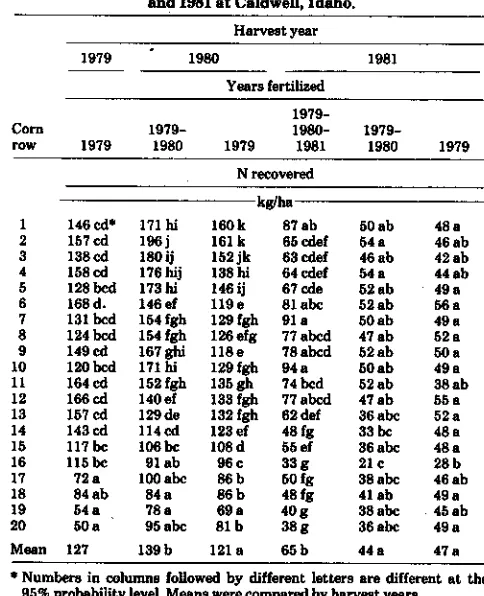
Table 3-Nitrogen recovered in corn grain grown on a field irrigated with potato•processing wastewater In 1979, 1980,
and 1981 at Caldwell, Idaho.
Corn row
1 146 cd* 171 hi 160k 87 ab 50 ab 48a 2 157 eel 196j 161k 65 cdef 64a 46ab 3 138 cd 180 ij 152 jk 63 cdef 46ab 42 ab 4 158 cd 176 hij 138 hi 64 Mel 54 a 44 ab 5 128 bed 173 hi 146 ij 67 ale 52ab 49 a 6 168 d. 146 of 119 e 81 abc 52ab 56 a 7 131 bed 154 fgh 129 fgh 91 a 50 ab 49 a 8 124 bed 154 fgh 126 efg 77 abed 47 ab 62 a 9 149 cd 167 ghi 118 e 78 abed 52ab 50 a 10 120 bcd 171 hi 129 fgh 94 a 50 al) 49 a 11 164 al 152 fgh 136 gh 74 bed 52ab 38 al) 12 166 cd 140 of 138 fgh 77 abed 47 ab 55 a 13 157 cd 129 de 132 fgh 62 clef 36 abc 52 a 14 143 cd 114 cd 123 ef 48 fg 33 bc 48a 15 117 be 106 be 108 d 55 of 36 abc 48 a
16 115 be 91 ab 96c 33g 21c 28b
17 72a 100 abc 86b 60 fg 38abc 46ab
18 84 ab 84a 86b 48 fg 41 ah 49a
19 54a 78a 69a 40g 38abc 45 ab
20 50 a 95 abc 81 h 38 g 36 abc 49 a Mean 127 139 b 121 a 65 b 44 a 47 a • Numbers in columne followed by different letters are different at the
95% probability level. Means were compared by harvest years.
RESULTS
Corn grain yields in both 1979 and 1980 were in-creased with increasing wastewater N fertilization up to about 200 to 250 kg N/ha with optimum
*aft/4'am
fertilization yielding approximately 10 Mg of corn grain per ha (Table 2). The extra N added to rows 1 to about 13 gave no further yield increase. Yields were somewhat higher in 1980 than in 1979 but decreased greatly in 1981. Corn grain yields in 1981 were probably depressed by an early season weed infestation that was cleaned out of the plots by hand weeding. Also, the general corn yields for the area were somewhat lower in 1981 than 1980 because of seasonal differences. In 1981 the only significance in the statistical analyses was the difference between current years and residual fertilization. The 1981 fertilization produced higher yields, even when very high amounts of N had been applied in previous years in the wastewater irrigations. At the high waste-water N applications, the corn received much more N than it could assimilate, and N applications above the 200 to 250 kg/ha rate, even up to 600 kg N, were probably not responsible for variations in yield.
Nitrogen uptake in the corn followed similar trends to total corn yields in all 3 y (Table 3). The N uptake in-creased up to about the 200 kg/ha wastewater N ferti-lization level. Nitrogen uptake in the residual evaluation areas in 1981 were lower than the 1981 fertilized plot areas. In the two residual areas, significance from wastewater fertilization had disappeared.
On the average, N uptake in the corn and stalks de-creased from 1979 to 1980 to 1981 and N uptake in the
Harvest year
1979 1980 1981
Years fertilized
1979-1979- 1980- 1979-1979 1980 1979 1981
N recovered kg/ha
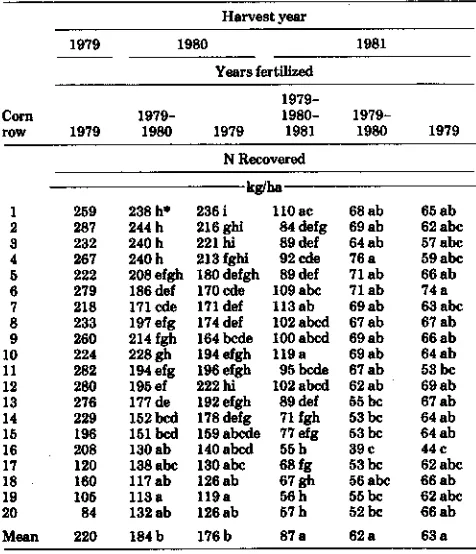
Table 4-Nitrogen recovered in corn and stalks from a field
irrigated with potalprocessing wastewater in 1979, 1980, and 1 81 at Caldwell, Idaho.
Harvest year
1979 1980 1981
Years fertilized
1979-Corn 1979- 1980-
1979-row 1979 1980 1979 1981 1980 1979
N Recovered keha
1 259 238 h* 236 i 110 ac 68 ab 65 ab
2 287 244 h 216 ghi 84 defg 69 ab 62 abc 3 232 240 h 221 hi 89 def 64 ab 57 abc 4 267 240 h 213 fghi 92 cde 76 a 59 she 5 222 208 efgh 180 defgh 89 def 71 ab 66 ab 6 279 186 def 170 cde 109 abc 71 ab 74 a 7 218 171 cde 171 def 113 ab 69 ab 63 abc 8 233 197 efg 174 def 102 abed 67 ab 67 ab 9 260 214 fgh 164 bade 100 abed 69 ab 66 ab 10 224 228 gh 194 efgh 119 a 69 at, 64 ab 11 282 194 efg 196 efgh 95 beds 67 ab 53 be 12 280 196 of 222 hi 102 abed 62 ab 69 ab 13 276 177 de 192 efgh 89 def 55 be 67 ab 14 229 152 bed 178 defg 71 fgh 53 be 64 ab 16 196 151 bed 159 abode 77 efg 53 be 64 ab 16 208 130 ab 140 abed 55 h 39 c 44 c
17 120 138 abc 130 abc 68 fg 53 be 62 abc 18 160 117 ab 126 ab 67 gh 56 abc BB ab
19 105 113 a 119 a 56 h 55 be 62 abc
20 84 132 ab 126 ab 67 h 52 be 66 ab
Mean 220 184 b 176 b 87 a 62 a 63 a
Table 5-Corn stalk yields from a field irrigated with potato-processing wastewater in 1979, 1980,
and 1981 at Caldwell, Idaho. Harvest year
1979 1980 1981
Years fertilized
1979-Corn 1979- 1980-
1979-row 1979 1980 1979 1981 1980 1979
Corn stalk yields Mg/ha
1 4.84 4.37 5.42 5.92 5.81 5.31
2 5.67 3.38 4.28 6.20 4.93 4.75
3 8.28 4.08 5.27 6.10 5.81 4.77
4 4.66 4.60 5.81 6.16 6.50 4.64
5 4.87 2.67 3.45 5.85 6.19 5.34
6 3.88 3.20 4.42 6.50 5.78 5.27
7 3.76 1.66 3.70 6.23 5.67 4.35
8 5.26 3.23 4.12 6.03 6.03 4.91
9 4.76 3.63 3.97 5.78 5.63 5.20
10 5.64 4.01 5.27 6.59 6.21 4.84
11 6.08 3.18 5.11 5.51 5.22 4.39
12 6.39 4.21 6.75 5.85 4.97 4.91
13 6.54 3.90 4.91 6.01 4.93 4.95
14 4.64 3.23 4.60 5.29 5.31 4.71
15 5.09 3.72 4.48 6.01 5.09 4.91
16 9.44 3.41 4.19 5.49 4.62 4.42
17 5.13 3.45 4.08 5.18 4.46 5.22
18 - 3.09 3.70 4.84 4.06 5.45
19 3.58 3.16 4.91 4.60 4.84 4.44
20 3.96 3.36 4.28 6.00 4.78 5.27
Mean 5.09 3.47 a* 4.80 b 5.72 a 6.31 b 5.31 b Numbers in columns followed by different letters are different at the * Mean comparisons by years are different at the 95% probability when 95% probability level. Means were compared by harvest years. followed by different letters.
residual plots was less than in the wastewater-fertilized areas (Table 4). Generally, N uptake increased from row 2q to row 13 with increasing wastewater N applications for the 3 y. Differences in N uptake at higher N appli-cations is apparently random error. The statistical trends for these data are about the same as those for the data from the corn and corn stalk N shown separately.
While 1980 corn yields were much higher than the other years, the stalk yields for that year were lower than the other 2 y, indicating that there is little if any correlation between stalk and corn grain yields (Table 5). There were no statistically significant differences between stalk yields from rows representing differences in wastewater N applications. The corn grain yields re-sponded to the wastewater fertilization but the stalks did not. This lack of yield response in the corn stalks probably resulted from low fertility that produced good stalk growth, but was not sufficient to produce maxi-mum ear growth or corn grain yield in the outer rows.
While stalk yield was not significantly influenced by N in the wastewater applications, there was a difference in N uptake in the stalks (Table 6). Nitrogen uptake in-creased from the lowest wastewater fertilization to about row 13 with 229 kg wastewater N application in 1979. In the following years and in the residual N evaluation areas, N uptake in the stalks was not sig-nificantly influenced by wastewater N applications. The N in the stalks in 1979 averaged about 95 kg/ha and in following years was reduced to half that value or less.
It should be noted that from time to time differences in observations for individual rows appear to be
statis-Table 6-Nitrogen recovered in corn stalks grown on a field
irrigated with potato-processing wastewater in 1979, 1980, and 1981 at Caldwell, Idaho.
Harvest year
1979 1980 1981
Years fertilized
1979-Corn 1979- 1980-
1979-POW 1979 1980 1979 1981 1980 1979
N Recovered keha
1 113 cds 66 b 76 b 21 abed 18a 18a
2 130d 48 ab 56 ab 25 abc 16a 16a
3 94 cd 61b 69 b 26 ab 19a 15a
4 109 cd 64 b 75 b 28 a 21 a 15a
5 94 cd 35 ab 34 a 21 abed 19a 17a
6 111 cd 40 ab 52 a 28 a 20a 18 a
7 87 bed 20 a 43 a 24 abed 19a 12a
109 cd 44 ab 48a 26 abc 19a 16a
9 111 cd 47 ab 46 a 22 abed 18a 16*
10 104 cd 56b 64 ab 24 abed 19a 155
11 119 cd 41 ab 62 ab 21 ab 16a 16a
12 114 cd 54 ab 89 b 25 abc 16a 16a
13 119 cd 48 ab 81 ab 27 ab 19a 15a
14 85 bed 39 ab 55 ab 22 abed 20 a 16a 15 80 abed 44 ab 52 a 22 abed 17a 16a 16 93 bed 40 ab 45 a 22 abed 18a 16a
17 48 ab 38 ab 44 a 19 cd 155 16a
18 76 abc 33 ab 39 a 19 cd 15a 18a
19 52 ab 35 ab 50 a 17d 16a 17a
20 34 a 40 ab 46 a 19 cd 16* 17a
Mean 94 46 a 55 b 22 a 18a 16e
• Numbers in columns followed by different letters are different at the 95% probability level. Means were compared by harvest years.
3. Environ. Qual., Vol. 13, no. 1, 1984 153
Table 7-Corn grain yield and N recovery from ammonium nitrate-fertilized plots at Caldwell, Idaho.
N Fertilizer Corn grain yield N Recovery in cornand stalks 1979 1980 1981 1979 1980 1981 1979 1980 1981
- kglha Mgrha kgiha
0 0 4.58 6.65 an 3.20 a 63 77 a 63 a
100 0 8.85 6.47 a 4.02 a 131 76 a 58 a
200 0 10.23 7.47 a 4.96 a 149 92 a 98 ab
300 0 9.98 8.79 ab 3.95 a 156 105 a 69 a
100 100 6.78 a 6.78 b 90 a 132 abc
200 200 8.54 a 7.09 b 128 ab 166 be
800 300 10.86 b 7.47 b 161 b 161 be
100 100 100 4.20 a 98 ab
200 200 200 7.59 b 168 be
300 300 300 7.66 b 210c •
n Numbers in columns followed by different letters are different at the 95% probability level.
tically significant at the higher wastewater N application rates. Even though there were trends or individual num-bers that showed statistical difference, these values have little meaning apart from the general level because the corn crop in rows 1 to 10 received N applications in the wastewater in excess of that required for growing the crop. Therefore, it must be assumed that any differ-ences that existed in the yields at the higher fertility levels have to be attributed to random variation and not to N fertilization with wastewater.
In 1979, applications of NH,N0,-N up to 200 kg/ha increased corn yields (Table 7). In 1980 the plots that were fertilized only in 1979 showed a trend upward in yields from the check treatments to the 300-kg N treat-ments, but no significant differences were observed.
The plots that received 300 kg N/ha for both 1979 and 1980 had higher corn yields than the plots receiving lower rates that were not different from each other, with yields up to about 10 or 11 Mg/ha. The maximum corn yields on the ammonium nitrate-fertilized plots in 1981 were about 3 Mg lower than the maximum yields in 1980. The corn fertilized in 1979 and 1980 had fertility carryover in 1981 that increased slightly with increasing rates, causing a trend toward better yields at the higher N rates. The corn fertilized the 3 y had sufficient N for excellent yields but some other factor limited yields. The amount of N in the corn grain showed similar trends to yields with N uptake increasing to the intermediate rate of N application in 1979 and no differences in N uptake for the plots that were cropped a second year without additional N. Nitrogen uptake in the corn grain In 1980 was greater for the 200 and 300 kg/ha application rates than the check, the residual plots, or the 100-kg N/ha rates.
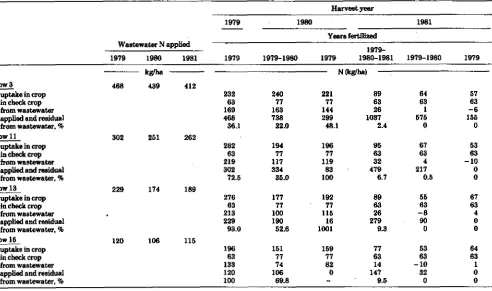
Table 8 shows the.relative N recovery rates from the various wastewater N applications by calculating N re-covery by rows of corn representing four fertilization rates. The rows selected for evaluation were row 3, representing the highest fertilization rates; row 11, representing intermediate high rates; row 13, represent-ing the average maximum application at which N re-sponse was observed; and row 15, representing rela-tively low N applications. The first line of data for each set shows N uptake in the crop (both stalks and corn grain). The next line of data shows a check plot N up-take that represents the N recovered without fertiliza-tion. These figures were taken from check plot N uptake from the NH.NO 3 -fertilized plot areas. The third line is
Table 8-An analysis of N uptake in corn and stalks from a field irrigated with potato•processing wastewater at Caldwell, Idaho.
Wastewater N applied
Harvest year
1979 1980 1981
Years fertilized
1979 1979-1980 1979 1980-19811979- 1979-1980 1979
1979 1980 1981
kg/ha N ilcgfha)
Row 3 468 439 412
N uptake in crop 232 240 221 89 64 57
N in check crop 63 77 77 68 68 63
N from wastewater 169 163 144 26 1 -6
N applied and residual 468 738 299 1087 575 156
N from wastewater, % 36.1 22.0 48.1 2.4 0 0
Row 11 302 251 262
N uptake in crop 282 194 196 95 67 63
N in check crop 63 TT 77 83 63 63
N from wastewater 219 117 119 32 4 -10
N applied and residual 302 334 83 479 217 0
N from wastewater, % 72.5 85.0 100 6.7 0.5 0
Row 18 229 174 189
N uptake in crop 276 177 192 89 55 67
N in check crop 83 77 77 63 63 63
N from wastewater 213 100 115 26 -8 4
N applied and residual 229 190 16 279 90 0
N from wastewater, % 98.0 52.6 1001 9.8 0 0
Row 15 120 106 115
N uptake in crop 196 151 159 77 53 64
N in check crop 63 77 77 63 63 83
N from wastewater 183 74 82 14 -10 1
N applied and residual 120 106 0 147 32 0
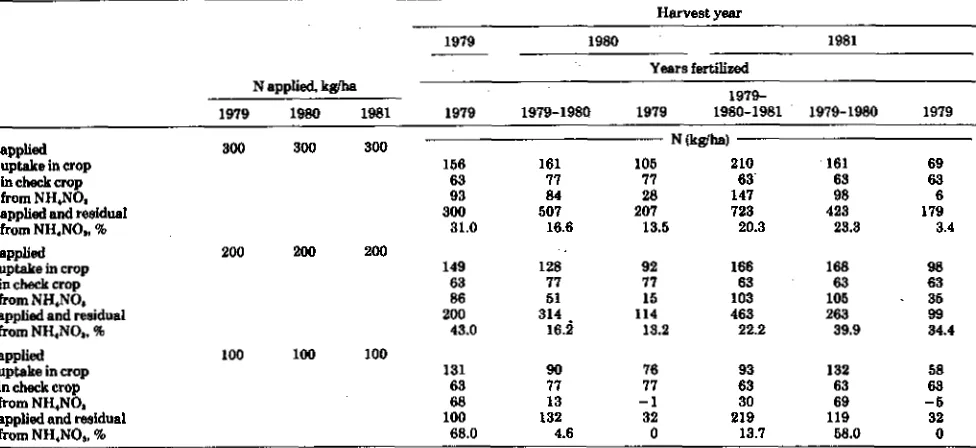
Table 9—An analysis of N uptake in corn and stalks from plots treated with NH,NO,.
N applied, kg/ha
Harvest year
1979 1980 1981
Years fertilized 1979
1979-1979-1980 1979 1980-1981 1979-1980 1979 1979 1980 1981
N applied 300 300 300 N licgilia)
N uptake in crop 156 161 105 210 161 69
N in check crop 63 77 77 63 63 63
N from NH,NO, 93 84 28 147 98 6
N applied and residua! 300 507 207 723 423 179
N from % 31.0 16.6 13.5 20.3 23.8 3.4
N applied 200 200 200
N uptake in crop 149 128 92 166 168 98
N in cheek crop 63 77 77 83 63 63
N from NI-1,NC4 86 51 15 103 105 85
N applied and residual 200 314 . 114 463 263 99
N from NR1NO3, % 43.0 16.2 13.2 22.2 39.9 84.4
N applied 100 100 100
N uptake in crop 131 90 76 93 182 58
N in check crop 63 77 77 63 63 68
N from NH,NO, 68 13 -1 30 69 -6
N applied and residual 100 132 32 219 119 32
N from NH,NO,, % 68.0 4.6 0 13.7 58.0 0
the N uptake in the corn and stalks from the applied wastewater. The fourth line represents the amount of fertilizer applied in the wastewater in 1979 and in each successive year the N applied in the wastewater minus the N utilized by the crop for either additional waste-water N applications or residual N evaluations from previously applied wastewater N. The fifth line is an ef-ficiency factor.
In row 3, N recovery values were relatively low be-cause of the high fertilizer applications in 1979 and 1980 and the relatively low corn yields in 1981. The 1979 crop utilized 36% of the applied N and the residual carryover was 50% utilized in 1980, representing 68% of the originally applied wastewater N. No additional N was absorbed by the 1981 crop. With each additional waste-water N application at the high rates, the recovery de-creased.
In row 11, the 1979 crop utilized 72% of the waste-water-applied N and in 1980 the residual was utilized 100%, leaving none to carry over for the second year residual evaluation. Again, the additional wastewater N applications in 1980 and 1981 decreased the N recovery percentages as shown in Table 8. In row 13, where wastewater N fertilization seemed to be optimum, 93% of the 1979-applied wastewater N was used by the corn in that year with 100% of the residual being used the following year. The second wastewater N application on row 13 that occurred in 1980 had a lower utilization ef-ficiency, with 53%. Fertilization in 1981 and other residual evaluations showed low efficiencies in 1981 be-cause of relatively low yields and low N utilization.
In row 15, where wastewater N fertilization was be-low optimum, N utilization in 1979 appeared to be 100%. With wastewater N application for 2 y, 70% N utilization was observed and for wastewater N applica-tions for 3 y, the utilization dropped to 10%.
An analysis of N uptake by corn fertilized with NI-14NOI is presented in Table 9. At the 300 kg/ha N
rate, recovery in 1979 was 31% followed by lower re-covery values for the following 2 y fertilization. These applications were higher than the corn crop could utilize efficiently. At the 200 kg/ha N rate, recovery in 1979 was 43% followed by values about one-half that the fol-lowing 2 y. At the 100 kg/ha N rate, recovery in 1979 was 68%. The next highest recovery was 58% obtained in 1980 from 2 y fertilization with NH4NO3. Residual N
recovery values are also reported in Table 9.
Overall N recovery in corn and stalks fertilized with NI-1,140, ranged from 36 to 40% for plots fertilized 3 y at the three N rates, and deviated from those figures by only a few points for plots fertilized 2 y and cropped 3 y. N recovery overall increased greatly and ranged from 42 to 81% for corn fertilized 1 y and cropped 3 y (Table 10). The low fertilization rate, while it produced high N recovery, produced low corn yields.
Comparing wastewater N and NI-1,,N0,-N recovery percentages in Tables 8 and 9 shows the wastewater N recovery to be higher in most cases during the first 2 y of the experiment than the fertilizer N recovery. In 1981, the wastewater-N-treated corn plots had fairly satisfac-tory corn yields but the N uptake was severely depressed. There is no satisfactory explanation of this difference, and comparison between the two N sources for 1981 is fruitless.
Table 10—Overall N recovery in corn grain and stalks fertilized with ammonium nitrate and cropped 3 y.
Years fertilized
1979-1980-1981 1979-1980 1979 N Applied Recovery N Applied Recovery N Applied Recovery
kg/ha kg/ha kg/ha
900 36 600 30 300 42
600 40 400 43 200 68
300 37 200 40 100 81
CONCLUSION
Nitrogen from potato-processing wastewater appears to produce a maximum corn yield with about 200 kg N/ha annually. The wastewater N produces corn growth response equivalent to that of commercial ferti-lizer N from ammonium nitrate. In good cropping years, wastewater fertilization may have a potential for yields somewhat better than the commercial fertilizer N source. There is some carry-over of applied wastewater N from year to year when excessive amounts are applied, but the carry-over does not appear to last > 1 y. Residual fertility value of the wastewater N, even when applied at very high rates, appears to be utilized in the second year. Whether the wastewater N that was not used by the crop was leached or denitrified was not de-termined.
Wastewater irrigation with potato-processing water is an effective method of disposing of the waste-water and nutrients. Using the wastewaste-water for growing crops instead of disposal in waterways reduces pollution and utilizes some of the wastewater nutrients that would otherwise be wasted. Spreading the wastewater over a large enough area to efficiently utilize the included plant nutrients is a desirable advancement in wastewater irri-gation. This research will provide guidelines for more nearly optimum wastewater application and utilization of the included N for crop growth and maintenance, rather than applying maximum wastewater in the disposal mode.
LITERATURE CITED
1. American Public Health Association (APHA). 1971. Standard methods for the examination of water and wastewater. Ed. 13. APHA, New York.
2. Gurnham, C. F., and T. K. Nedved. 1974. Treatability studies of three food processing plant wastewaters. Purdue Univ. Eng. Ext. Ser. Bull. 145, part 1. p. 283-289.
3. LeClerg, E. L. 1957. Mean separation by the functional analysis of variance and multiple comparisons. USDA-ARS, ARS 20-3. Natl. Agric. Library, Beltsville, Md.
4. Loehr, R, C. 1974. Agricultural waste management, problems, processes, approaches. Academic Press, Inc., New York. 5. Meyer, J. L. 1974. Cannery waste water for irrigation and ground
water recharging. Calif. Agric. 28(8):12.
6. Overman, A. R., and K. Hsiao-Ching. 1976. Effluent irrigation of rye and ryegrass. J. Environ. Eng. Div. Am. Soc. Civ. Eng.
102(EE2):475-483.
7. Pearson, G. A., W. G. J. Knibbe, and H. L. Worley. 1972. Corn-position and variation of waste water from food processing plants. USDA-ARS, ARS 41-186. Natl. Agric. Library, Belts-ville, Md.
8. Shannon, S., M. T. Vittum, and G. H. Gibbs. 1968. Irrigating with waste water from processing plants. N.Y. State Agric. Exp. Stn., Geneva, Cornell Univ. Res. Cir. 10.
9. Smith, J. H., R. G. Gilbert, and J. B. Miller. 1976. Redox po-tentials and denitrification in a cropped potato processing waste water disposal field. J. Environ. Qual. 5:397-399.
10. Smith, J. H., C. W. Robbins, J. A. Bondurant, and C. W. Hay-den. 1978. Treatment and disposal of potato processing waste-water by irrigation. USDA Conserv. Res. Report no. 22. Natl. Agric. Library, Beltsville, Md.