Impact of Liberalization on Indonesian Food
Security: An Error Correction Model Approach
Siti Arifah Purnamasari
1, Masyhuri
2, Jangkung Handoyo Mulyo
3, Jamhari
21
Center for World Trade Studies University of Gadjah M ada, Indonesia Email: [email protected]
2
Department of Agricultural Economics Faculty of Agriculture, University of Gadjah M ada, Indonesia
3
Center for Population and Policy Studies, University of Gadjah M ada Indonesia
Abstract—This study aims to examine the impact of trade liberalization i n South East Asia on Indonesia's food security and to analyze the factor that determines food security in Indonesia. Error Correction Model (ECM) approach was used to analyze time-series data from 1980 to 2016. The result is trade liberalization that mark e d by the implementation of the AEC (ASEAN Economic Community), trade barriers elimination among ASEAN member countries, and trade openness affected food security in Indonesia in the short -run and long run. In the short run, food security was significantly influenced by rice availability, consumption growth, openness, rainfall, and AEC implementation. While, rice availability, rainfall, and AEC implementation was influenced by food security in Indonesia in the long run.
Keywords— Liberalization, Rice, Food Security, Error Correction Model
I. INTRODUCTION
Trade liberalization in Southeast Asia has a significant impact on the goods and services trades in the region, especially in Indonesia. The impact of the liberalization of trade in goods and services arises from declining trade barriers and reducing import tariffs, reducing customs procedures, and increasing logistics (Itakura, 2014). The increase in trade cooperation in goods and services in the ASEAN region affected the ease of trade flows between countries. The ease of trade flows will facilitate the flow of food from food surplus countries to the food insecure countries. International trade was connecting food production and consumption and plays an important role in improving food security. It allows global production to take place in the most suitable areas and allows food to flow from the country with abundant food supplies to food-insecure countries (Runge, 2003).
Food security will be achieved if all people, at all times, have physical and economic access to safe and quality food according to their nutritional needs and preferences for active and healthy lives (FAO, 2006). International trade contribution to food security is explained in the Rome Declaration on World Food Security and the World Food Summit Plan of Action. The declaration provides a foundation for food security at the individual, household, state, regional and global levels. International trade has an impact on the dimensions of access to food security through its influence on prices, availability of production factors, economic growth, household income, and labor.
Farmers sell excess crop yields in the local or export markets to obtain other food products. The amount of food that can be obtained is influenced by trade policies that influence the price of food that can be purchased with household income. Manufacturers indirectly benefit from an increase in demand for the goods they sell (Winters et al., 2004; Alesandro et al., 2017).
Numerous studies focused on the impact of liberalization on food security have investigated using several methods, such as qualitative methods was used in Mozambique(Laweki, 2016) in India and China (Gandhi et al, 2014) in developing countries (Boratynska, 2016; Gingrich et al, 2014; Anderson et al, 2014), and in Asia (Reardon et al, 2014). Computable general Equilibrium technique was used in Nepal (Pyakuryal, 2010), in Japan (Tanaka et al, 2011), in the Philippine (Mariano, 2014) others (Hosoe, 2014). Cointegration methods (Dorosh et al, 2016). Generalized Method of Moments (GMM) (Abdulai et al, 2017). Binary logistic regression methods in Pakistan ( Abdullah et al, 2017). Time series analysis in the Philippines(Ebo, 2017).
II. MATERIAL AND METHODS
2.1 Data
Analyzing time-series data from 1980 to 2016, the data was obtained from the Indonesia Central Statistics Agency, Indonesia Ministry of Trade, Indonesia Ministry of Agriculture, Indonesia Meteorology Climatology an d Geophysical Agency, Food and Agriculture of the United Nations (FAO), United Nations Conference and Trade Development (UNCTAD), World Integrated Trade Solution (WITS) World Bank, and ASEAN Secretariat. 2.2 Research Methods
To examine the relationship between food security and AEC, rice prices, consumption growth, availability, GDP per capita growth, openness, rice production growth, rainfall, the econometric analysis using error correction models were used.
First step the stationary or integration degree of the variables in the model using the Augmented Dickey -Fuller test (unit root test) were analyzed. The second step is to examine the long-run relationship between the dependent variable and the independent variable, where Johansen Cointegration Test is used. In the third step, the cointegrated data using the Error Correction Model (ECM) was analyzed.
The relationship between food security as a dependent variable with food prices, consumption growth, availability, GDP growth per capita, openness, production growth, rainfall, and AEC (dummy variable) as the independent variable is formulated in the basic research model below
FS = β0+ β1PRODGt+ β2CONSGt+ β3LnAVt+ β4LnRFt+ β5LnOpent+ β6GDPCGt + β7LnPRCt+ β8AECij+et… (1)
Where FS is Food Security (kcal / capita) ; PRODG is growth of rice production in the year i (percent); CONSG is growth of rice consumption in year i (percent); AV is the availability of rice (tons) calculated by summing production and imports minus exports (tons); RF is Rainfall (mmHg); Open is openness, which calculated by export volume minus import volume divided by GDP value, GDPCG is GDP per capita growth (percent); PRC is the rice price in year t (Rp); Dummy AEC (ASEAN Economic Community), which 1 after AEC was implemented and 0 before AEC was implemented. The Indicator of food security used is energy consumption from rice expressed in kilocalories (kcal), for each individual in a population. The formula for calorie consumption per capita according to FAO (2003) is the total calories available from rice divided by the population. This measurement is the most applied
quantitative indicator of food security and has been used in several previous studies as a measure of calorie consumption and national food security (Smith and Haddad, 2000, 2001, Abdulai, 2017). Increased per capita calorie availability means a decrease in the prevalence of malnutrition and reduced malnutrition in children which are used as indicators of improved nutrition (Smith and Haddad, 2000, 2001; FAO, 2005, 2013; Dawson and Sanjuán, 2011, Abdulai, 2017). The rainfall data used in this study is a proxy of climate change which is considered to have an effect on rice production in Indonesia and national food security (Abdulai, 2017).
2.2.1 Stationary Test
The stationary test aims to ensure that all variables in the equation are stationary. Stationary data are important in time series analyses because non-stationary data can create spurious regression (Gujarati, 2003). Stationary tests are carried out using the unit root test with the Augmented Dickey-Fuller Test (ADF) method (Dickey and Fuller, 1984).
Using the ADF test model, the null hypothesis and other decision-making bases used in this test are based on the critical value of MacKinnon instead of the t-test. Furthermore, the t-ratio is compared with the critical statistical value at the ADF table to find out whether there are unit-roots. If the hypothesis null is accepted it means the variable is not stationary, it is necessary to test t he degree of integration at the first difference. Unit root test hypothesis:
o: β = 0, the data set is not stationary H1: β ≠ 0, the data set is stationary
With test criteria if:
Probability of DF> 0.05 then H0 is accepted Probability of DF <0.05 then H0 is rejected
If the data is not stationary at first degree, then the test must continue until each variable is stationary.
2.2.2 Co integration Test
(5%) then there is cointegration between the independent variable and the non-independent variable.
The cointegration test hypothesis is Ho: β = 0, the data
series are not cointegrated, H1: β ≠ 0, cointegrated data
series.
2.2.3 Error Correction Model
The Error correction model for impact of liberalization on food security can be written as follows
ΔFS = β0+ β1PRODGt+ β2CONSGt+ β3LnAVt +
β4LnRFt +β5LnOpent+ β6GDPCGt+ β7LnPRCt+
β8AEC+ ΔECt ... (2)
III. RESULT AND DISCUSSION
3.1 Stationary test
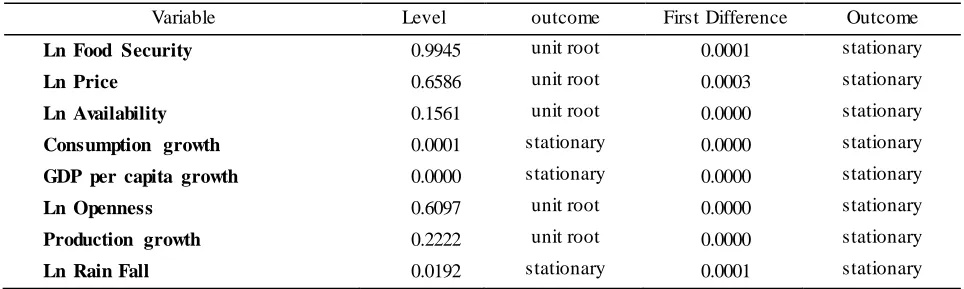
The stationary test is used to test whether the time series data is stationary or not. Unit root test at zero levels indicates that the consumption growth variable (CONSG), rainfall (RF) and per capita GDP growth (GDPCG) are
significant at α = 0.05, it means the data is stationary at
level, while, food security variable (ln FS), rice price (ln PRC), availability ( ln AV), openness (ln OPEN), and
production growth (PRODG) are not significant at α =
0.05, the null hypothesis is accepted, it means that the variable contains the unit root and not stationary at zero levels, therefore it is necessary to test stationary in a higher degree (first difference). See Table 1.
Stationary test in first differences shows that food security (ln FS), rice price (lnPRC), availability (ln AV), consumption growth (CONSG), per capita GDP growth (GDPCG), openness (ln OPEN), production g rowth (PRODG), and rainfall (ln RF) are significant at α = 0.05. Because all data has been stationary, the co -integration test is then carried out.
3.2 Co Integration test
Co integration test results show that the value of the trace statistic is above the 5% critical value; the null hypothesis is rejected at the 5% level of significance. These result Indicates that there is co integration between food security and the independent variable, in other words, there is a long-run relationship between food security variable (ln FS) as dependent variable with consumption growth variable (CONSG), rainfall (RF), per capita GDP growth (GDPCG), rice price (lnPRC), availability (lnAV), openness (ln OPEN), and production growth (PRODG), see table 2.
3.3 Error Correction Model
Error Correction Model is conducted to determine the effect in the short run. The ECT coefficient value is -0.04 or less than one, negative and statistically significant at the 5% level, indicating that error correction slowly adjusts to the long-run balance. The adjustment process towards long-run balance is 4.84 percent while the remaining adjustments occur in the following year. see table 3
3.4 Short Run Estimation
The Result shows that the determination coefficient is 0.713327, implies that 71.33% of food security in Indonesia can be explained by the variables of price, availability, consumption growth, per capita GDP growth, openness, rainfall, production growth, and AEC
Table. 1: Unit Root Test Augmented Dick ey Fuller Result
Variable Level outcome First Difference Outcome
Ln Food Security 0.9945 unit root 0.0001 stationary
Ln Price 0.6586 unit root 0.0003 stationary
Ln Availability 0.1561 unit root 0.0000 stationary
Consumption growth 0.0001 stationary 0.0000 stationary
GDP per capita growth 0.0000 stationary 0.0000 stationary
Ln Openness 0.6097 unit root 0.0000 stationary
Production growth 0.2222 unit root 0.0000 stationary
Table. 2:The Result of Johannsen cointegration test
Hypothesized No. of
CE(s) Eigenvalue Trace Statistic
0.05 Critical
Value Probability
None * 0.853715 243.5500 197.3709 0.0000
At most 1 * 0.785960 176.2731 159.5297 0.0044
At most 2* 0.571714 125.3173 122.6154 0.0082
At most 3* 0.562633 95.63856 92.75366 0.0083
At most 4 0.444680 39.03607 47.85613 0.2588
At most 5 0.246195 18.44872 29.79707 0.5331
At most 6 0.212081 8.556956 15.49471 0.4079
At most 7 0.006106 0.214368 3.841466 0.6434
Table.3: The Result of Error Correction Model estimation
Variable Coefficient t-Statistic Prob.
C 1511.709 8.606460 0.0000
Ln price 0.116507 1.659680 0.1126
Consumption Growth -8.17E-06** -2.199421 0.0398
Ln Availability 5.690280** 2.100145 0.0486
GDP per capita Growth -0.801000 -1.467380 0.1578
Ln Openness 10371.50** 2.419009 0.0252
Production Growth 2.635774 0.823442 0.4200
Ln Rain Fall 0.044473** 2.321382 0.0309
ASEAN Economic Community
(dummy) 280.8668*** 5.642744 0.0000
ECT -0.048352 -0.231170 0.0089
Note: *** represent significance at 1% levels, ** represent significance at 5% levels, * represent significance at 10% levels respectively
implementation, while 28.67% variation in food security is determined by other variables outside the model. F-probability value is les s than 0.05 means that all explanatory variables together have a statistically significant effect on food security in the short run. Consumption growth, rice availability, openness, rainfall, and AEC (dummy) variable have statistically significantly affected food security in the short run. While Price,
production growth, and per capita GDP growth, don’t
have a statistically significant effect on food security in Indonesia in short-run, see table 4
National rice availability, openness, and rainfall will increase energy consumption by 5.69%, 10371%, and
0.04%, respectively. After AEC implementation energy consumption will increase by 280%, while the increasing of rice consumption growth and GDP per capita growth will reduce energy consumption by 8.17% and 0.80%. As the main staple food, the changes in rice prices do not affect rice consumption. Openness positively implies that the existence of openness (trade liberalization) will increase trade volume and have the potential to improve the status of the country's food security (Abdulai, 2017).
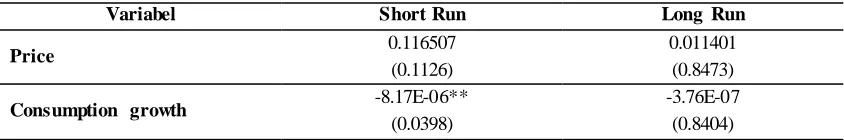
Table. 4: Variable Coefficient for Short Run and Long Run
Variabel Short Run Long Run
Price 0.116507 0.011401
(0.1126) (0.8473)
Consumption growth -8.17E-06** -3.76E-07
Availability 5.690280** 6.415423**
(0.0486) (0.0159)
GDP per capita growth -0.801000 -0.662420
(0.1578) (0.2523)
Openness 10371.50** 7046.244
(0.0252) (0.1040)
Production growth 2.635774 -1.820522
(0.4200) (0.4899)
Rainfall 0.044473** 0.048421**
(0.0309) (0.0226)
AEC 280.8668*** 289.8999***
(0.0000) (0.0000)
Adjusted R-squared 0.713327 0.660614
Note: *** represent significance at 1% levels, ** represent significance at 5% levels, * represent significance at 10% Levels respectively
Per capita GDP (Gross Domestic Product) describes the access of the population's economy, including access to food. GDP per capita is one indicator of the purchasing power of the population. The higher GDP per capita shows the higher purchas ing power of the population and the lower level of poverty. Bennet (1954) Trade openness encourages exports for abundant products in a country, including low-skilled workers (in some developing countries) that will create employment opportunities and increase workers' incomes. This kind of process can play an important role in reducing poverty and increasing food security. (Jaffe et al, 2011). Several previous studies such as Grossman and Helman (1992), Frankel and Romer (1999), Wacziarg and Welch (2003), Sohn and Lee (2006), Chen and Gupta (2006), and Chang et al. (2009) concluded that foreign trade has an important role in spurring economic growth in most countries in the world. Setiawan (2015) examined the effect of rainfall on food productivity in East Java showed that the relationship of annual rainfall in Bojonegoro Indonesia with rice production has a positive correlation of 0.59, which means that the higher rainfall in this region the greater the production of rice in the region. Agriculture is highly depending on rainfall and climate change, especially changes in the hydrological cycle is a threat to production and food security (Nelson et al., 2014)
%.
states that if people's income increases, they will want to consume various types of food due to lifestyle changes. 3.5 Long Run Estimation
The determination coefficient in the long run estimation is 0.6606. It implies that 66.06% of the variation in food security in Indonesia can be explained by variations of price, availability, consumption growth, per capita GDP growth, openness, rainfall, production
growth, and AEC implementation while 33.94% variation in food security is determined by other variables outside the model.
The coefficient in the long run estimation is 0.660614. It implies that 66.06% of the variation in food security in Indonesia could be explained by the variations of price, rice availability, consumption growth, per capita GDP growth, openness, rainfall, production growth, and AEC implementation. 33.94% variation in food security is determined by other variables outside the model.
Rice availability, rainfall, and AEC implementation have statistically significantly affected food security in the long run, while price, consumption growth, Per capita GDP growth, openness, and production growth has no significant effect in long run.
The Increasing of national rice availability and rainfall will increase energy consumption per capita 6.41% and 0.05%, furthermore after AEC implementation energy consumption will increase by 289%. While the increasing in consumption growth, per capita GDP and productivity growth, will reduce energy consumption by 3.76%, 0.66%, and 1.82%.
IV. CONCLUSION
such as tubers, fruits, etc. as alternative energy sources. Climate change especially changes in rainfall affect rice production and food security in Indonesia. In the short term, the factors that affect food security in Indonesia are the availability of rice, consumption growth, openness, rainfall, and AEC implementation. Whereas in the long run it is influenced by the availability of rice, consumption growth, openness, rainfall, and MEA implementation. There are several recommendations that can be taken to improve food security in Indonesia through increasing factors that have a significant influence on food security. Policymakers can choose long-term or short-term policies or joint policies. Therefore, in the short term, the Indonesian government needs to pay attention to and increase rice supply to meet food energy needs through increasing national rice production and imports. Regulate policy instruments in increasing rice productivity and trade policies to improve national food security. Likewise in long-term policies, the government needs to pay attention to the availability of national rice, consumption growth, and trade openness.
REFERENCES
[1] Abdulai, A, Dithmer J. (2017). Does trade openness contribute to food security? A dynamic panel analysis.
Journal of Food Policy 69. 218–230
[2] Alesandro, O, Daniel, C., Swinnen, J., (2017). Trade Liberalization and Child M ortality: A Synthethic Control M ethod. Working Papers Department of Economics, Faculty of Business and Economics, Department of Economics, KU Leuven, Belgium
[3] Anderson K, Strutt,A, (2014). Food Security Policy Options for China: Lessons from Other Countries.
Journal of Food Policy 49 (2014) 50–58
[4] Bennett, M .K., 1954. The World's Food. Harper, New York
[5] Boratynska,K, Huseynov,R.T.,( 2016). An innovative approach to food security policy in developing countries.
Journal of Innovation & Knowledge. p.6
[6] Security. ADB Economics Working Paper Series. No 368. September 2013.
[7] Dickey DA, Fuller WA. (1979). Distribution of the estimators for autoregressive time series with a unit root. J Am Stat Assoc 1979:427–31.
[8] Dollar, D. (1992). Outward Oriented Developing Economic Really Do Grow M ore Rapidly: Evidence from 95 LCDs. 1976-85. Economic Development and Cultural Change, 40 (3): 523-544.
[9] Dorosh, P.A., Rashid, S., van Asselt, J.(2016). Enhancing Food security in South Sudan: the role of markets and regional trade. Agric. Econ. 47 (6), 697–707
[10]Ebo, J.B.F, (2017). Sustaining Food Security in the Philippines: A Time Series Analysis. Asian Journal of Agriculture and Food Sciences Vol 05.
[11]Engle, R.F., Granger,C.W.J (1987).Cointegration and error correction: Representation Estimation And testing.
Econometrica 55, 251–276.
[12]FAO and WWC. (2015). Towards a Water and Food Secure Future: Critical Perspectives for Policy-makers.
Food and Agriculture Organization of the United Nation, Rome. World Water Council, M arseille.
[13]Feleke, S.T., Kilmer, R.L., Gladwin,C.H. (2005). Determinants of Food Security in Southern Ethiopia at the Household Level. Agric. Econ. 33 (3), 351–363.
[14]Gandhi,P.V., Zhou, Z, (2014). Food demand and the food security challenge with rapid economic growth in the emerging economies of India and China. Journal of Food Research International 63, p.108–124
[15]Gingrich, C.D., J.D. Garber. (2010). Trade Liberalization’s Impact on Agriculture in Low Income Coubtries: A Comparison of El Savador and Costa Rica.
The Journal of Developing Areas, 43 (2): 1-17.
[16]Gujarati, D.N, (2003). Basics Econometrics. M cGrawHill [17]Hosoe,N,(2014). The double dividend of agricultural trade
liberalization: Consistency between national food security and gains from trade. Journal of Asian Economics 43, p. 27–36
[18] Itakura,K. 2014. Impact of liberalization and improved
connectivity and
facilitation in ASEAN. Journal of Asian Economics, 35, 2–11
[19]Johannsen’s., (1988). Statistical analysis of cointegration vectors. J. Econ. Dyn. Control 12 (2), 231–254.
[20]Johansen, S., Juselius, K., (1990). M aximum likelihood
estimation and inference on
cointegration with applications to the demand for the money. Oxford Bulletin of Economics and Statistics 52, 169–210
[21]Laweki, L. (2016). The Impact Of Trade Liberalization On Food Security In M ozambique. Thesis. University of South Africa
[22]M ariano,M .J.M ., Giesecke,J.A., (2014). The macroeconomic and food security implications of price interventions in the Philippine rice market. Economic Modelling 37, p. 350–361
[23]M axwell,S. Frankenberger, T. (2012). Household Food Security: Concept, Indicators, M easurement: A Technical Review, IFAD, UNICEF, Rome
[24]Nelson,G.C.,Valin,H.,Sands,(2014).Climate Change Effects On Agriculture: Economic Responses To Biophysical Shocks. Proc. Natl. Acad. Sci. 111, 3274– 3279. http://dx.doi.org/10.1073/pnas.1222465110
[25]Pyakuryal, B., Roy, D., Thapa, Y.B. (2010). Trade liberalization and food security in Nepal. Food Policy 35 (1), 20–31.
[26]Reardon, T., Timmer, C.P., (2014). Five Inter-Linked Transformations in The Asian Agrifood Economy: Food Security Implications. Global Food Security 3, p. 108–117
and Globalization. DC, International Food Policy Research Institute, Washington
[28]Smith,L.C. Haddad,L. ,2001. How important is improving food availability for reducing child malnutrition in developing countries? Agricultural Economics 26, 191-204
[29]Tanaka, T., & Hosoe, N. (2011). Does agricultural trade liberalization increase risks of supply -side uncertainty? Effects of productivity shocks and export restrictions on welfare and food supply in Japan. Food Policy, 36(3), 368–377.
[30]Wacziarg, R. 2001. M easuring the Dynamic Gains from Trade. World Bank Economic Review, 15(3): 393-429. [31] Winters, L., M cCulloch, N., M cKay, A., 2004. Trade